2GIS Pro smart assistant
The documentation provides a description with examples of the interface in Russian.
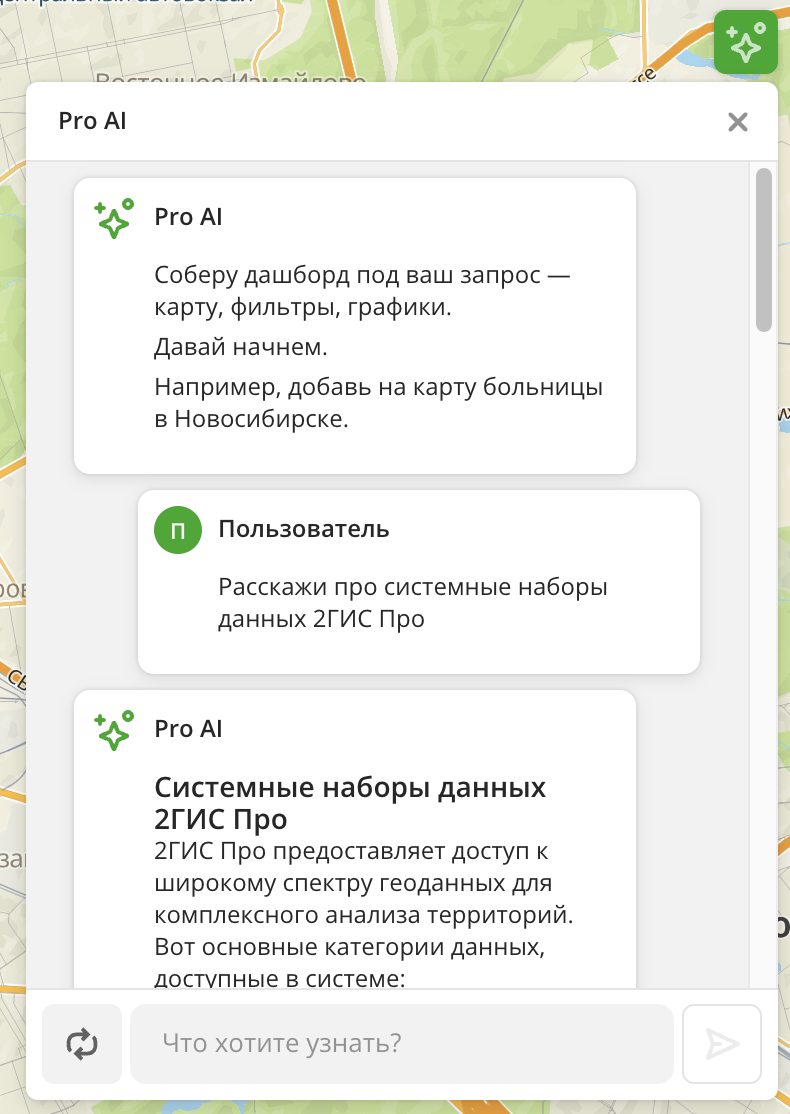
The 2GIS Pro smart assistant is a tool that uses artificial intelligence to recognize natural language queries and transform them into ready-made geoanalytical solutions. Use the assistant to quickly extract useful information from data, perform geoanalytical tasks, and create interactive dashboards with scenes, layers, and widgets.
Depending on your plan, the number of queries to the assistant per day may be limited.
Main advantages
-
Fast query processing
Delivers ready-made analytical reports and up-to-date data in a short time.
-
Accessibility for users
Allows analysts to simplify their work with the service and reduce time spent on data analysis and routine tasks. Helps users without deep knowledge in analytics to get professional reports without studying the details of the service.
-
Ready-to-operate detailed analytics
Not only executes separate commands but also implements complex analytical scenarios. Examples of scenarios: finding a location to open a business, competitor analysis, demand assessment, data visualization on charts, and others. See the list of usage scenarios.
Getting started
- Go to the Main tab.
- Click
 icon in the upper-right corner.
 - Enter a query. See query examples in the Usage scenarios section.
- Click
 icon to get the result.
 - Use follow-up queries to refine the analysis.
How does the assistant work?
After you submit a query, the assistant performs the following operations:
-
Query recognition. Uses large language models (LLMs) to understand the context of your business query. For example, it interprets the query "Show popular coffee shops" as a task to display cafés with a high rating.
-
Decomposition and tool selection. Breaks down a complex task into a sequence of steps and selects appropriate actions to execute each one.
For example, for the query "Build 10-minute walking proximity zones from metro stations in the Presnensky district and count the number of residents", it performs the following steps: layer creation, proximity zone creation, population count.
-
Interaction with 2GIS Pro data. Uses built-in datasets that are regularly verified and structured: Firms, Buildings, Demand, Population, and others. The assistant uses data only from datasets you have access to.
-
Response creation and visualization. Aggregates all obtained results into a single response and creates an interactive dashboard with layers, widgets, and an analytical summary.
Example
Example query to the assistant: "Create a dashboard and show hair salons, demand for hair salon services, and living population in Saratov. Build a widget with the distribution of hair salons by rating. Color the hair salons on the map based on the number of reviews".
Within a few seconds, you will receive a ready-made multi-layered interactive dashboard that allows you to compare the location of popular hair salons with zones of high demand and high population density. The assistant will create a dashboard with a scene containing:
-
Three layers with data samples and different visualization methods:
- Hair salons: sample from the Firms dataset. The visualization method is Point. Points representing organizations are colored based on the number of reviews according to the color scale. This allows you to quickly evaluate the most popular places.
- Demand for hair salon services: sample from the Demand dataset. The visualization method is Hexbin. Shows zones with the highest concentration of search queries related to hair salons.
- Population: sample from the Population dataset. The visualization method is H3. Shows H3 cells (hexagons) colored based on population density.
-
A column chart widget with the distribution of hair salons from the sample by the
Ratingattribute.
Query result:
Usage scenarios
The assistant provides answers as text, interacts with the map, and performs various operations. Examples of queries the assistant handles:
- "Show all pharmacies in Moscow that are open 24 hours".
- "Build a 10-minute walking proximity zone from metro stations and estimate the number of residents in the Timiryazevsky district of Moscow".
See more query examples below, as well as a list of scenarios the assistant can help with.
Getting information
The assistant acts as an expert on data and service capabilities and helps get the following information:
- Information about built-in data. Get reference information about any built-in dataset in 2GIS Pro. Example query: "Tell me about the built-in datasets in 2GIS Pro".
- Explanation of dataset parameters. Learn the meaning of any parameter or filter. Example query: "What does the working population parameter mean in the Population dataset?".
- Suggestions for using datasets. Get recommendations on using data in geoanalytics. Example query: "How can I use the Pedestrian traffic dataset?".
- Description of BI analytics capabilities. Learn what business intelligence tools can do in 2GIS Pro. Example query: "What can Pro do in terms of BI and chart building?".
Data filtering
With the assistant, you can apply complex filters and create targeted data samples without manual configuration. The assistant performs the following tasks:
- Applying filters by attributes and territories. Specify in your query which data to keep in the sample. Example query: "Show coffee shops in the Northwestern district of Moscow with a rating of 4 and above on the map".
- Support for ranges and multiple conditions. Use complex filters consisting of several conditions. Example query: "Filter car traffic and show data only for May and June 2025, during morning hours on weekends".
- Filter management. Track applied filters and modify them. Example query: "What filters are currently applied to the car traffic layer?".
- Creating layer copies with new filters. Create layer copies for comparative analysis by applying new filters to them. Example query: "Create a copy of the Age-sex composition of the population layer, but for the 18–35 age group".
- Filtering custom data. Apply filters to your own data. Example query: "Keep only buildings under construction in the sample".
Working with scenes and layers
The assistant can work with layers based on samples from built-in and custom data, as well as with dashboards and scenes within which layers are created. The assistant performs various tasks:
- Creating layers with built-in data. Add necessary data to a scene with a single command. Example queries: "Add restaurants in Novosibirsk", "Show all residential buildings under construction in Saint Petersburg".
- Creating multiple layers. Create multiple layers on a scene simultaneously for selected territories. Example query: "Add car traffic and supermarkets in Vladimir to the map".
- Getting layer information. Find out what data a layer contains and what visualization parameters are used. Example query: "What does the car traffic layer contain?".
- Managing layer visibility. Hide layers on the map and enable their display. Example query: "Hide the supermarkets layer".
- Deleting layers. Remove unnecessary layers from the map. Example query: "Delete the car traffic layer from the map".
- Working with custom data. Upload your own data and use it the same way as built-in data. Example query: "Add data with buildings under construction in Moscow". The assistant will find the dataset by the relevant name you specified.
Data visualization and widget creation
The assistant can configure data visualization on the map for each layer and turn data into clear graphs and charts using widgets. The assistant performs various tasks:
- Configuring layer display. Change the display style of data on the map. Example query: "Color elements of the restaurant layer based on the number of reviews".
- Building graphs and charts. Create various widget types: bar chart, column chart, histogram, line graph, and others. You can either specify a particular chart type or submit a general query. Example queries: "Build a chart with the distribution of the average check in cafés and restaurants", "Create a histogram of competitors' average check with a step of 200 rubles", "Build a pie chart with the population distribution by sex".
- Recommendations for using graphs. Get advice on interpreting and using visualizations. Example query: "How to use a column chart to evaluate the target audience?".
- Building graphs based on custom data. Visualize your uploaded data. Example queries: "Create a chart showing the distribution of construction object types by average completion rate", "Create a pie chart for monitoring construction objects".
Geospatial analysis
Perform deep geospatial analysis and calculate proximity zones. The assistant performs the following tasks:
- Building proximity zones. Create proximity zones: areas whose boundaries can be reached on foot, by car, or by public transport within a certain time period. Example query: "Build 15-minute walking proximity zones from schools".
- Data aggregation within zones. Perform data aggregation within proximity zones: transform data into a single resulting value (sum, average, etc.) and collect statistics for any layers within the boundaries of proximity zones. Example query: "How many people live within 5-minute proximity zones from clinics?".
- Geomarketing answers. Get quick and accurate answers to specific questions. Example query: "How many restaurants in Moscow have a rating above 3?".
Complex scenarios
The assistant can perform complex, multi-step analysis with a single query and build a ready-made dashboard with recommendations. Formulate your business task in one query. Example query: "Where should I open a pharmacy in Pyatigorsk?".
Recommendations for use
To get high-quality analysis results, follow these recommendations:
-
Describe your business task, not the tools.
Example of a good query: "Analyze competitors for opening a new café in the city center".
-
Provide more details.
Example of a good query: "Show restaurants in the Khamovniki district on the map with a rating above 4.5 and an average check from 1,500 to 3,000 rubles".
-
Use an iterative approach: start with a general query and gradually refine it. For example:
- Step 1: "Show all pharmacies in Samara".
- Step 2: "Keep only pharmacies that are open 24 hours".
- Step 3: "Build a 5-minute walking proximity zone for them".
-
Combine data and add new layers to get a complete picture.
Example of a good query: "Add pedestrian traffic and population density data to the layer with potential locations".
Principles of trust and responsible use
-
Data confidentiality and security
All queries and data are processed in accordance with strict security standards. Personal and commercial data remain confidential.
-
Accuracy and limitations
The assistant may not fulfill a query in the following cases:
- The query is ambiguous.
- Data is not available for the specified territory or category.
- The query goes beyond the functionality scope. For example, it contains a request to provide personal data or perform a non-analytical task.
-
Human at the center of analysis
The assistant automates routine tasks, but final interpretation and decision-making remain with the user.
-
Response transparency
The assistant strives to provide transparent analysis results and explain what data the report is based on.
What's next?
- Getting started.
- Get to know how to work with Data and Data visualization.
- Learn more about Layers, Dashboards, Scenes, and Widgets.
- Learn about ready-made Analytics scenarios.