Legend
With the Legend widget, you can view information about the data for layers added to the dashboard scene. The widget is automatically created when the scene is created, and any changes to the layer data (e.g., modifying the sample) are reflected in the legend.
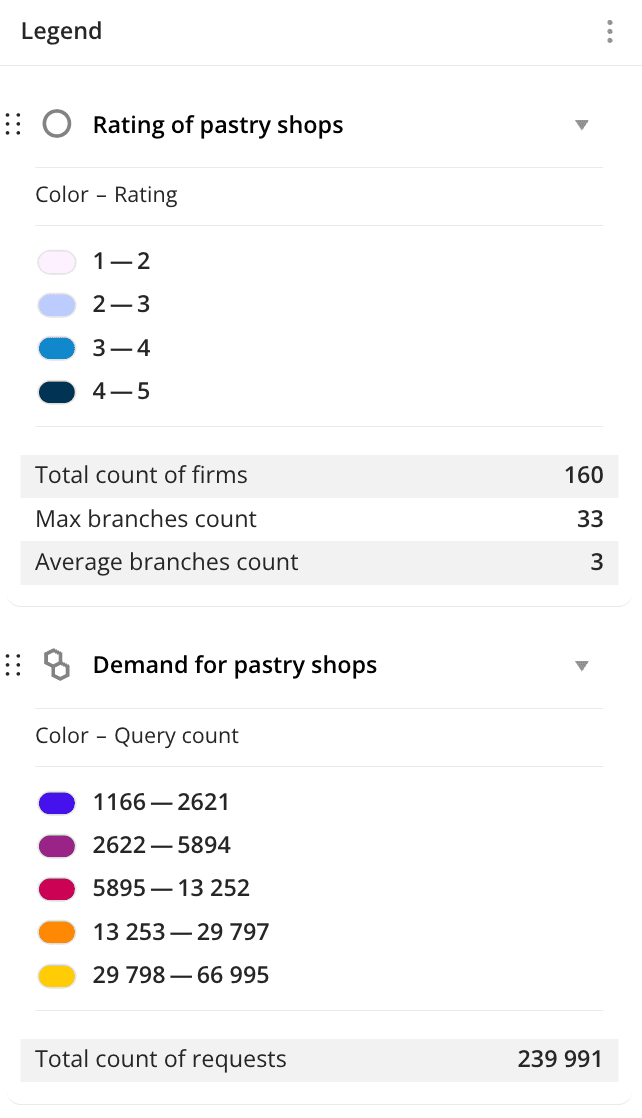
Example of the Legend widget:
Main features
-
The color palette and data ranges are inherited into the legend from the settings of the data layer visualization. If necessary, you can customize a color palette and data ranges for the legend and also change the order of the data layers in the widget.
-
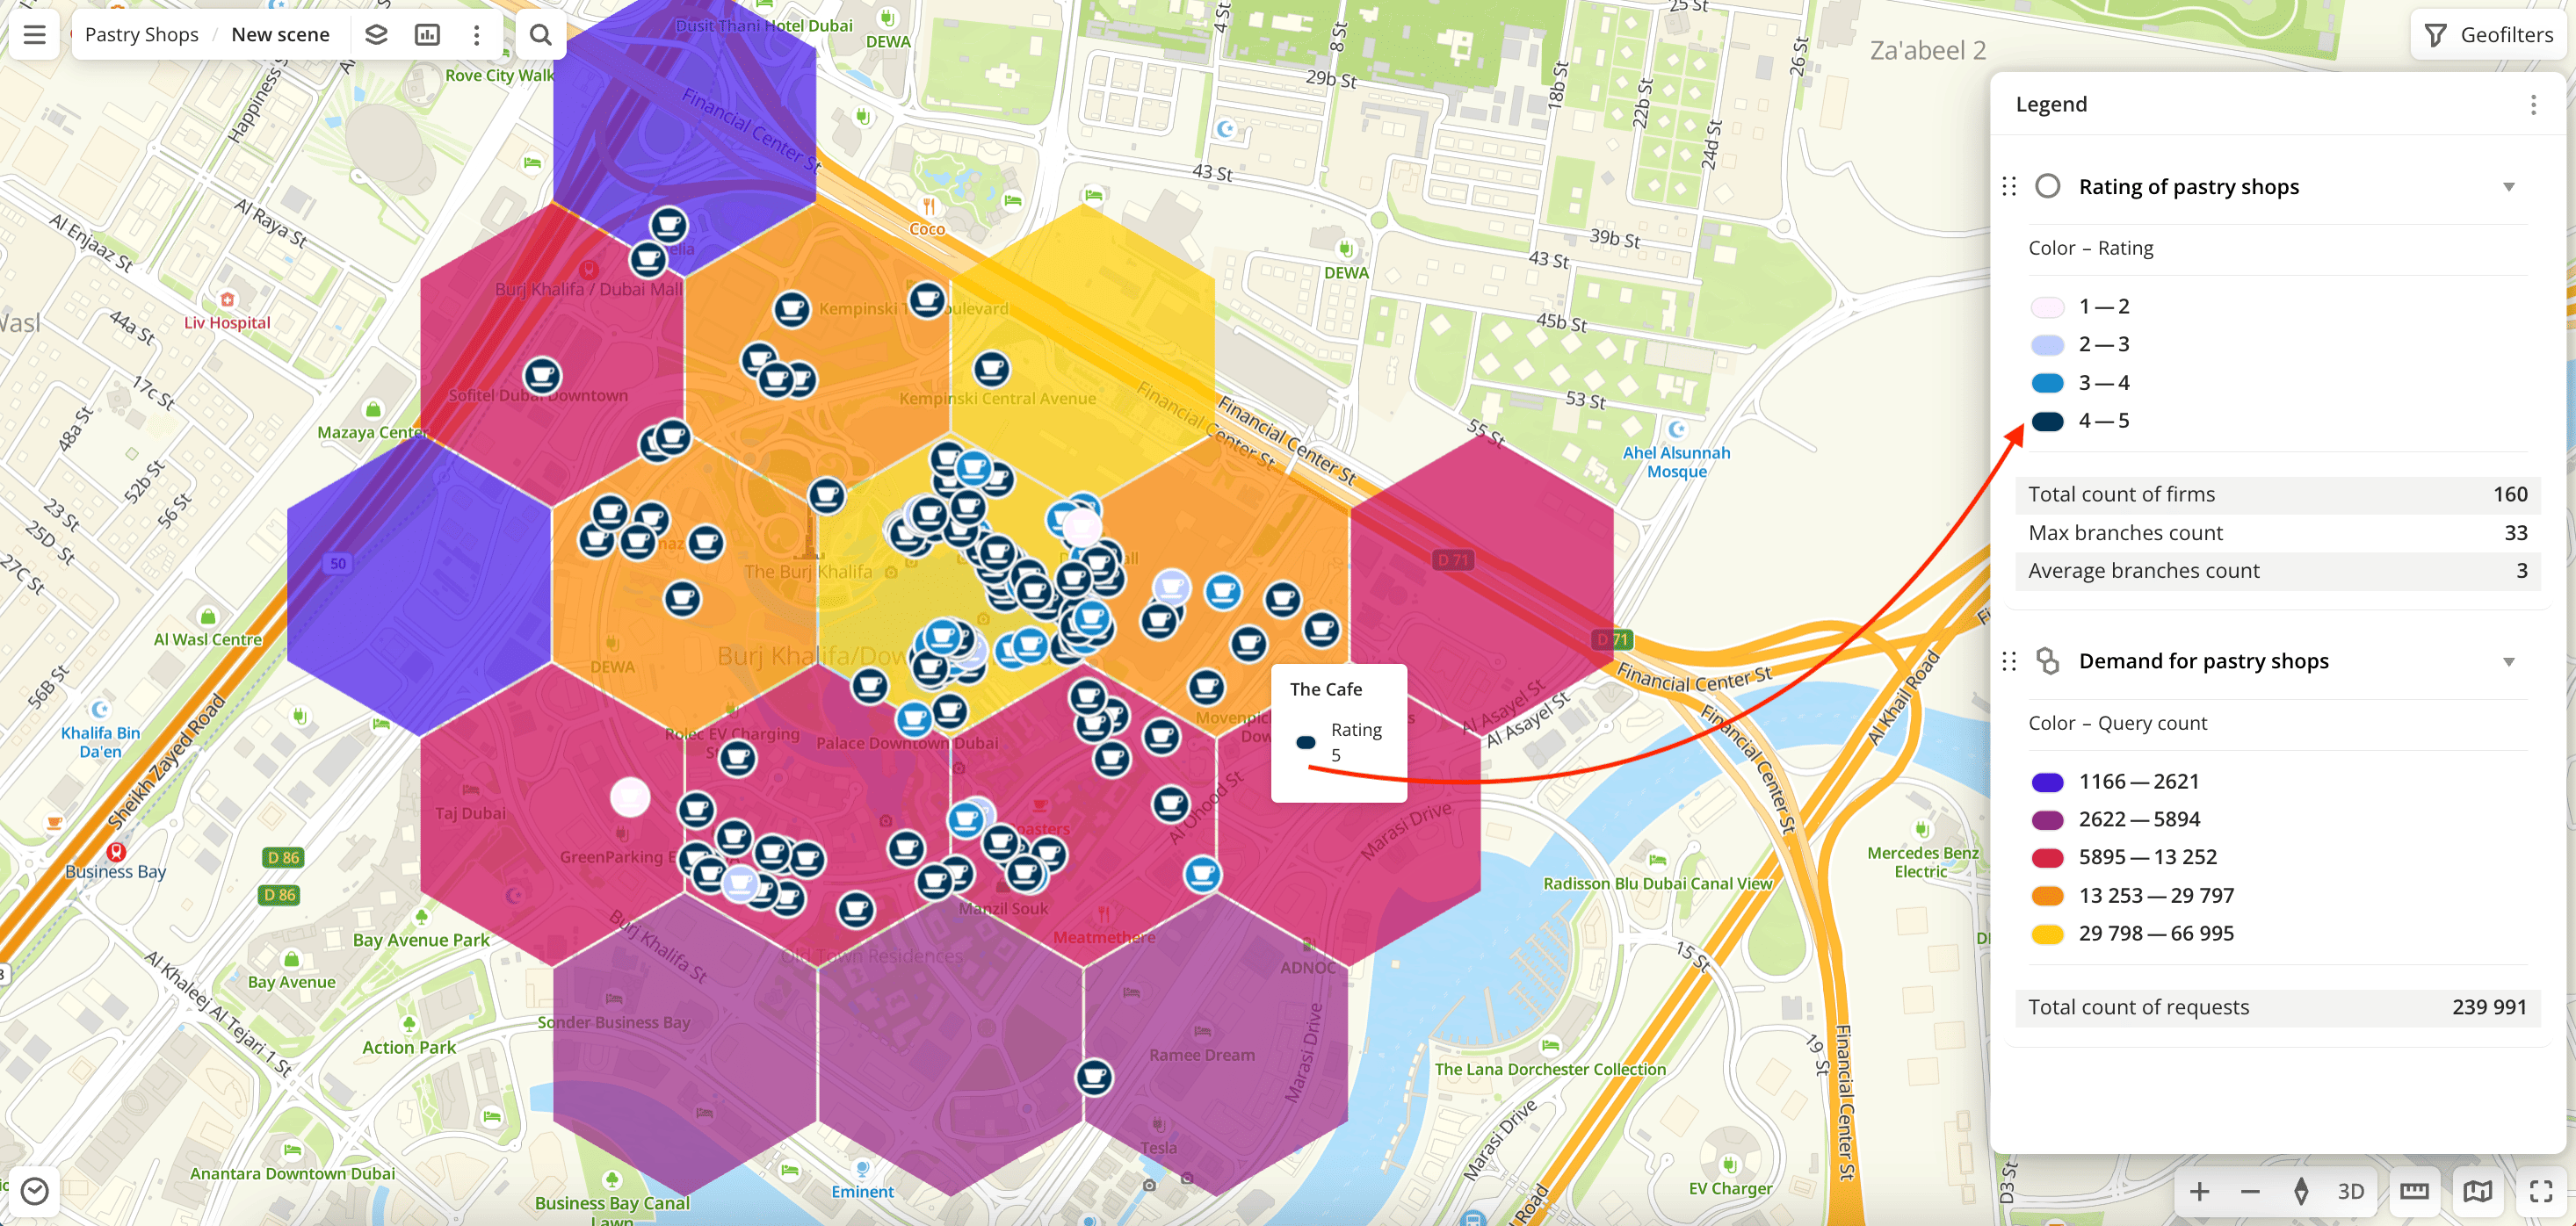
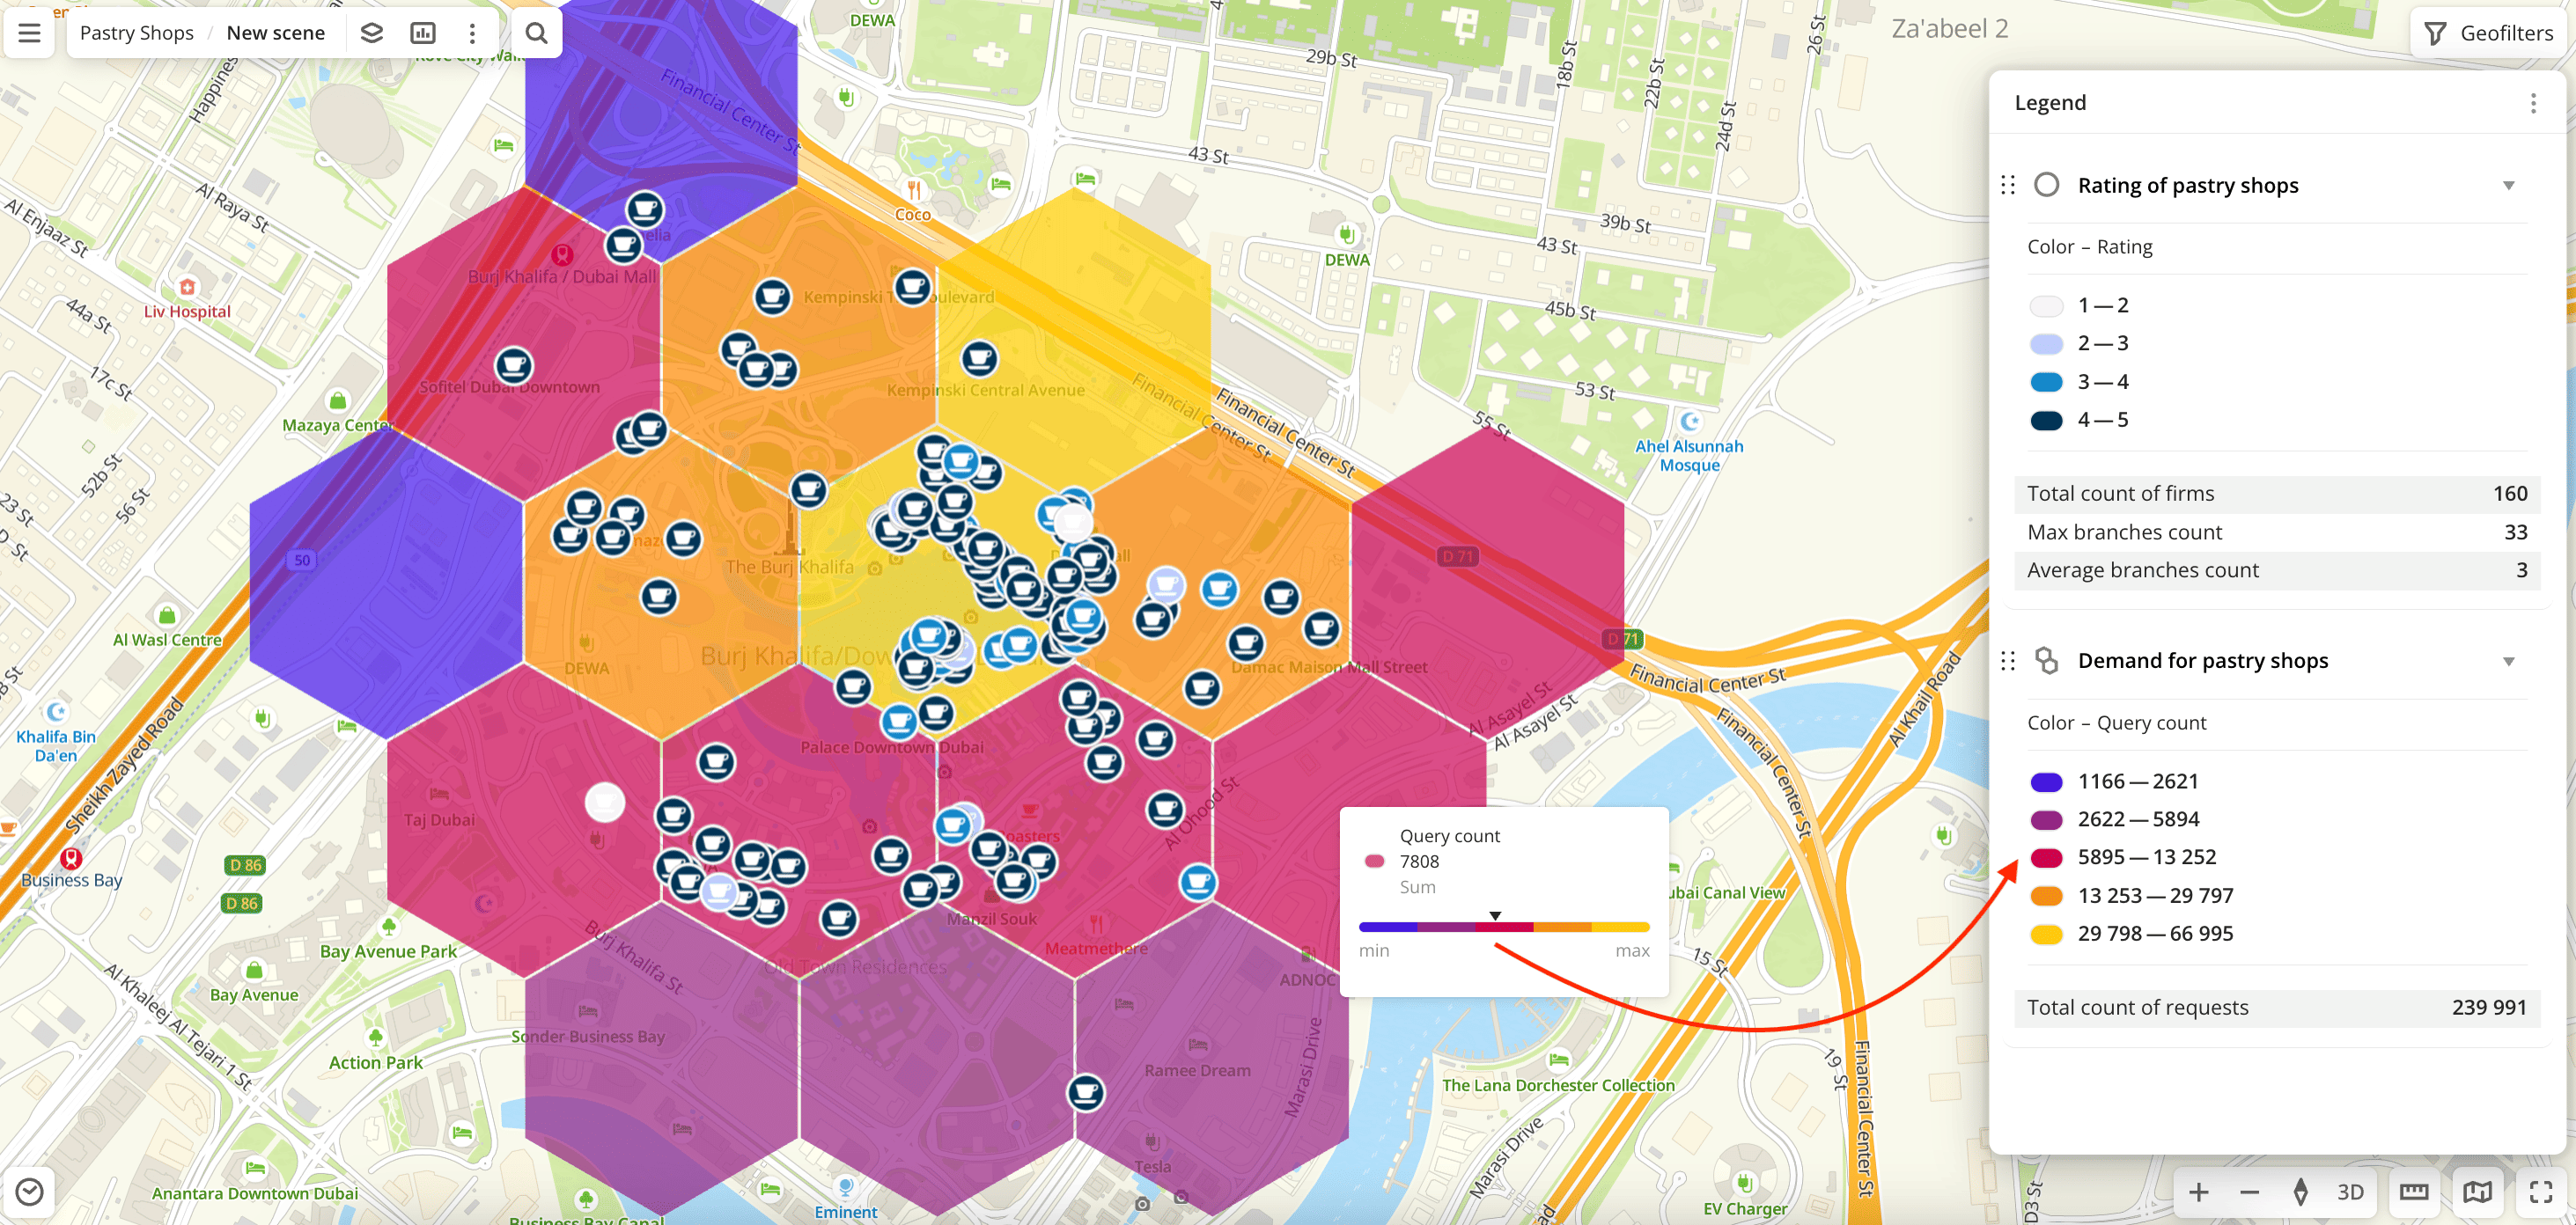
When you hover over a visualization element on the map, a tooltip with the legend is displayed:
-
If the filtering by territories or data attributes is applied on a dashboard scene, only the values that match the filters are displayed in the widget. For more information, see the Filtering data on a scene instruction.
Customizing a color palette and data ranges for the legend
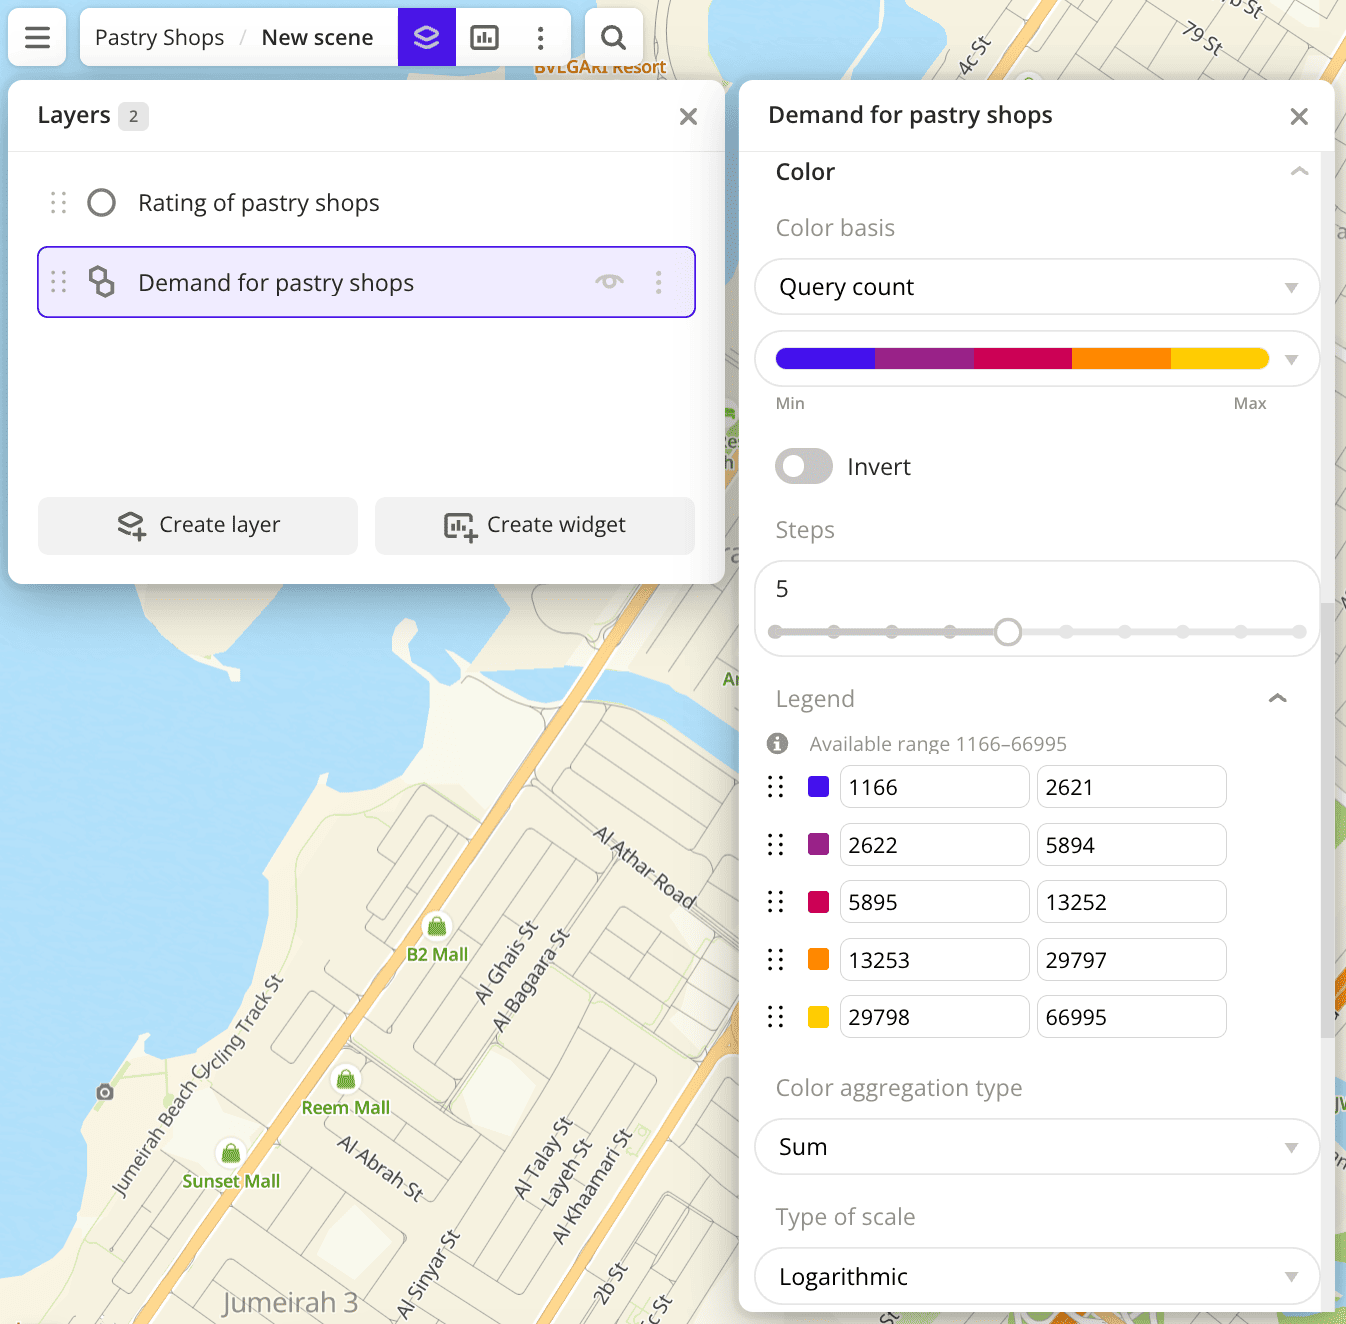
You can customize a color palette and data ranges for the legend by modifying the layer visualization settings. Customization of ranges is not available for the Heatmap visualization method.
- Go to the Dashboards tab and open the dashboard.
- Open a scene using the arrows
 and
and  . If there is only one scene in the dashboard, it opens automatically.
 - To open a layer, click
 icon and select the required layer.
 - Specify the legend parameters depending on the visualization method.
Changing the order of data layers in the legend
By default, the data layer blocks in the Legend widget are displayed in the order they are arranged in the scene. You can customize the order of the layers in the legend without changing the order in the layer list. For example, if you need to show specific layers at the top of the legend.
- Go to the Dashboards tab and open the dashboard.
- Open a scene using the arrows and . If there is only one scene in the dashboard, it opens automatically.
- If the legend is not displayed on the map, in the top menu of the dashboard, click
 icon. In the list of widgets, select the checkbox (
 ) for the legend or click
  icon and select Show on map.
 - Hold down
 icon for the required layer and drag it.
What's next?
- Get to know more about other Widgets types.
- See available Operations with widgets.
- Getting started.
- Get to know how to work with Data and Data visualization.
- Learn more about Layers, Dashboards, and Scenes.
- Learn about ready-made Analytics scenarios.