Commercial real estate
The documentation provides a description with examples of the interface in Russian.
The Commercial real estate dataset provides aggregated information about rental and sale prices of commercial real estate from external databases for the last year.
Usage scenarios
The Commercial real estate dataset helps to solve the problems:
- Selecting a location for opening an office. It allows you to compare rental prices of office spaces in different parts of the city and choose the optimal location for opening an office.
- Evaluating profitable retail zones. It helps small and medium-sized businesses to analyze prices for retail spaces and determine where to rent locations for opening a store, café, or bakery with the most profitable conditions.
- Territorial expansion. It allows chain companies to estimate the costs of opening a branch in a new city or district, as well as prioritize streets by the ratio of commercial space rental costs, traffic, population, and demand.
- Planning warehouse and logistics infrastructure. It helps logistics companies to compare rental prices for warehouse spaces in different districts of the city and choose facilities with the optimal ratio of rental cost and transport accessibility.
How is the data collected?
Data is collected from external databases.
Data update and history
- Update frequency: data is updated once a month. Each month, data for the last year is uploaded. For example, in June 2025, data on offers from May 2024 to May 2025 was uploaded.
- History: historical data is not available. You can only view the latest actual data.
Available territories
Data is available only for Russia.
The data may not be available throughout the entire country, but only in populated areas where 2GIS is present. To check data availability, use geofilters or contact technical support.
Data availability
-
Cloud-based (2GIS Pro service):
- Demo tariff plan: data is not available. To start working with the data, change the tariff plan and request access to the dataset.
- Other tariff plans: data is available upon request.
-
On-Premise (installation of the service in a private environment): data is not available.
Getting started
-
Go to the Main or Data tab.
-
Select the Commercial real estate dataset.
-
In the Geofilter settings dialog, select up to 50 territories for which the data sample is created. You can use standard and custom territories and also build polygons, proximity zones, and circles on the map. For more information, see the Geofilters section. After you select the territories, click Done.
-
On the Filters tab, select basic filters for data analysis:
- To analyze the rental market, select
Rentin the Deal type filter and use the Average price filter. - To analyze the sales market, select
Salein the Deal type filter and use the Average price per m² and Average price filters. - To view data by space type, select the Space type filter.
- To analyze the rental market, select
-
Set the remaining filters if necessary.
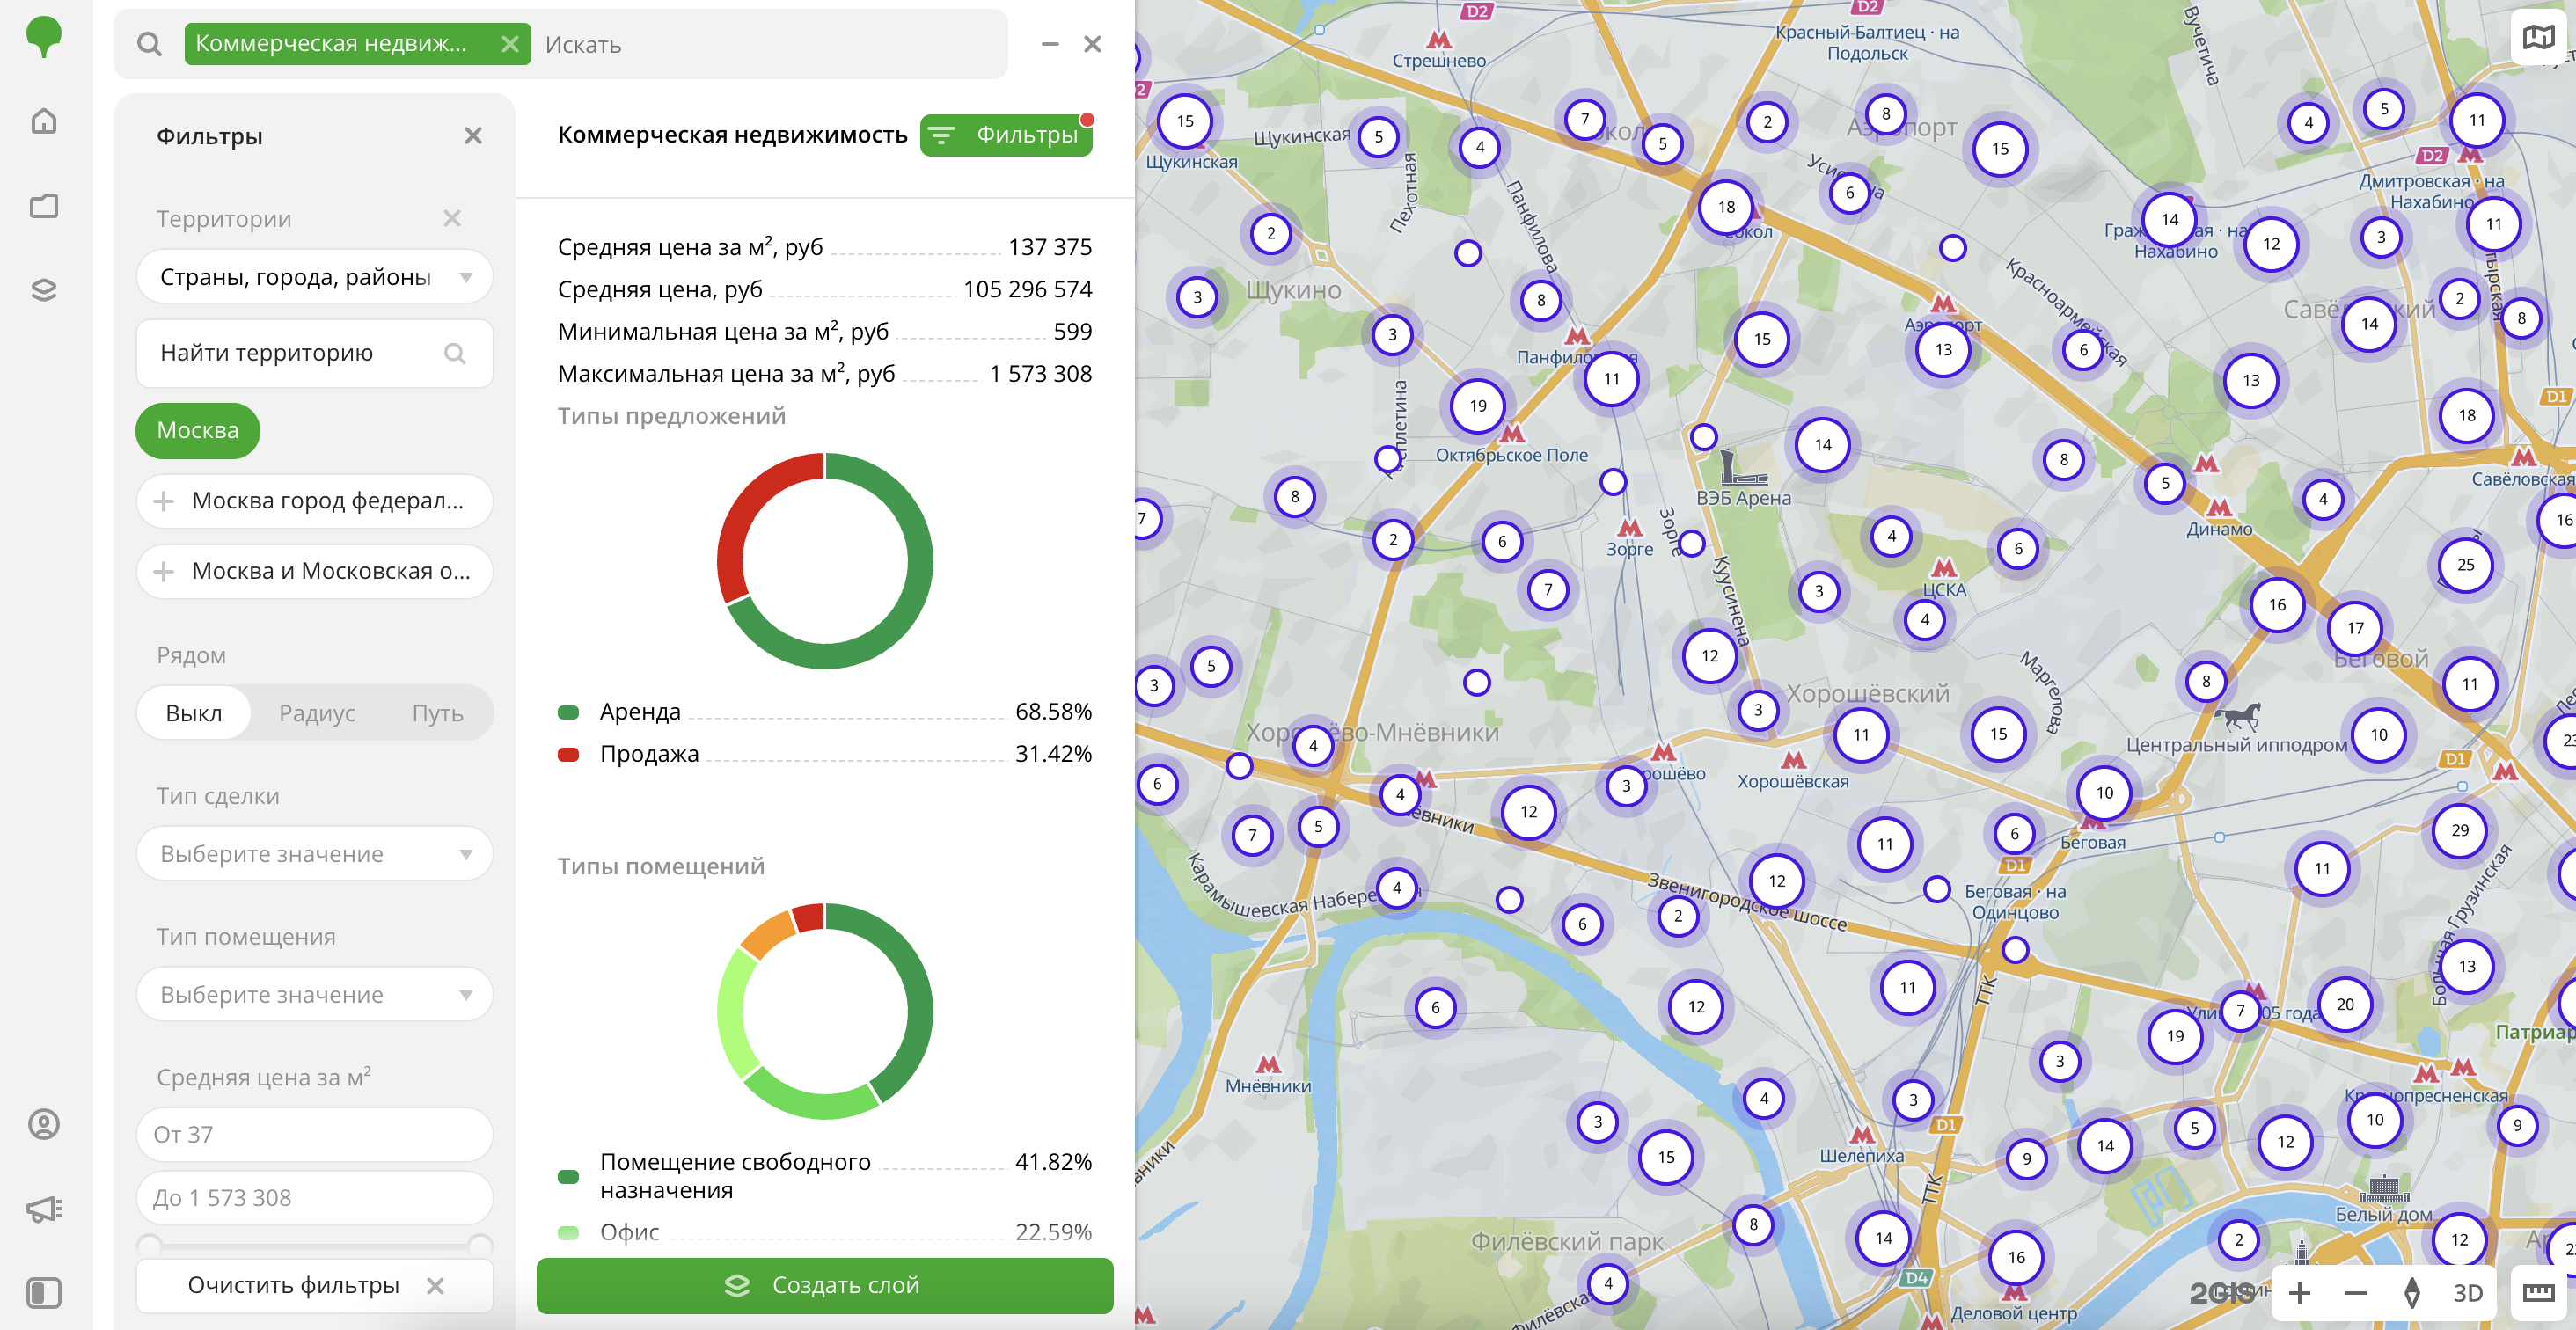
The data is displayed on the map as centroid points: the centers of the object geometries. Available filtering results:
- Average price per m² in rubles.
- Average offer price in rubles.
- Minimum price per m² in rubles.
- Maximum price per m² in rubles.
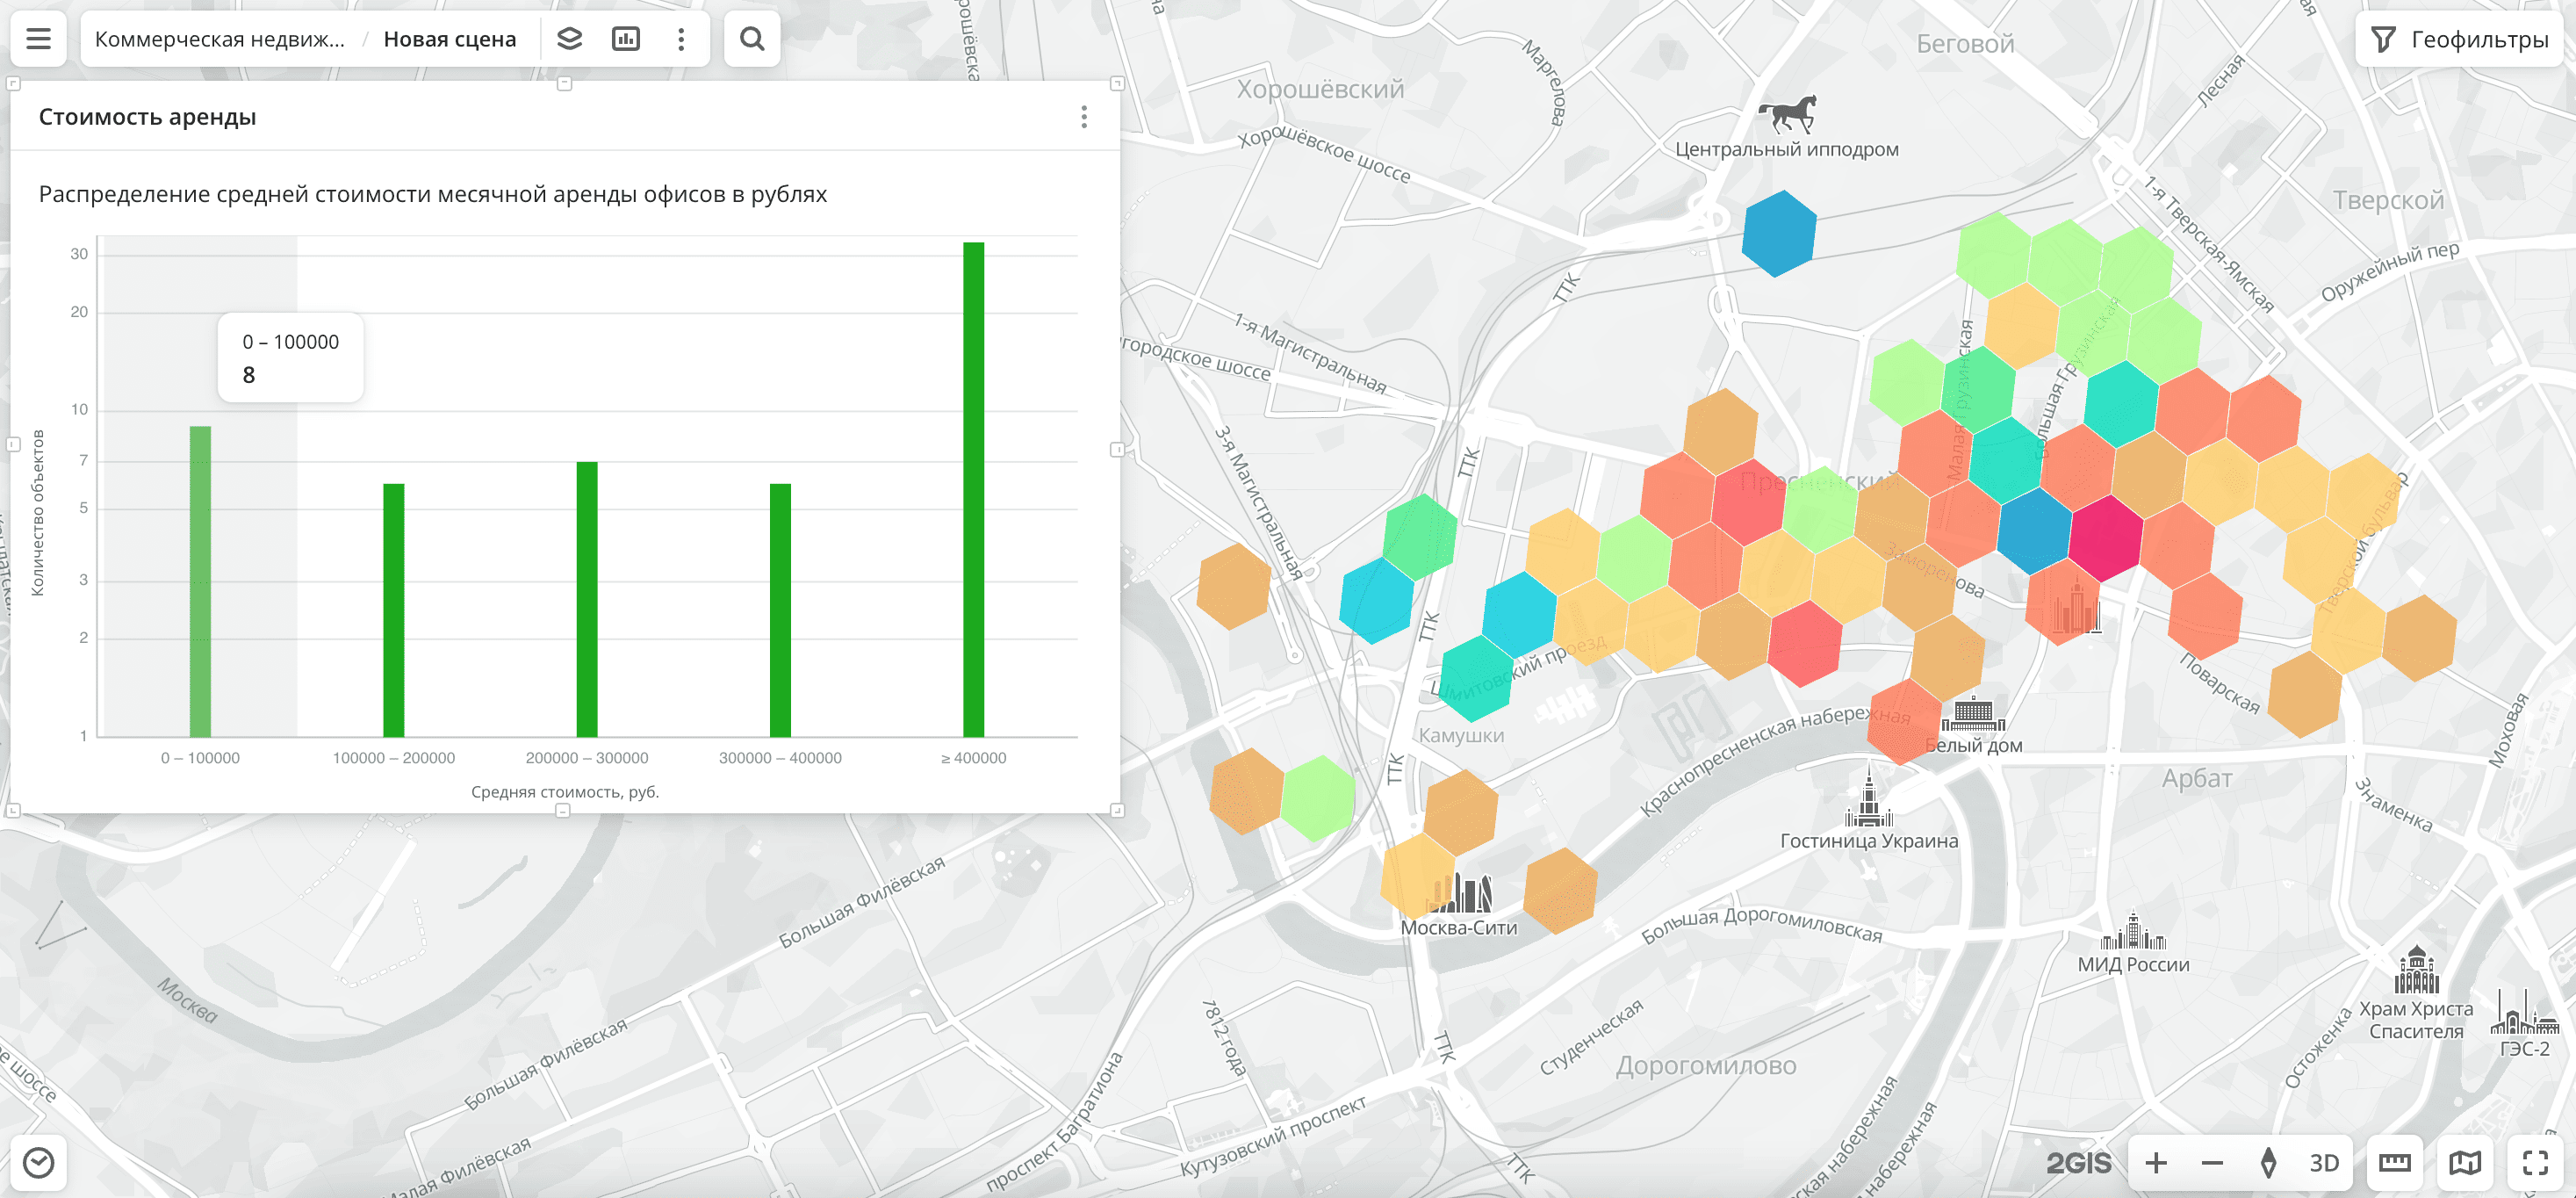
- Chart with the distribution of offers by deal type. Displayed if both deal types are selected.
- Chart with the distribution of offers by space type. Displayed if more than one space type is selected.
To save the data sample, click Create layer and customize data visualization.
Filters
For the Commercial real estate dataset, the following filters are available:
- Deal type:
RentorSale. For correct data analysis, it is recommended to select only one option, as rental and sale prices differ significantly. - Space type: type of space (for example, office, general-purpose space, building, warehouse, etc.).
- Average price per m²: average price of commercial real estate per square meter in rubles. Calculated across all offers within one H3 cell (hexagon).
- Average price: average price of commercial real estate in rubles. Calculated across all offers within one H3 cell (hexagon). For the
Rentdeal type, it is the average monthly rent for all objects. For theSaledeal type, it is the average price of all objects.
To reset the parameter filter, click ![]() icon next to the filter name. To reset all parameter filters, click Reset filters at the bottom of the tab.
icon next to the filter name. To reset all parameter filters, click Reset filters at the bottom of the tab.
To hide the filter by territory, in the Geofilter settings dialog, click ![]() icon next to the geofilter name. To delete the geofilter, click
icon next to the geofilter name. To delete the geofilter, click ![]() icon next to its name. To delete all geofilters, click Clear filters.
icon next to its name. To delete all geofilters, click Clear filters.
Data visualization
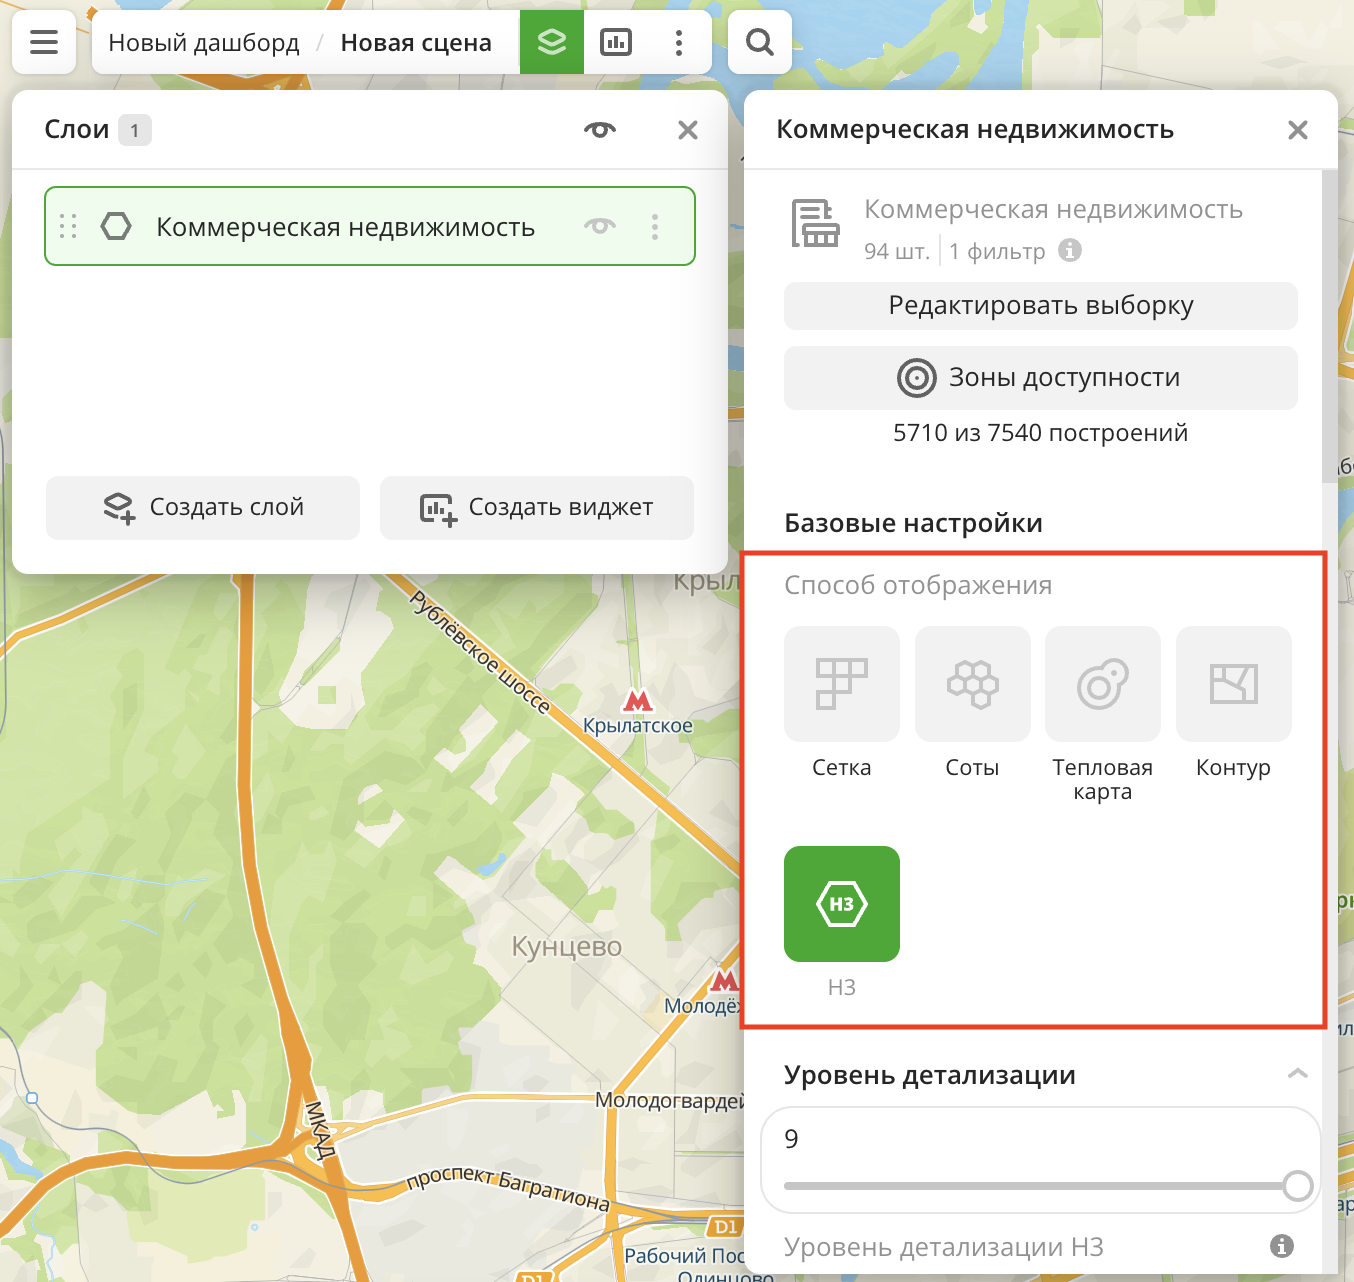
The following visualization methods are available for the dataset:
After creating the layer, configure a basic data visualization:
-
Select the H3 visualization method:
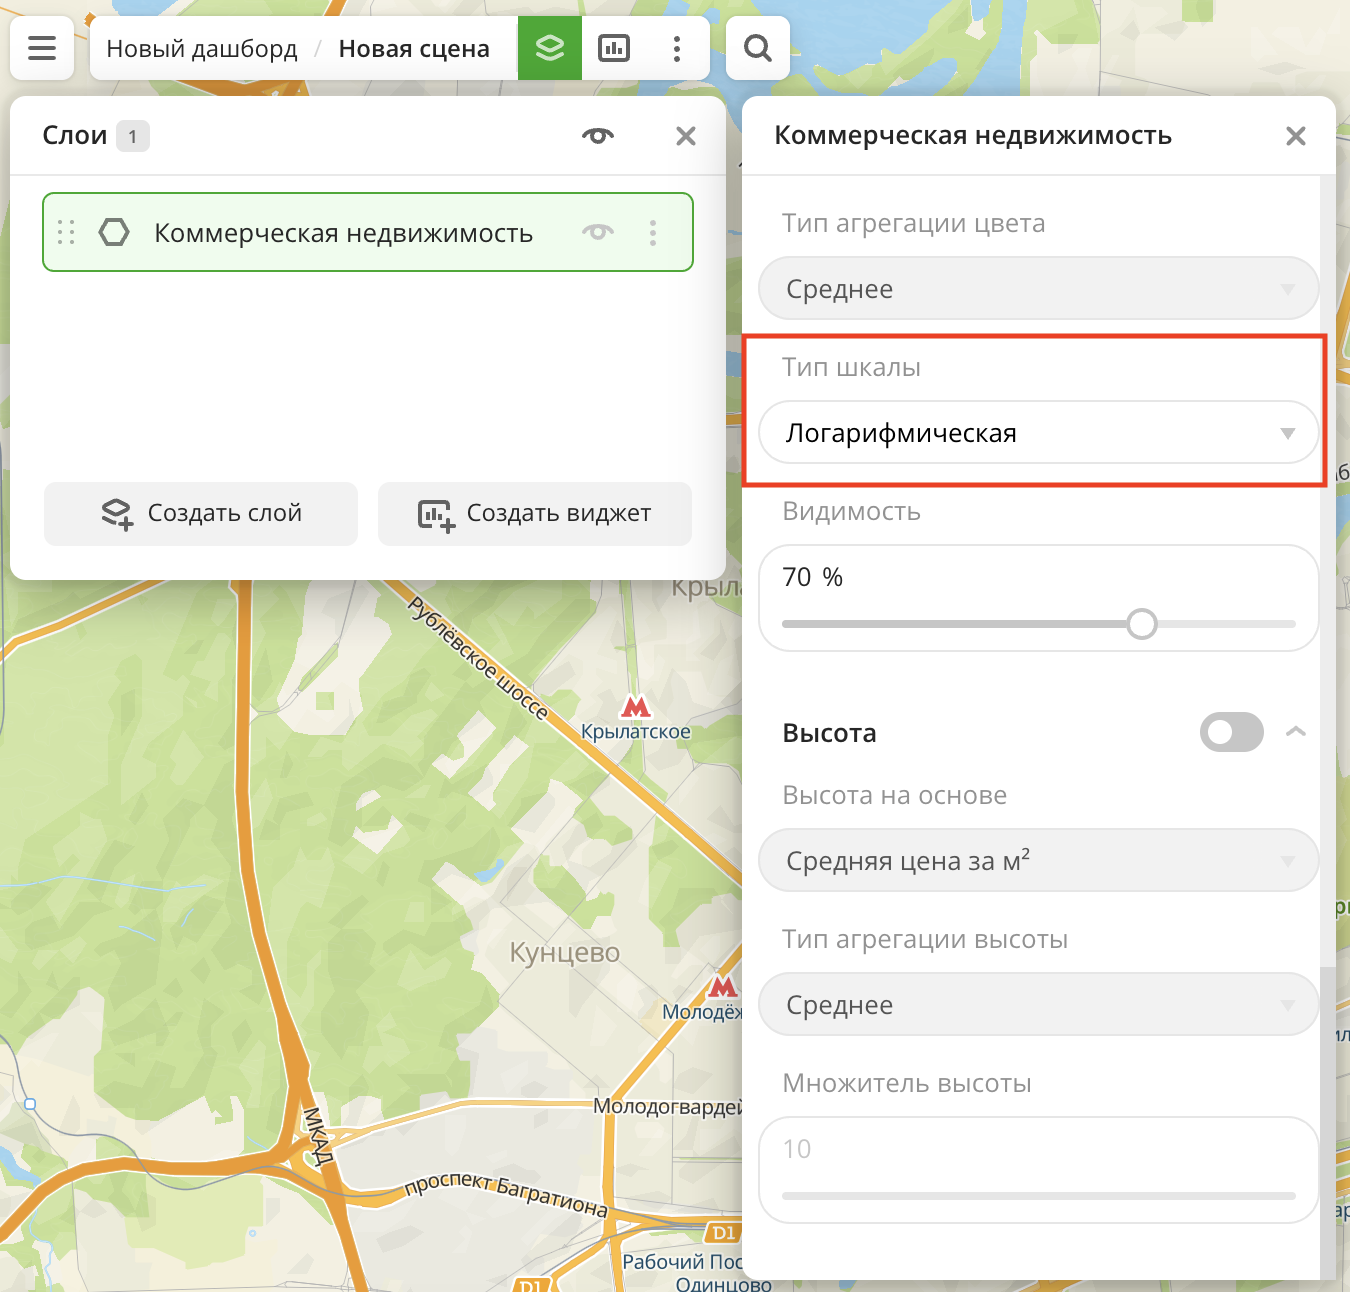
-
In the Type of scale field, select Logarithmic:
Data purchasing
The data from this dataset cannot be purchased separately. You can only work with this dataset in the 2GIS Pro service.
What's next?
- Getting started.
- Get to know more about other Data categories.
- Get to know how to work with Data visualization.
- Learn more about Layers, Dashboards, Scenes, and Widgets.
- Learn about ready-made Analytics scenarios.