Parkings
The Parkings dataset provides information on parking lots and their location.
Usage scenarios
The Parkings dataset helps to solve the problems:
- Selecting a location for opening a business. It helps to select locations for driver-focused businesses, such as auto services, drive-thru cafes, gas stations, and more, based on parking lot availability and types.
- Assessing parking lots availability for customers. It allows medical facilities, coworking spaces, banks, and other organizations to filter parking lots with
Publicaccess to evaluate how convenient it is to arrive by car. - Identifying areas with a lack of parking lots. It helps authorities and developers to detect districts with few parking lots and use the data for planning new facilities.
How is the data collected?
2GIS specialists regularly collect and verify data: for details, see the About 2GIS data page.
Data update and history
- Update frequency: data is updated once a week.
- History: historical data is not available. You can only view the latest updated data.
Available territories
Data is available for the following countries:
- Azerbaijan
- Armenia
- Belarus
- Georgia
- Kazakhstan
- Kyrgyzstan
- Russia
- Uzbekistan
The data may not be available throughout the entire country, but only in populated areas where 2GIS is present. To check data availability, use geofilters or contact technical support.
Data availability
-
Cloud-based (2GIS Pro service):
- Demo tariff plan: data is not available. To start working with the data, change the tariff plan and request access to the dataset.
- Other tariff plans: data is available upon request.
-
On-Premise (installation of the service in a private environment): data is available.
Getting started
- Go to the Main or Data tab.
- Select the Parkings dataset.
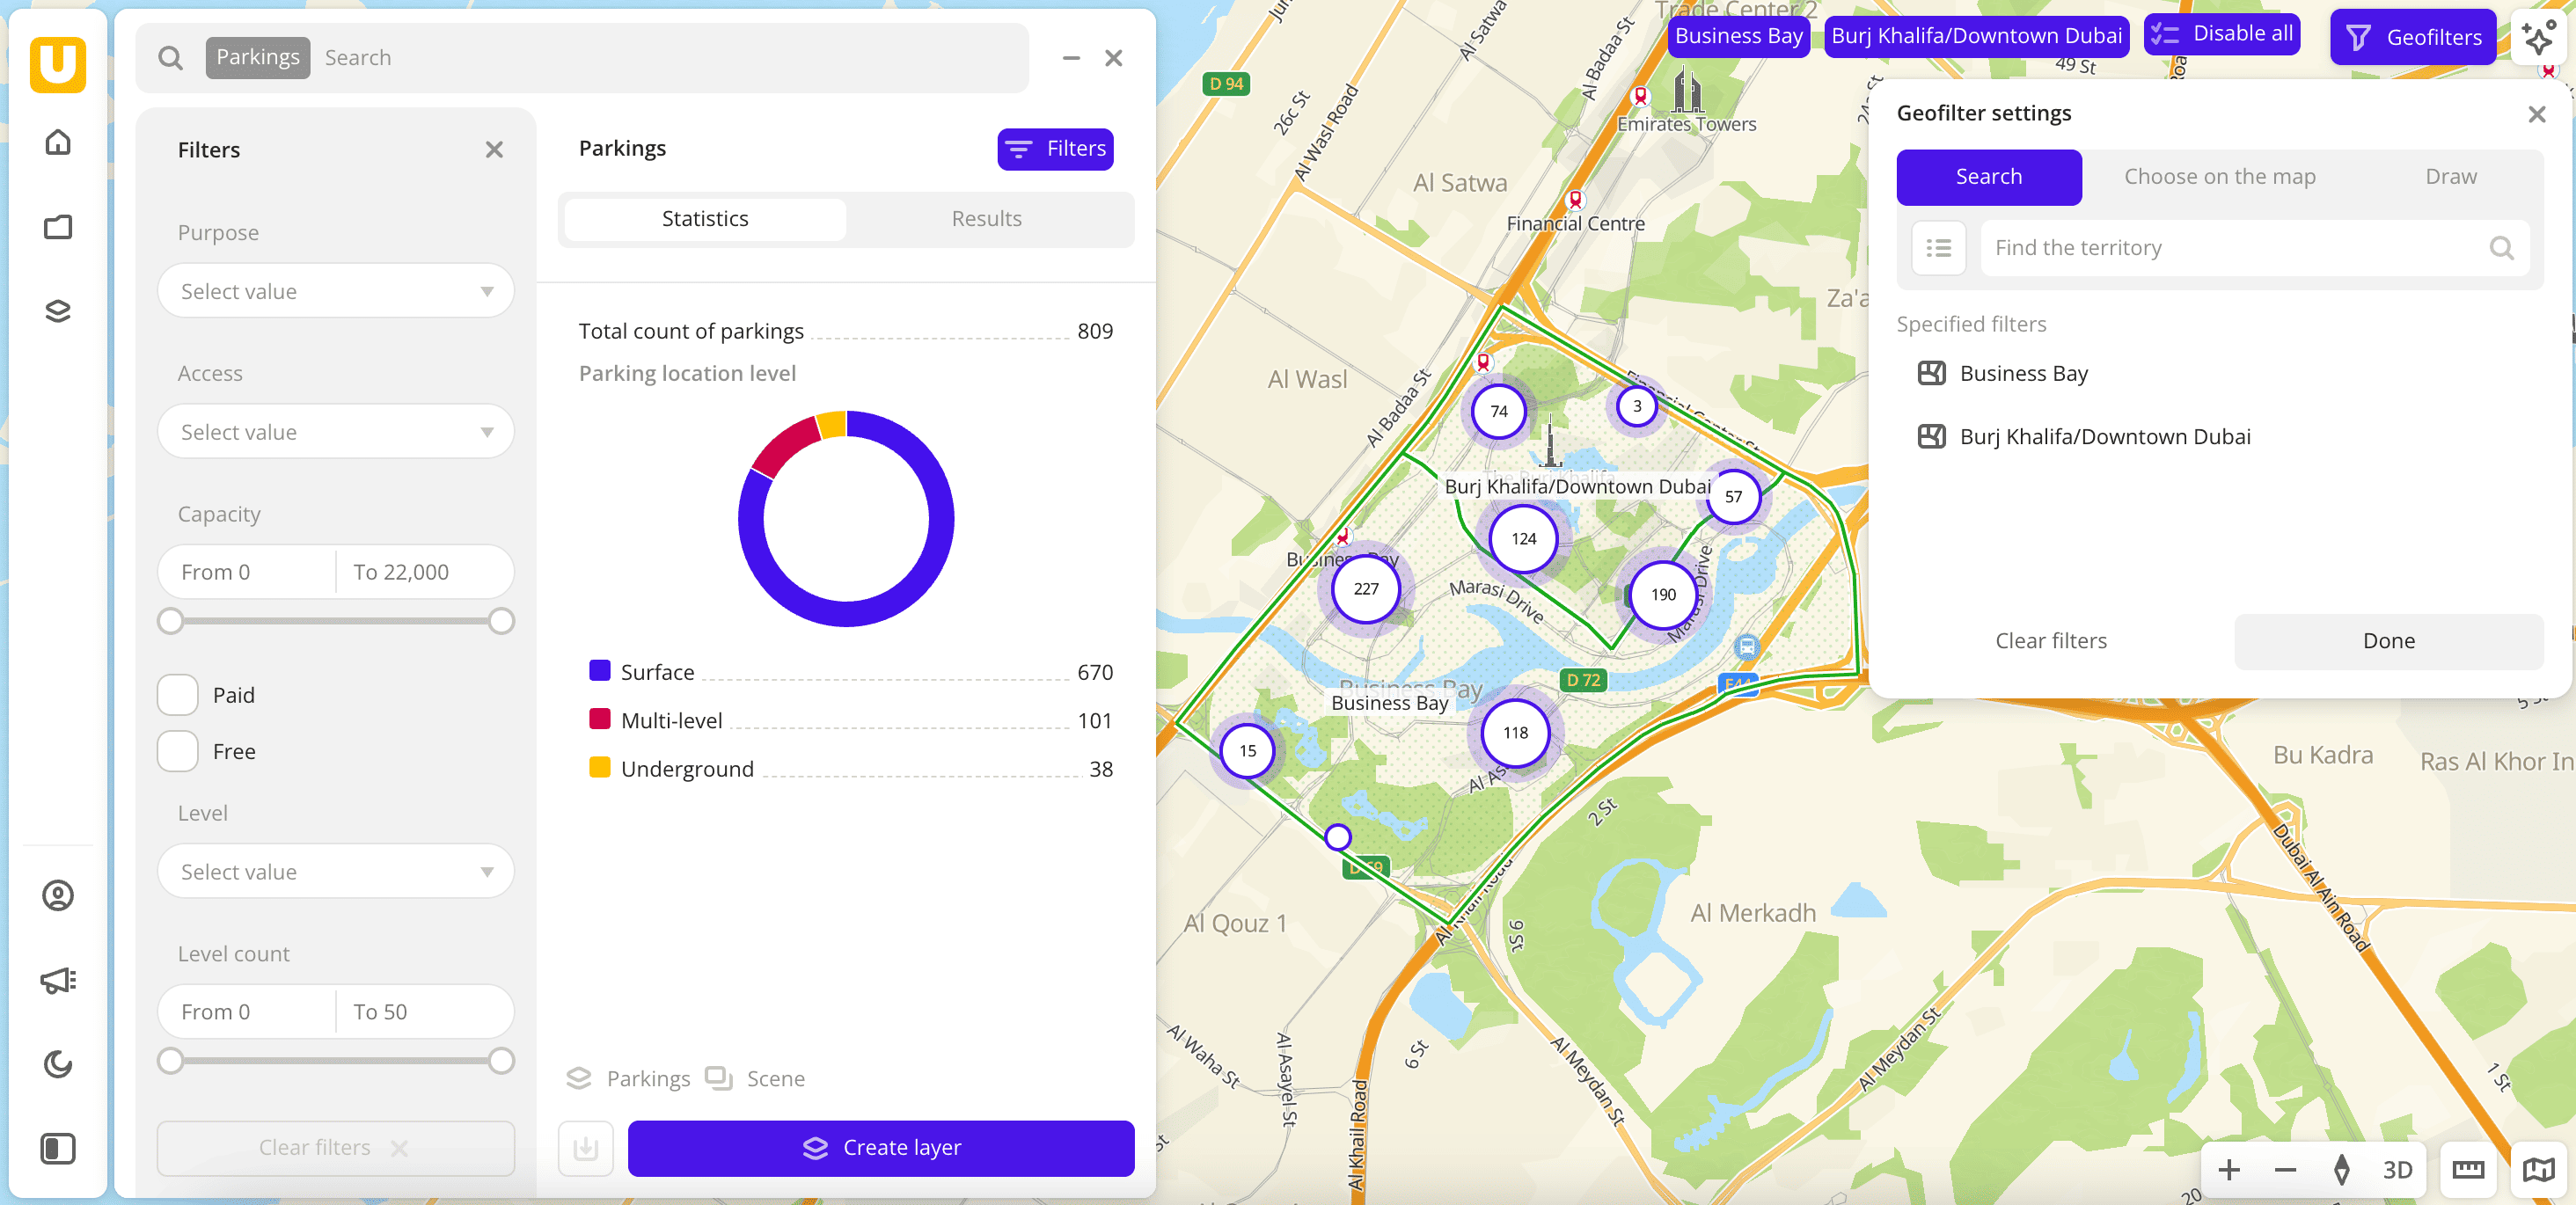
- In the Geofilter settings dialog, select up to 50 territories for which the data sample is created. You can use standard and custom territories and also build polygons, proximity zones, and circles on the map. For more information, see the Geofilters section. After you select the territories, click Done.
- On the Filters tab, set the remaining filters if necessary.
The data is displayed on the map as points. Filtering results are available on two tabs:
-
Statistics: general statistics about the sample:
- Total count of parking lots.
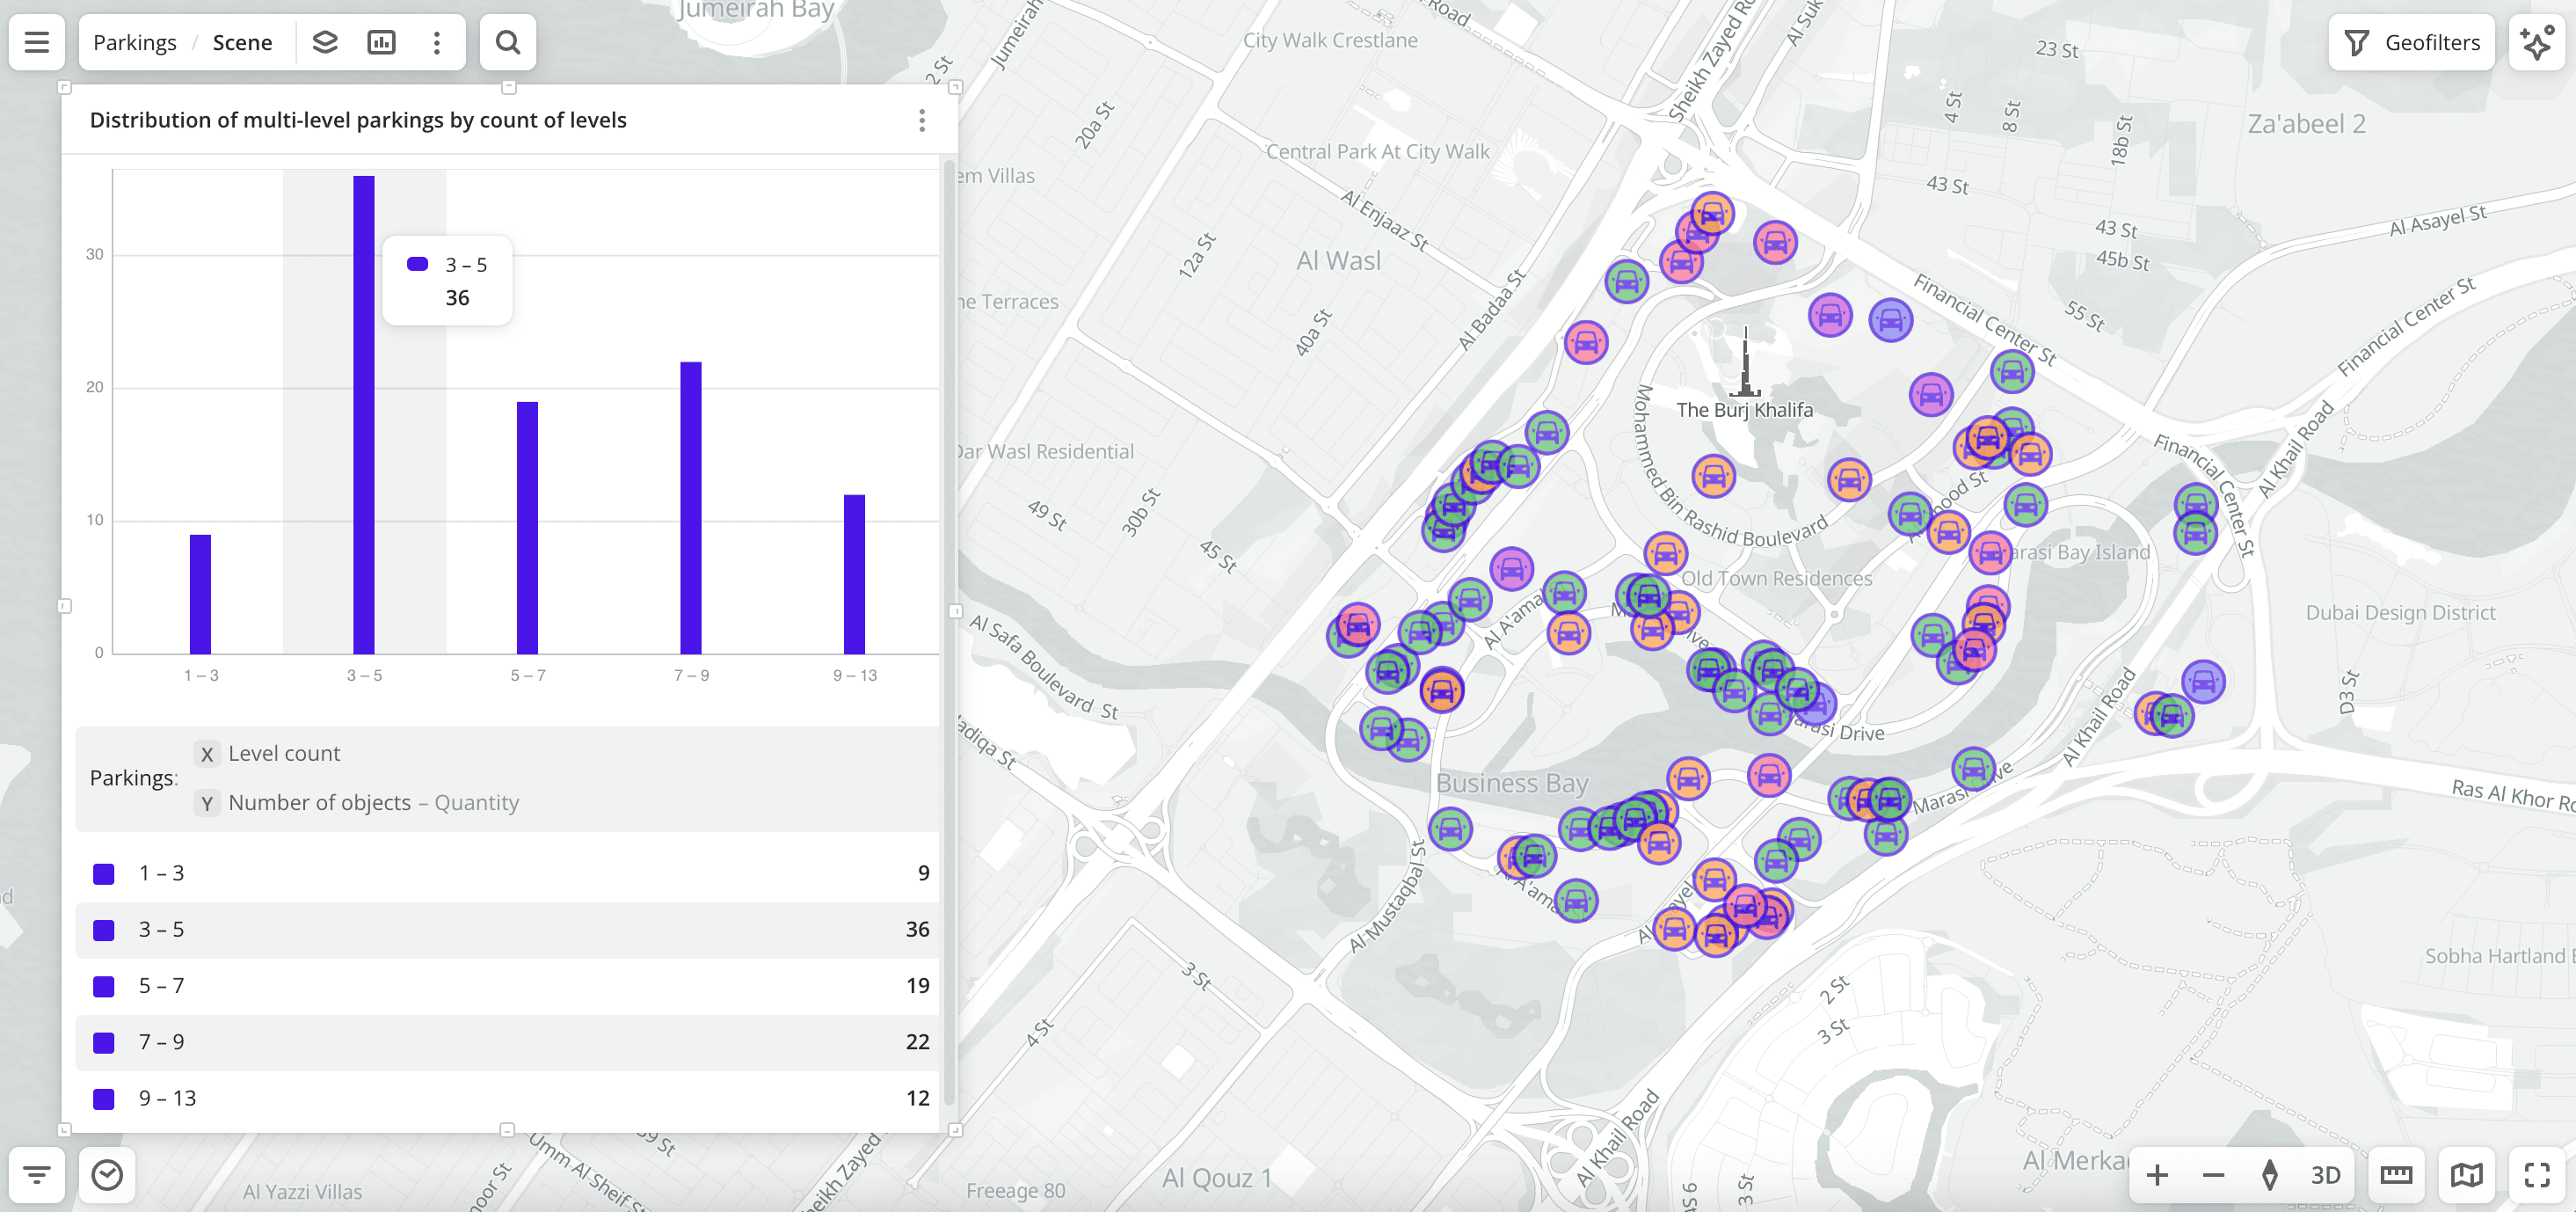
- Chart with the distribution of parking lots by the location level. Displayed if more than one type is selected.
-
Results: general information about parking lots and their list. When selecting a parking lot from the list:
- Information about the parking lot is displayed in the card.
- The location of the parking lot is indicated on the map.
You can manually edit the list of filtering results to keep only selected parking lots in the data sample. To do this, click Edit list, select the parking lots, and click Apply.
To save the data sample, click Create layer and customize data visualization.
Filters
For the Parkings dataset, the following filters are available:
- Purpose: transport type parking lots are intended for (e.g.,
For cars,For motorcycles/mopeds, etc.). - Access: availability of parking lots for different population groups (e.g.,
Public,For residents,For taxi, etc.). - Capacity: count of spaces on a parking lot.
- Paid: select to show only paid parking lots.
- Free: select to show only free parking lots.
- Level: parking lot level relative to the ground (e.g.,
Surface,Underground,Multi-level). - Level count: count of parking lot levels. For
Undergroundparking lots, the value is1.
To reset the parameter filter, click ![]() icon next to the filter name. To reset all parameter filters, click Reset filters at the bottom of the tab.
icon next to the filter name. To reset all parameter filters, click Reset filters at the bottom of the tab.
To hide the filter by territory, in the Geofilter settings dialog, click ![]() icon next to the geofilter name. To delete the geofilter, click
icon next to the geofilter name. To delete the geofilter, click ![]() icon next to its name. To delete all geofilters, click Clear filters.
icon next to its name. To delete all geofilters, click Clear filters.
Data visualization
The following visualization methods are available for the dataset:
After creating the layer, configure a basic data visualization:
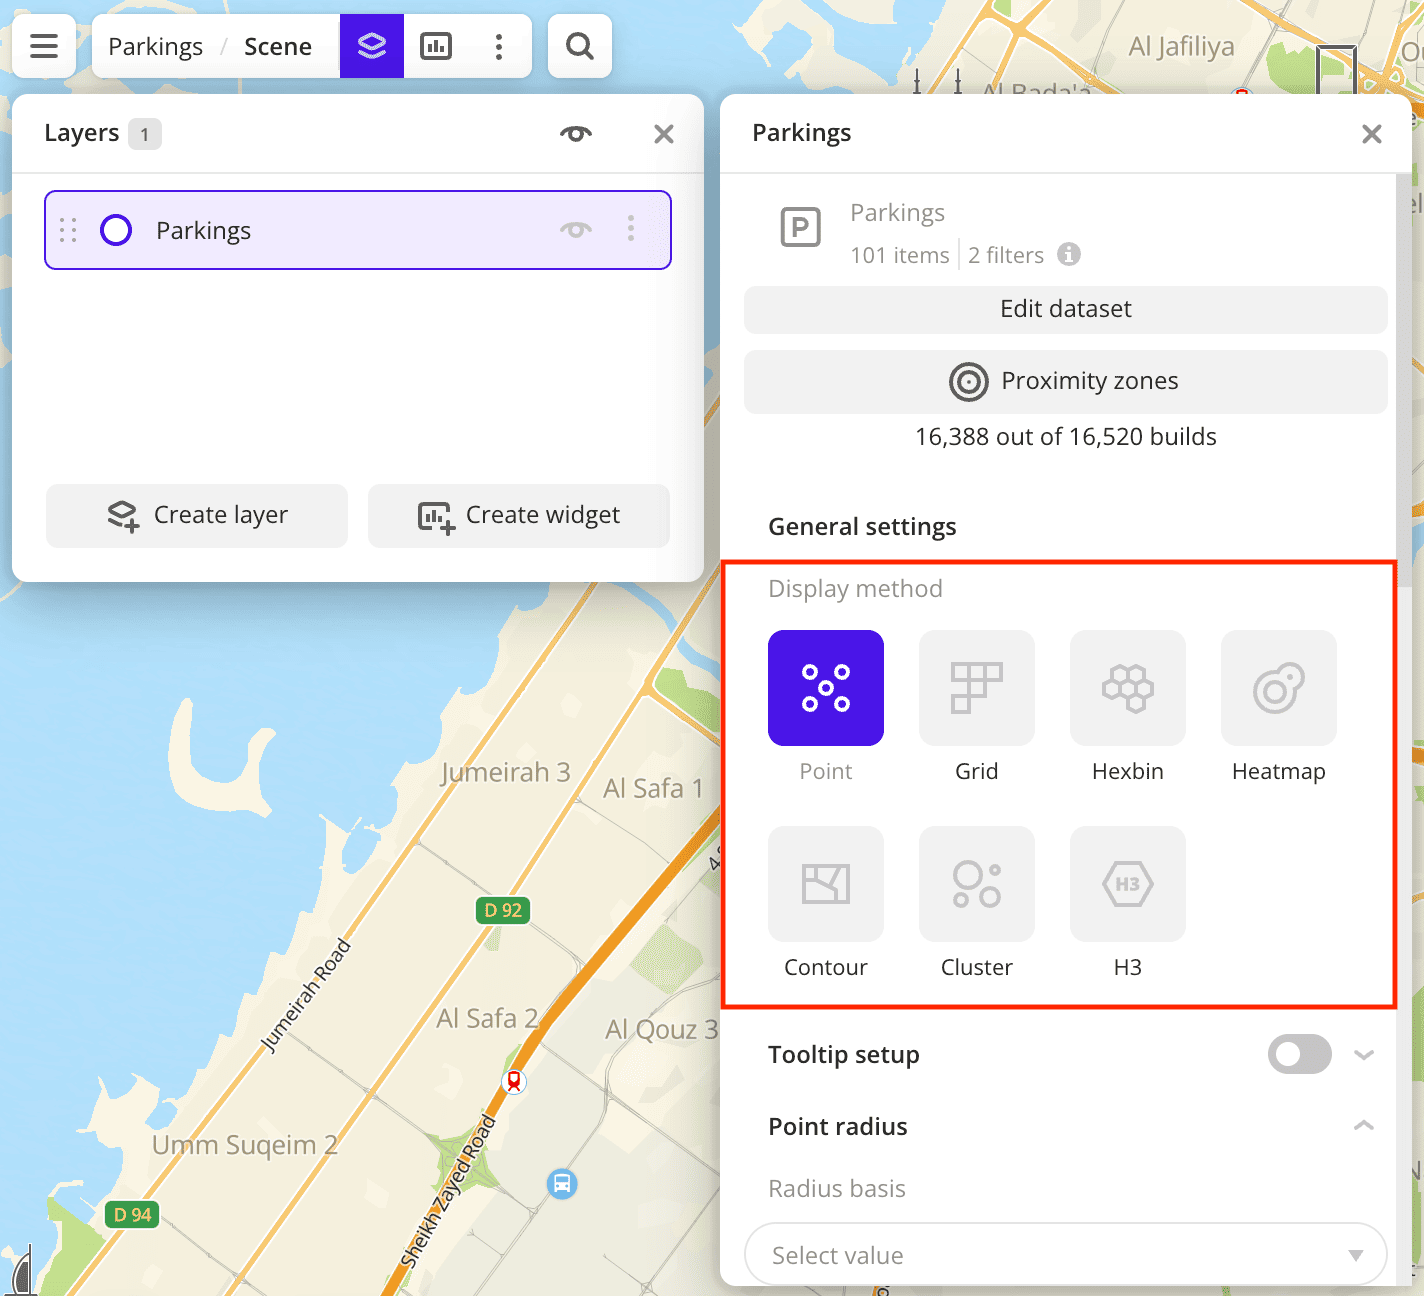
-
Select the Point visualization method:
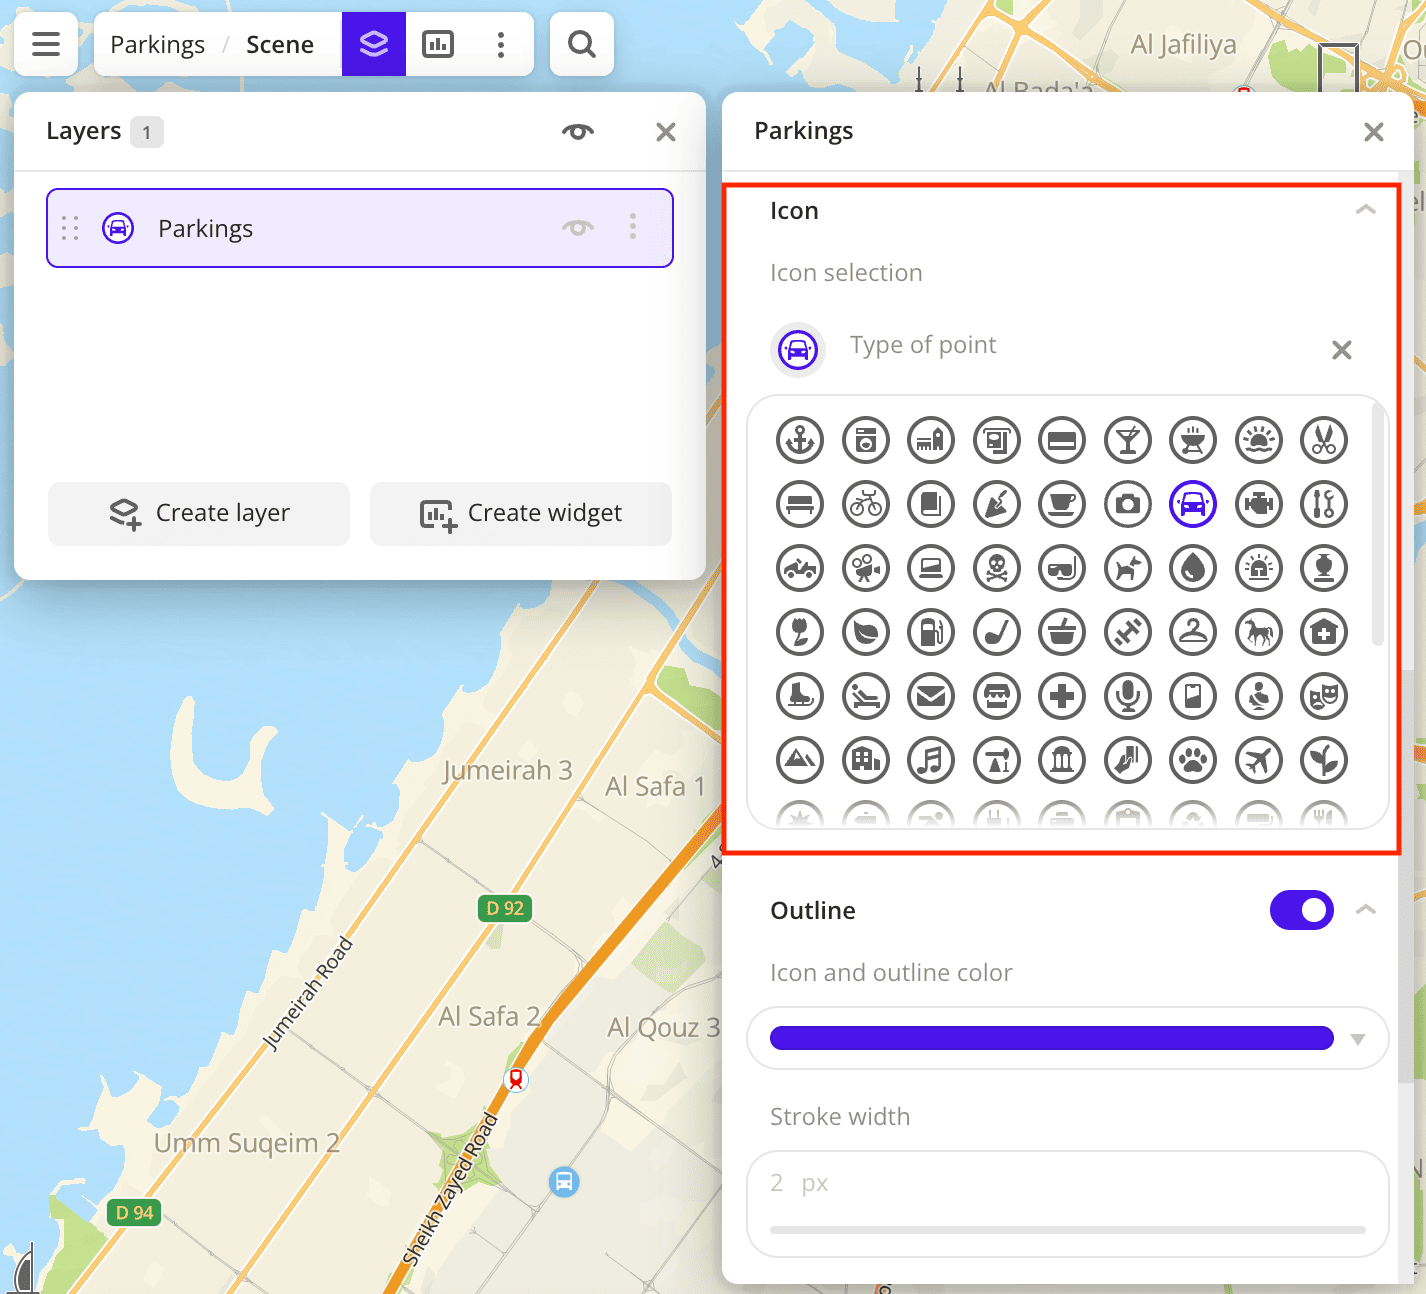
-
In the Icon field, select the icon to display points on the map:
-
To analyze parking lot locations, change the color of the points on the map depending on the parking lot capacity. In the Color basis field, select the
Capacityattribute and specify the color palette: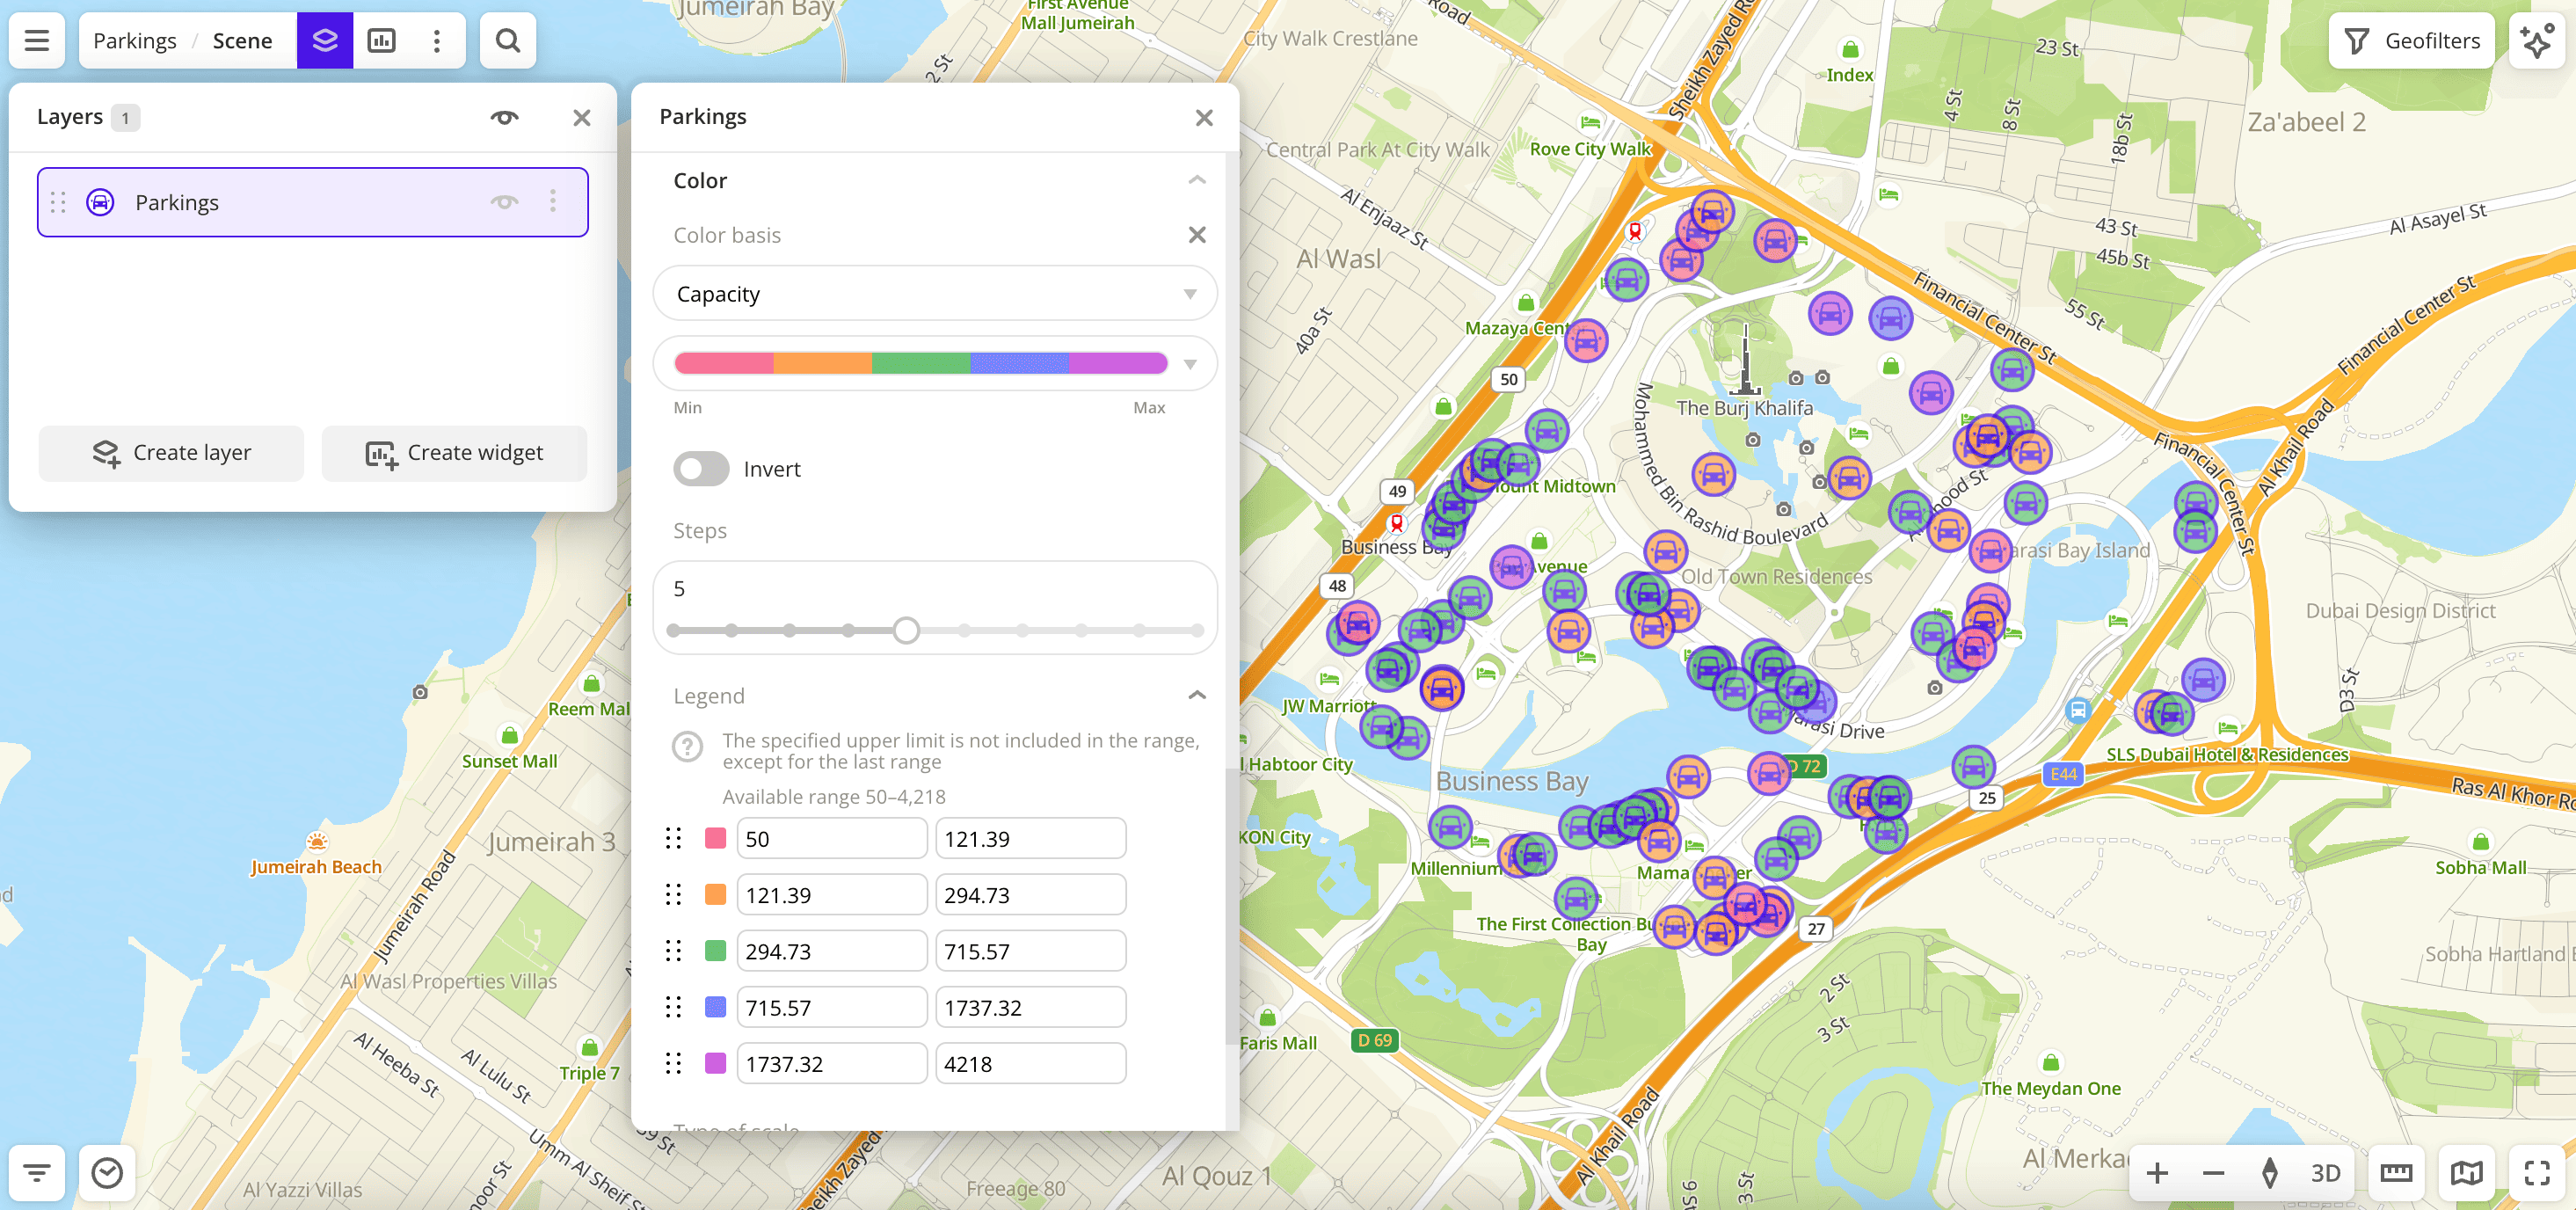
Data purchasing
You can purchase data separately as an export in the following formats:
- Table formats:
.csv.txt.json
- Formats for storing geographic data:
.shp(Shape).gpkg(GeoPackage).geojson(GeoJSON)
For more information about the price, available territories, and how to purchase data, fill out the form on urbi.ae.
What's next?
- Getting started.
- Get to know more about other Data categories.
- Get to know how to work with Data visualization.
- Learn more about Layers, Dashboards, Scenes, and Widgets.
- Learn about ready-made Analytics scenarios.