Age-sex composition of the population
The documentation provides a description with examples of the interface in Russian.
The Age-sex composition of the population dataset provides information about the distribution of the population living in residential buildings by sex and age.
Usage scenarios
The Age-sex composition of the population dataset helps to solve the problems:
- Opening a business for a target audience. It helps to estimate the size of the target group in a district and choose a location. For example, find out the number of working-age women to open a beauty salon or choose a location with a high density of elderly population for a pharmacy.
- Evaluating social infrastructure coverage. It allows you to analyze the number of kindergartens, schools, and clinics by age groups.
- Planning residential construction and social infrastructure. It helps to evaluate the population structure by sex and age in the development zone and plan the construction of courtyards and educational institutions.
How is the data collected?
The data collection algorithm consists of the following steps:
-
Obtaining and processing data from the Federal State Statistics Service (Rosstat) on the sex and age structure of the population by municipalities and regions.
-
Matching the Rosstat municipalities with 2GIS data.
-
Calculating the distribution of the population by sex and age for each municipality.
-
Calculating the distribution of the population for each residential building, taking into account the following constraints:
- The sex ratio and total population must match the Rosstat data for municipalities.
- Each building must have at least one resident over 18 years old.
- The age difference between a resident adult and a resident child must be at least 16 years.
- If there is no data for a municipality, the regional distribution must be applied.
Data update and history
- Update frequency: data is updated once a month.
- History: historical data is not available.
Available territories
Data is available only for Russia.
The data may not be available throughout the entire country, but only in populated areas where 2GIS is present. To check data availability, use geofilters or contact technical support.
Data availability
-
Cloud-based (2GIS Pro service):
- Demo tariff plan: data is not available. To start working with the data, change the tariff plan and request access to the dataset.
- Other tariff plans: data is available upon request.
-
On-Premise (installation of the service in a private environment): data is not available.
Getting started
- Go to the Main or Data tab.
- Select the Age-sex composition of the population dataset.
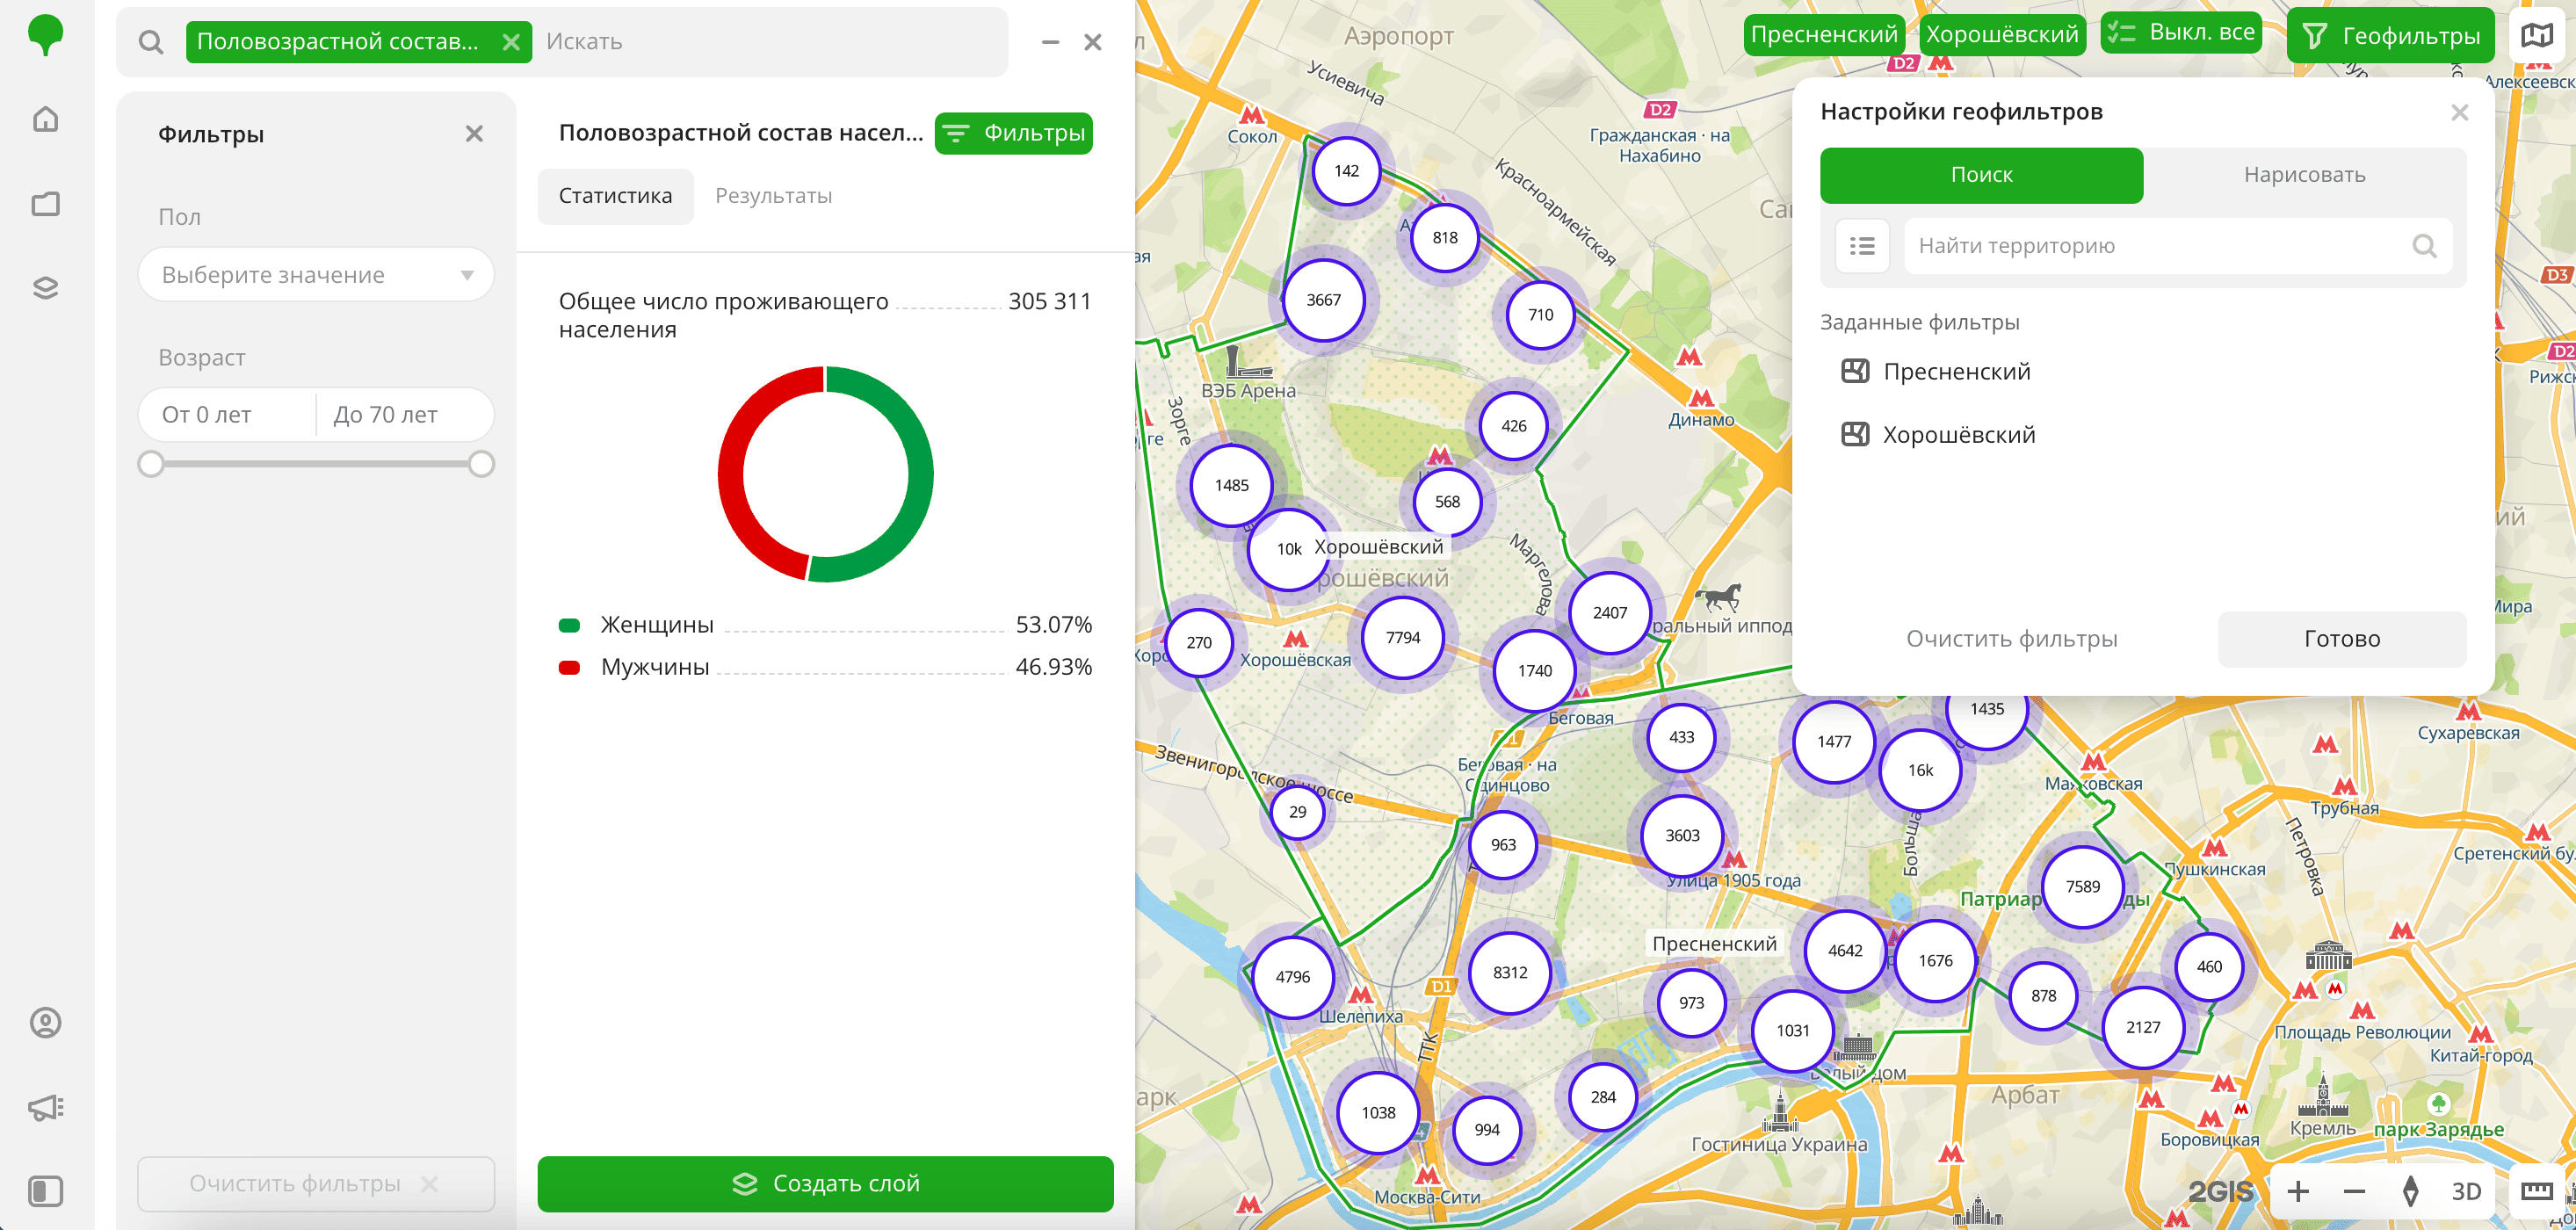
- In the Geofilter settings dialog, select up to 50 territories for which the data sample is created. You can use standard and custom territories and also build polygons, proximity zones, and circles on the map. For more information, see the Geofilters section. After you select the territories, click Done.
- On the Filters tab, set the remaining filters if necessary.
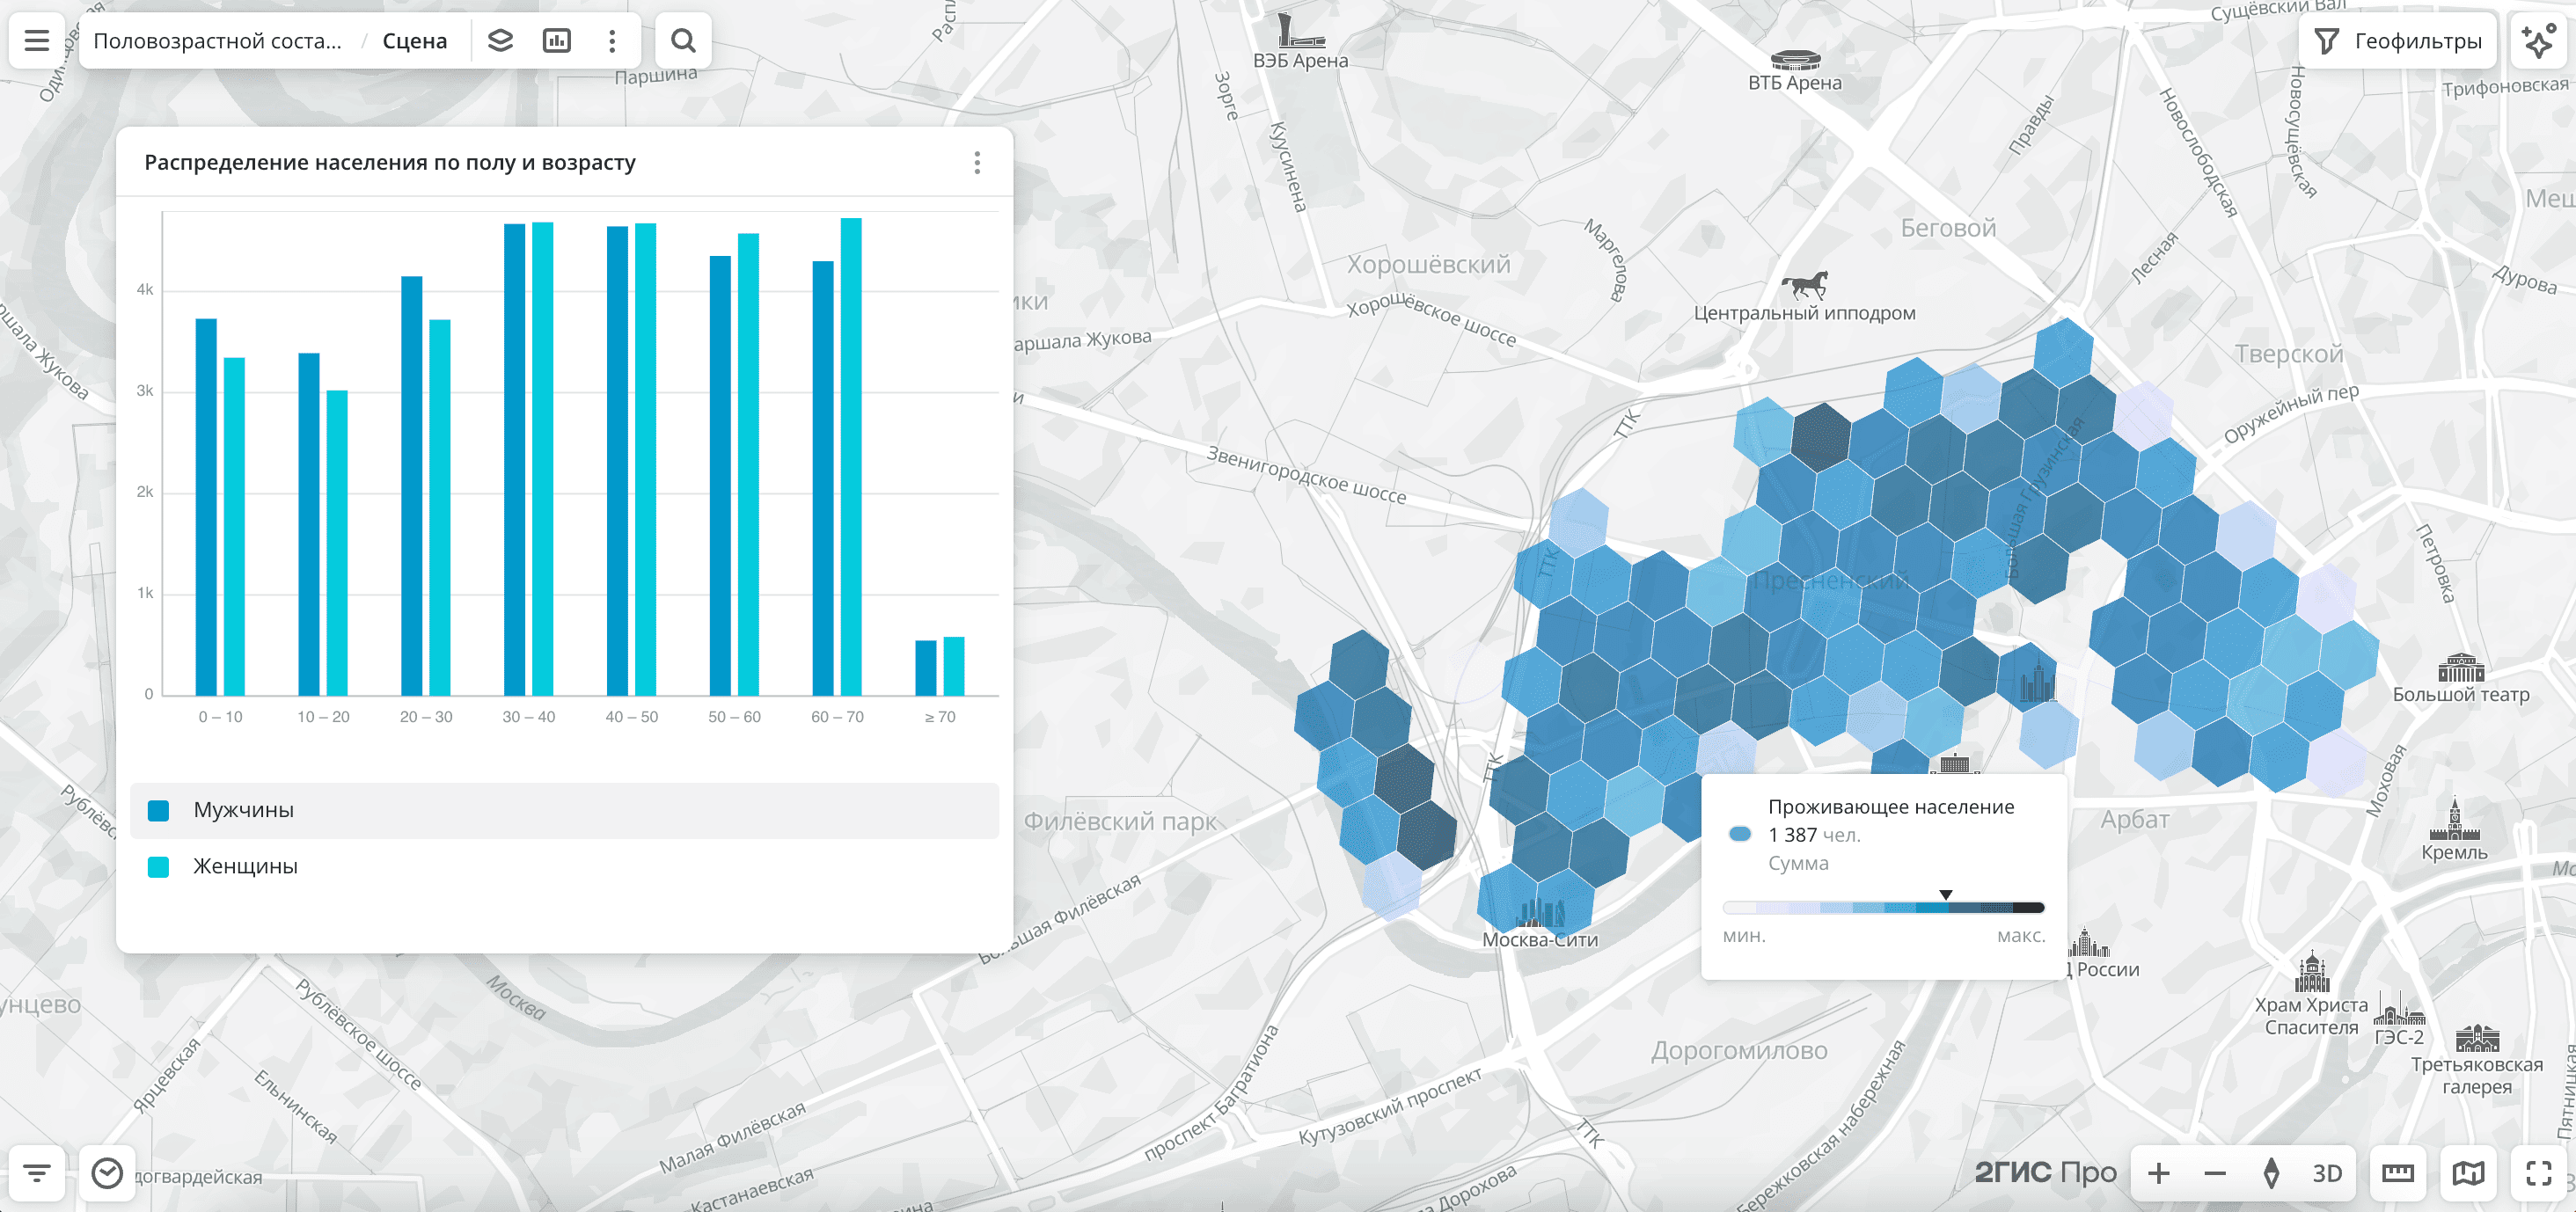
The data is displayed on the map as centroid points: the centers of the object geometries. Available filtering results:
- Total living population.
- Chart with the distribution of the population by sex. Displayed if both sexes are selected.
- Population pyramid with the distribution of the population by sex and age. The chart shows the population size by age as horizontal bars. The left side shows data for males, and the right side shows data for females. Displayed if both sexes are selected.
To save the data sample, click Create layer and customize data visualization.
Filters
For the Age-sex composition of the population dataset, the following filters are available:
- Sex:
MaleandFemale. - Age: population age from 0 to 70 years. The
70 yearsvalue includes data on all residents aged 70 and older. - Resident population: number of registered residents in buildings.
To reset the parameter filter, click ![]() icon next to the filter name. To reset all parameter filters, click Reset filters at the bottom of the tab.
icon next to the filter name. To reset all parameter filters, click Reset filters at the bottom of the tab.
To hide the filter by territory, in the Geofilter settings dialog, click ![]() icon next to the geofilter name. To delete the geofilter, click
icon next to the geofilter name. To delete the geofilter, click ![]() icon next to its name. To delete all geofilters, click Clear filters.
icon next to its name. To delete all geofilters, click Clear filters.
Data visualization
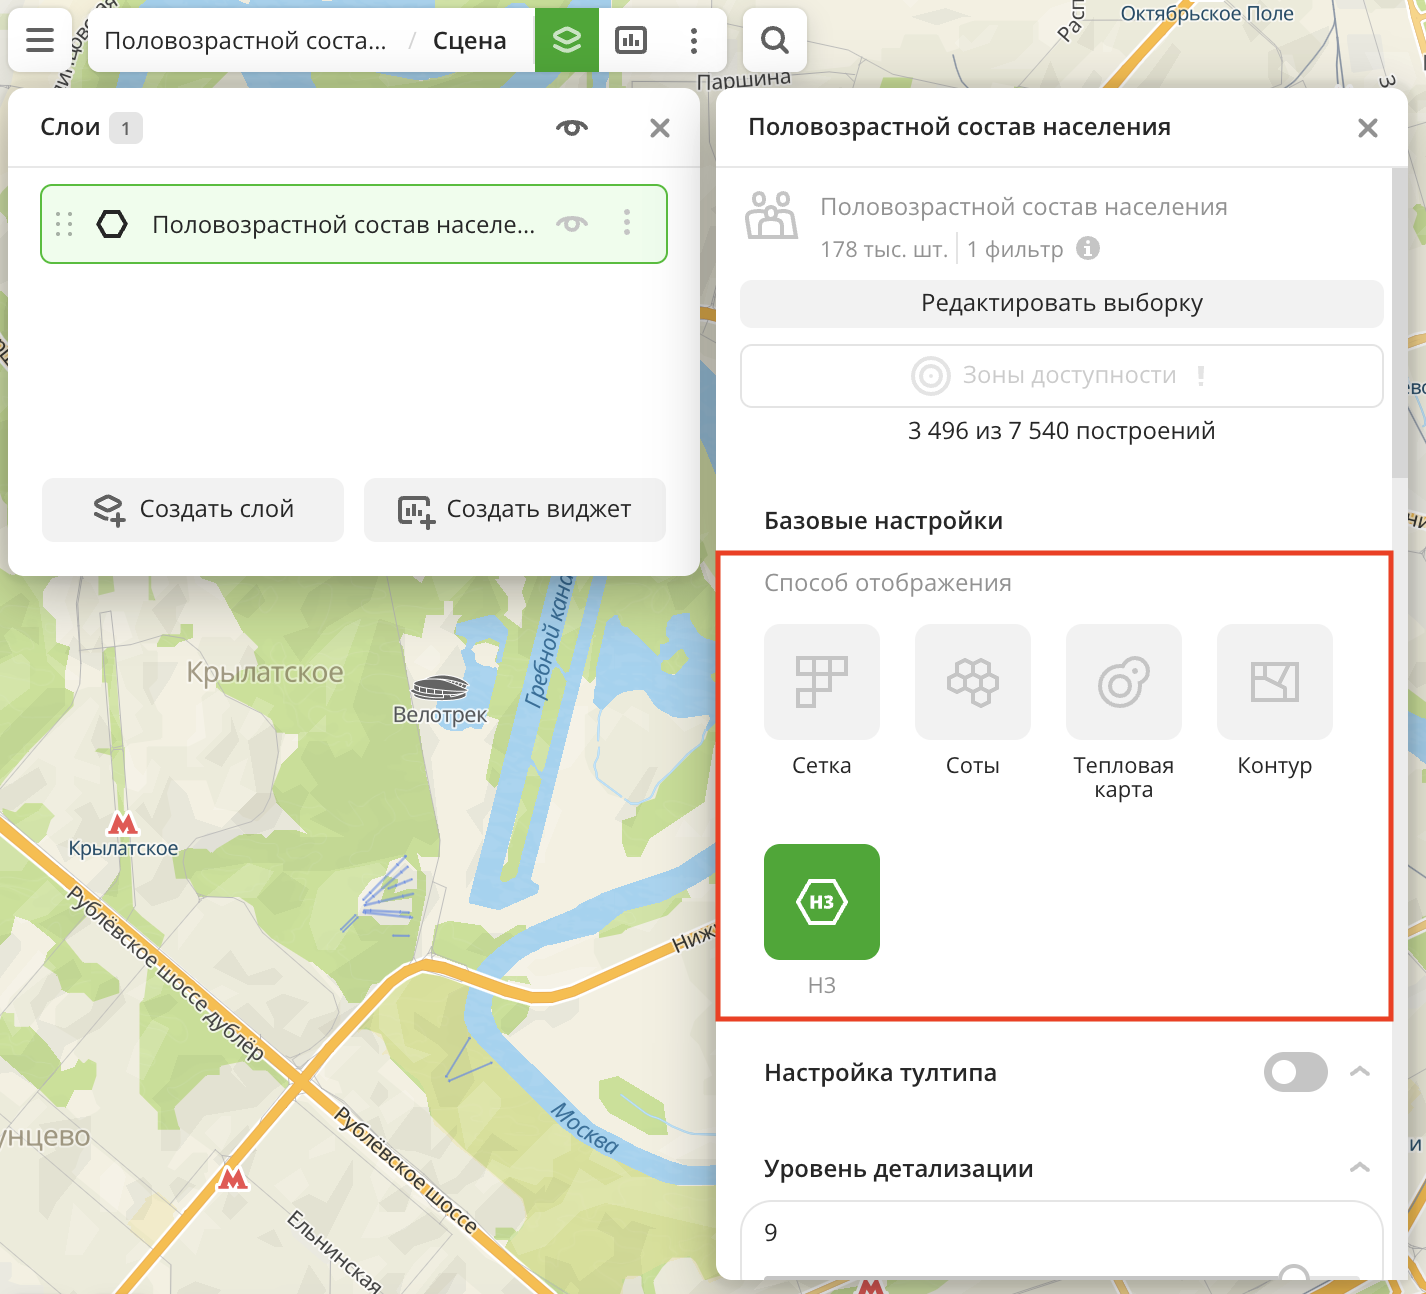
The following visualization methods are available for the dataset:
After creating the layer, configure a basic data visualization:
-
Select the H3 visualization method:
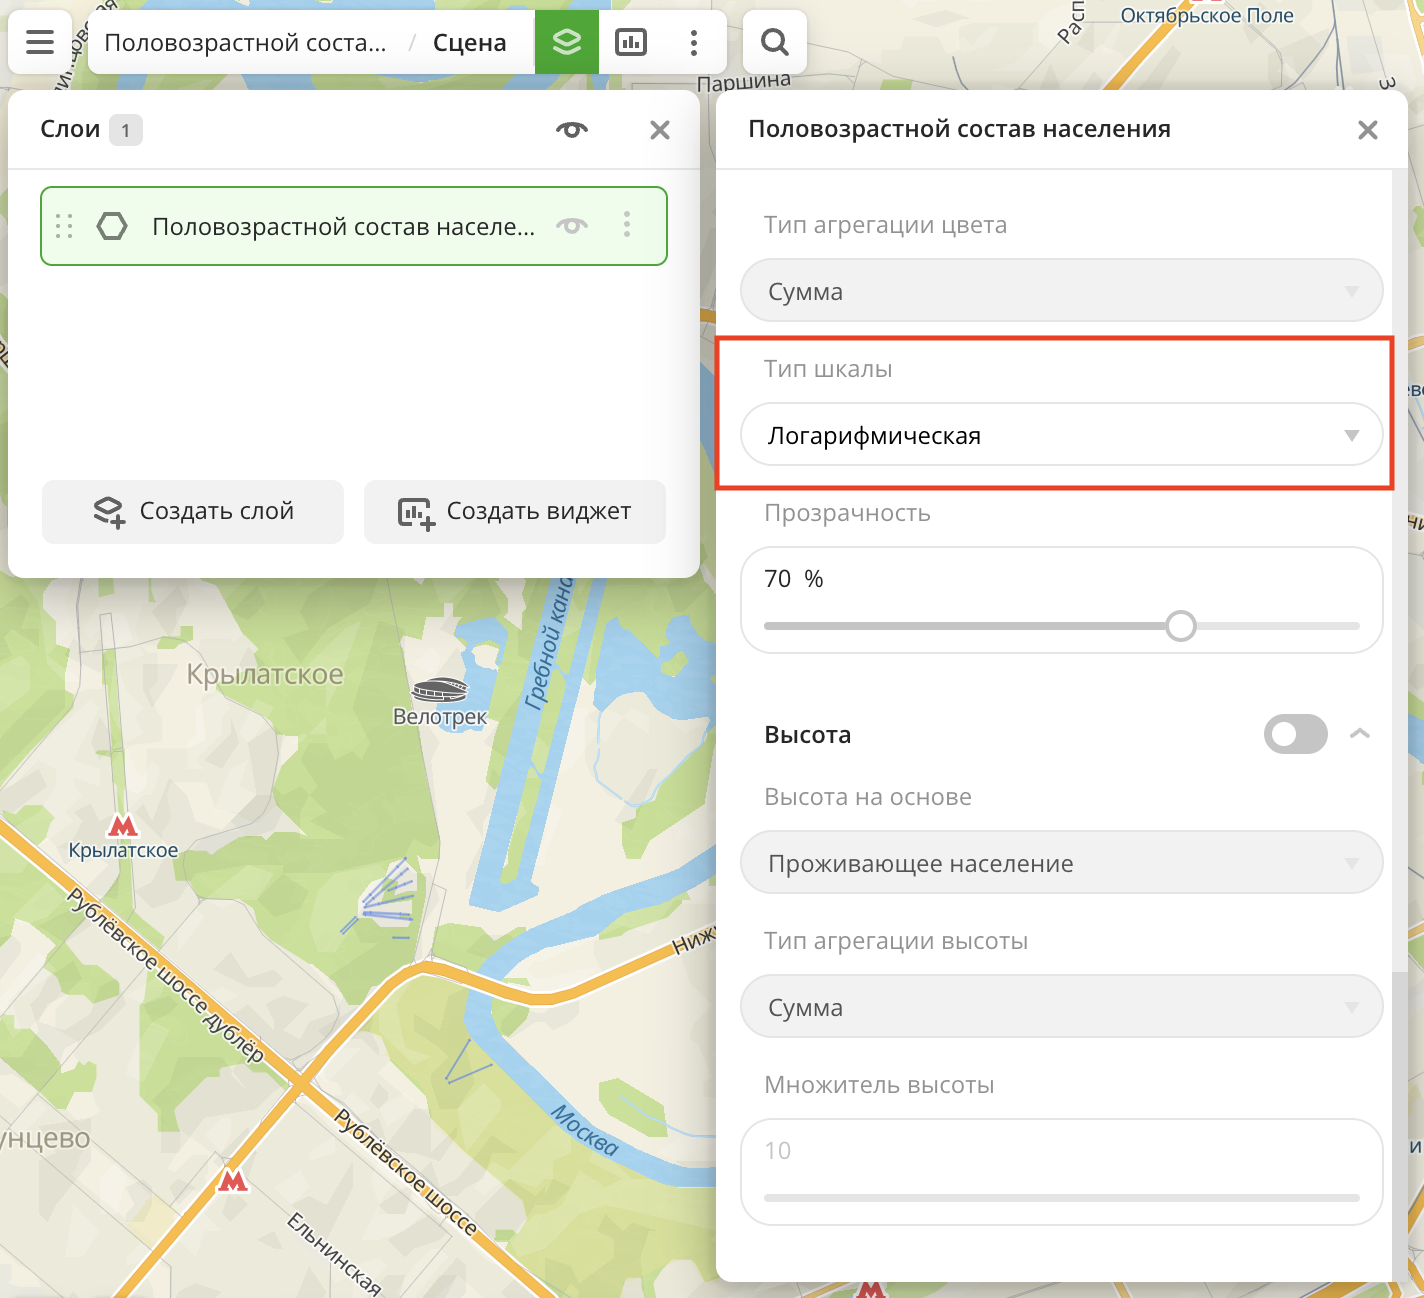
-
In the Type of scale field, select Logarithmic:
Data purchasing
You can purchase data separately as an export in the following formats:
- Table formats:
.csv.txt.json
- Formats for storing geographic data:
.shp(Shape).gpkg(GeoPackage).geojson(GeoJSON)
For more information about the price, available territories, and how to purchase data, fill out the form on urbi.ae.
What's next?
- Getting started.
- Get to know more about other Data categories.
- Get to know how to work with Data visualization.
- Learn more about Layers, Dashboards, Scenes, and Widgets.
- Learn about ready-made Analytics scenarios.