Tourist potential
The Tourist potential dataset provides information about the number of tourists: unique 2GIS users from other regions.
Usage scenarios
The Tourist potential dataset helps to solve the problems:
- Development of tourist infrastructure and routes. It helps city authorities assess the popularity and load of tourist areas. The data allows them to identify potential tourist locations, develop new routes, relieve popular spots, and attract people to other districts.
- Analysis of tourist flows. Shows from which regions most tourists arrive. The information can be used to set up targeted advertising and promotions for the target regions.
- Selecting locations to open a business. It helps select an optimal place to open a hotel, restaurant, or souvenir shop. Using the data, you can identify areas with high pedestrian traffic from tourists.
How is the data collected?
The data is anonymized. The algorithm determines the 2GIS user's primary city of stay and classifies the user as a tourist in another city if they actively use the application there.
The algorithm consists of the following steps:
-
Analyzing user activity: in which cities the user has opened the 2GIS application over the last three months.
-
Determining the user's primary city:
- Counting the total number of days spent in each city. It is assumed that between application launches the user remains in the city of the previous launch.
- Applying weighting coefficients. The closer the activity is to the current date, the higher its weight. This helps to determine the user's primary city even if they have recently moved.
- Selecting the city with the highest weighted number of days as the primary city.
-
Classifying the user as a tourist if they actively use the 2GIS application in a city that is not their primary one.
-
Aggregating data. Information about the number of unique tourists from different regions is aggregated and presented as summary statistics.
Data update and history
- Update frequency: data is updated once a month.
- History: historical data for the last 12 months is available.
Available territories
Data is available for the following countries:
- Azerbaijan
- Armenia
- Belarus
- Georgia
- Kazakhstan
- Kyrgyzstan
- Russia
- Uzbekistan
The data may not be available throughout the entire country, but only in populated areas where 2GIS is present. To check data availability, use geofilters or contact technical support.
Data availability
-
Cloud-based (2GIS Pro service):
- Demo tariff plan: data is not available. To start working with the data, change the tariff plan and request access to the dataset.
- Other tariff plans: data is available upon request.
-
On-Premise (installation of the service in a private environment): data is not available.
Getting started
- Go to the Main or Data tab.
- Select the Tourist potential dataset.
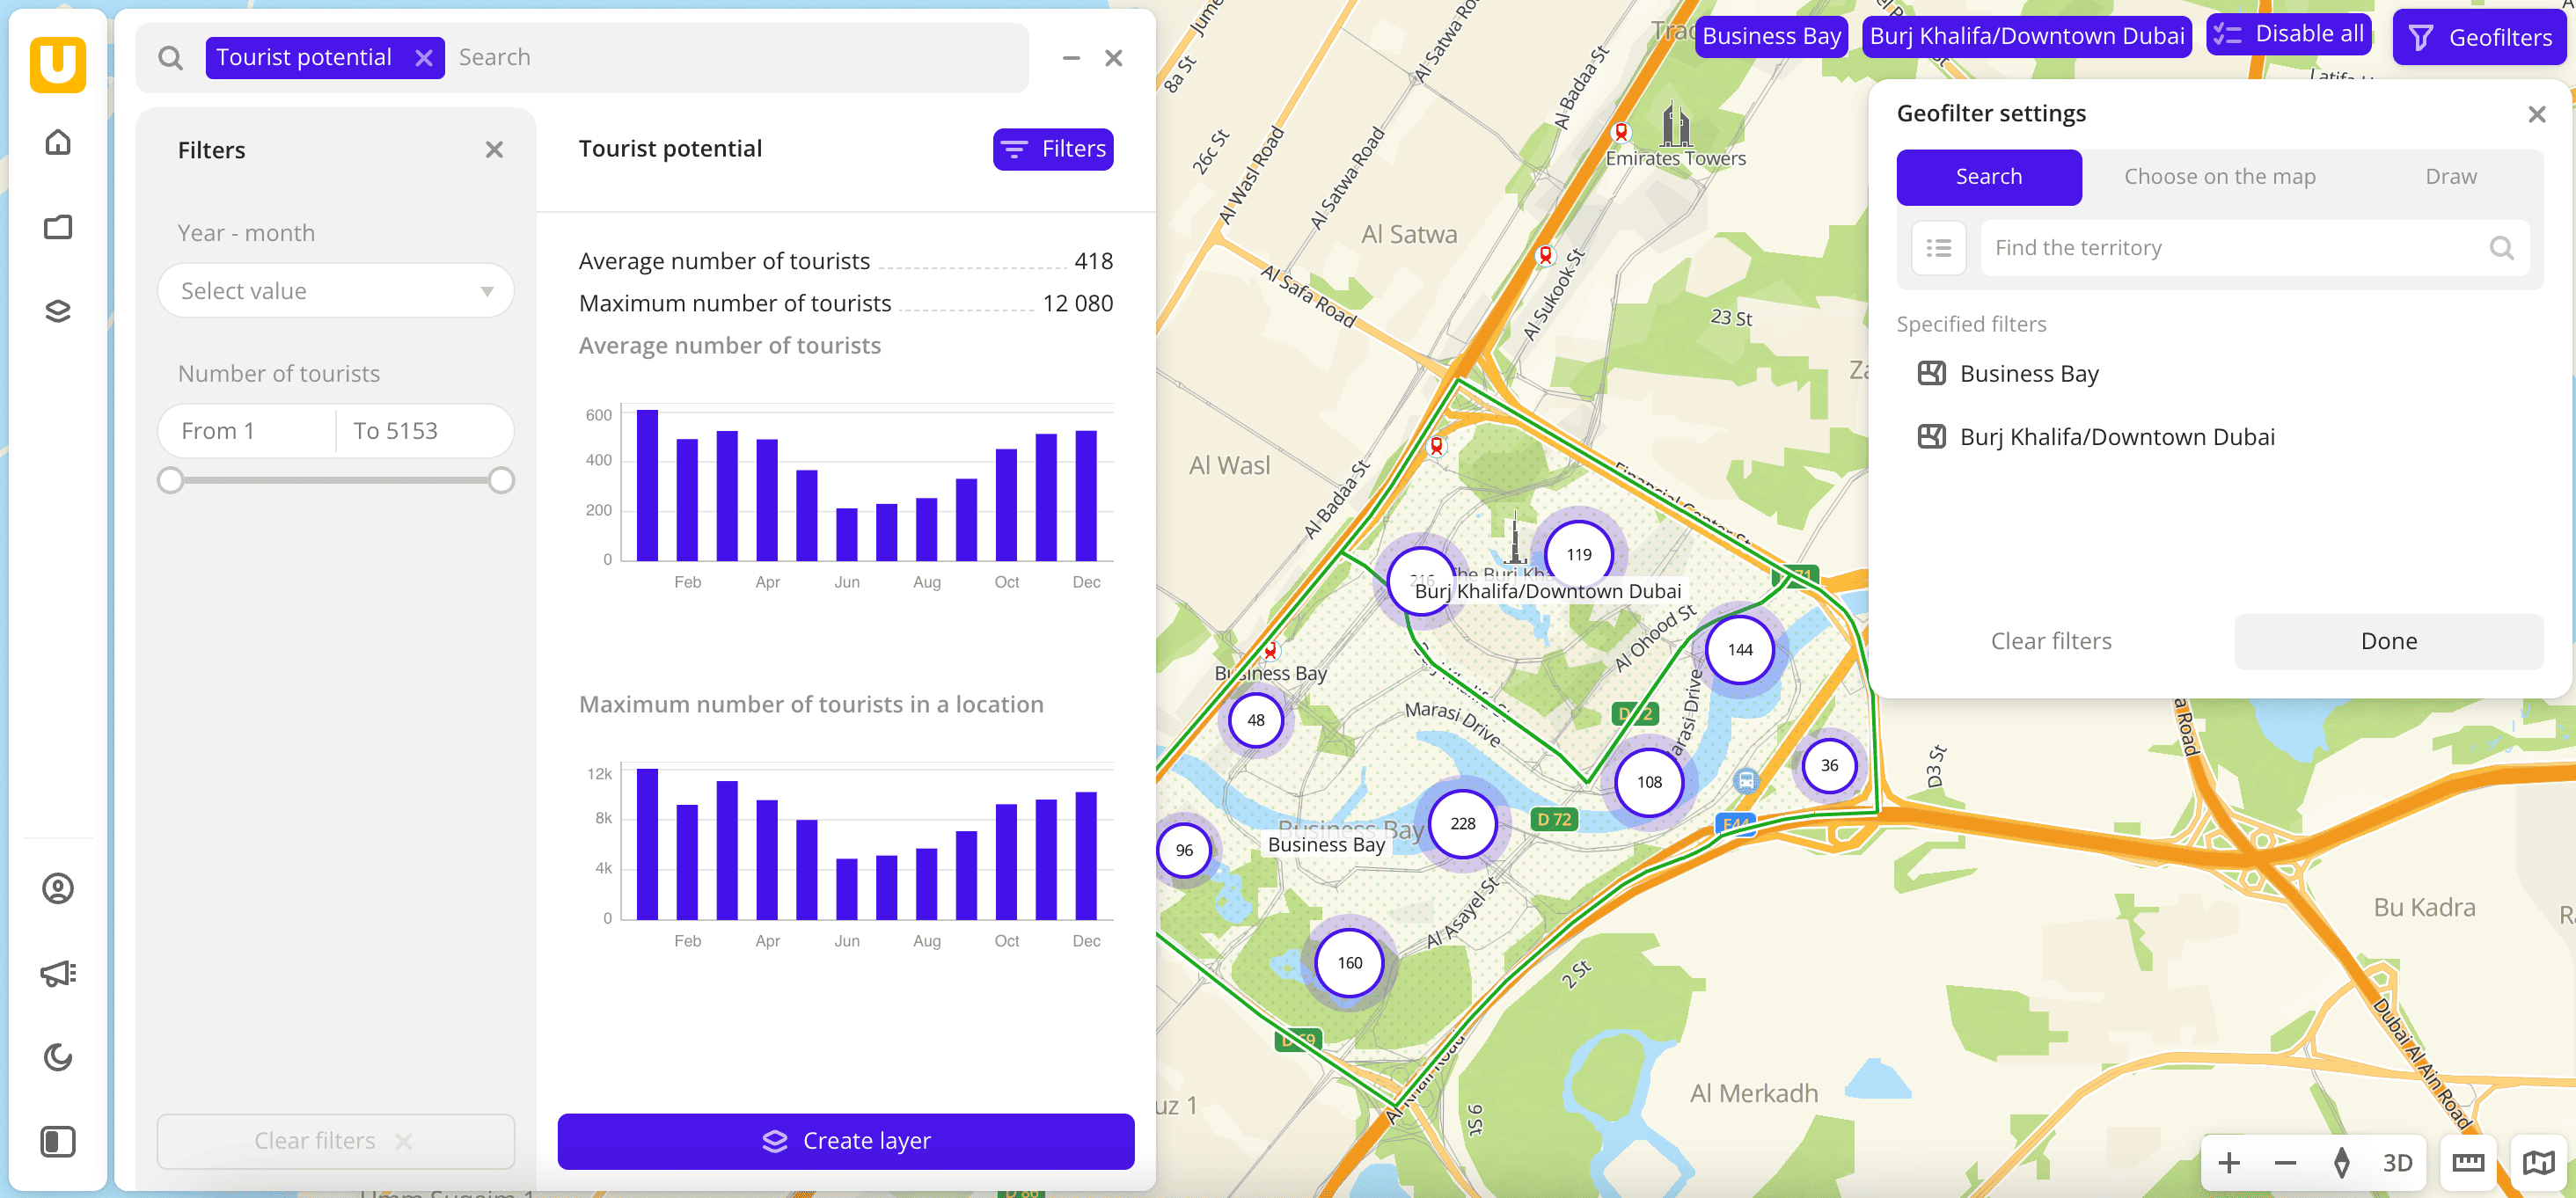
- In the Geofilter settings dialog, select up to 50 territories for which the data sample is created. You can use standard and custom territories and also build polygons, proximity zones, and circles on the map. For more information, see the Geofilters section. After you select the territories, click Done.
- On the Filters tab, set the remaining filters if necessary.
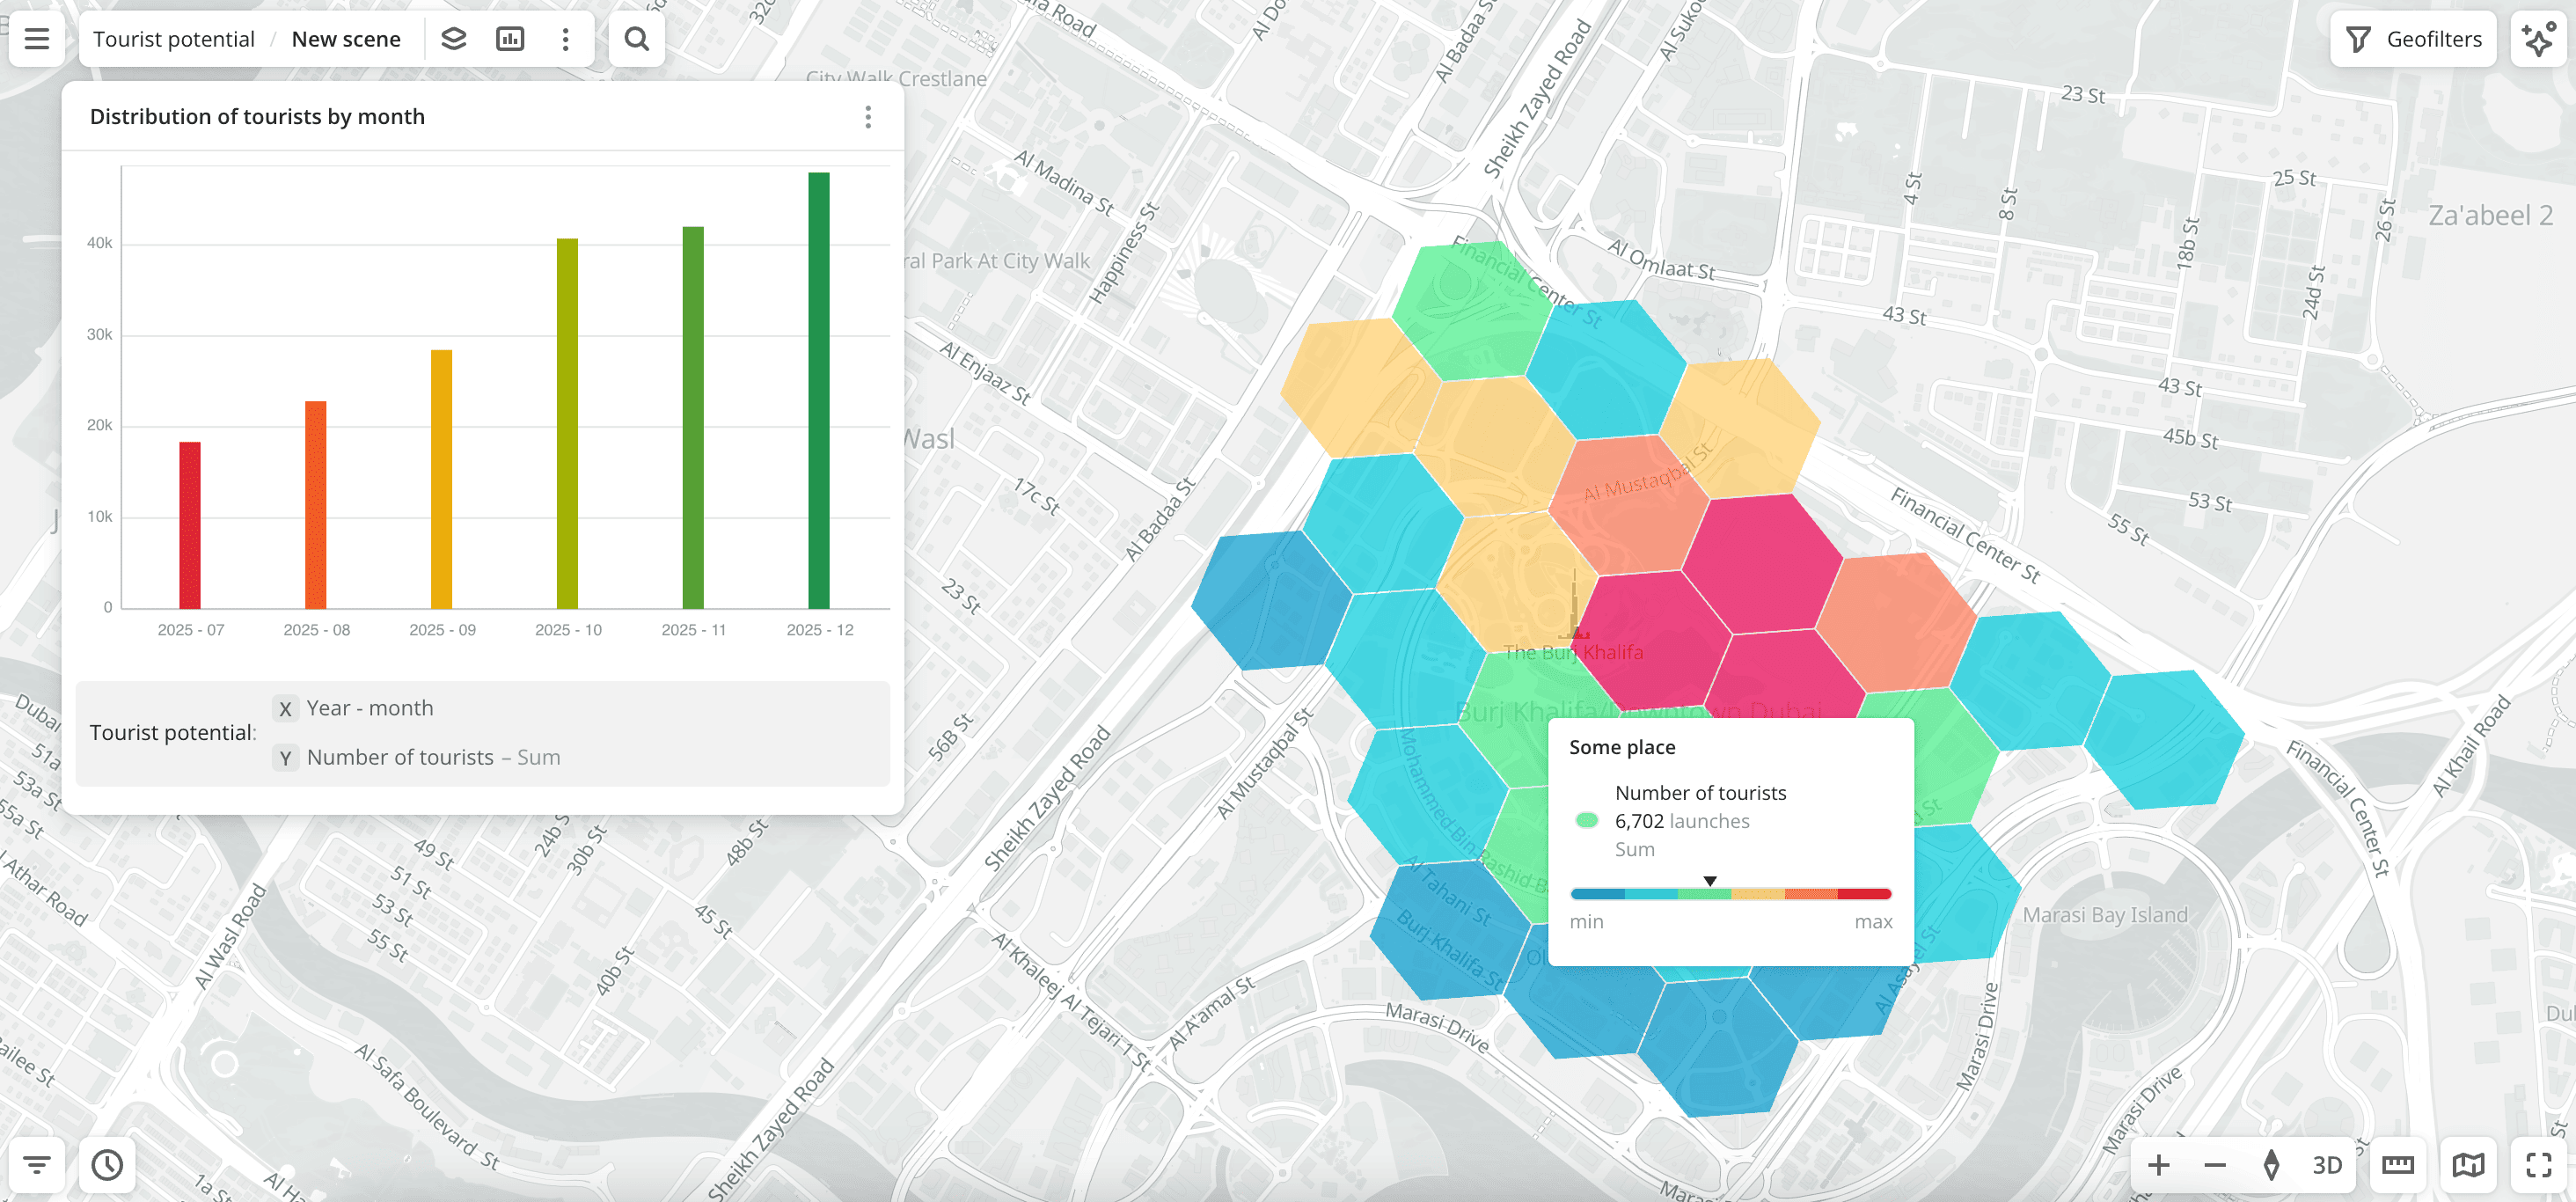
The data is displayed on the map as centroid points: the centers of the object geometries. Available filtering results:
- Average count of tourists in the selected territory.
- Maximum count of tourists in the selected territory.
- Chart with the distribution of average count of tourists in the selected territory by month. Displayed if data for more than one month is selected.
- Chart with the distribution of maximum count of tourists in the selected territory by month. Displayed if data for more than one month is selected.
To save the data sample, click Create layer and customize data visualization.
Filters
For the Tourist potential dataset, the following filters are available:
- Year-month: year and month to display data. You can select multiple options.
- Number of tourists: count of tourists in the selected territory for the selected time period.
To reset the parameter filter, click ![]() icon next to the filter name. To reset all parameter filters, click Reset filters at the bottom of the tab.
icon next to the filter name. To reset all parameter filters, click Reset filters at the bottom of the tab.
To hide the filter by territory, in the Geofilter settings dialog, click ![]() icon next to the geofilter name. To delete the geofilter, click
icon next to the geofilter name. To delete the geofilter, click ![]() icon next to its name. To delete all geofilters, click Clear filters.
icon next to its name. To delete all geofilters, click Clear filters.
Data visualization
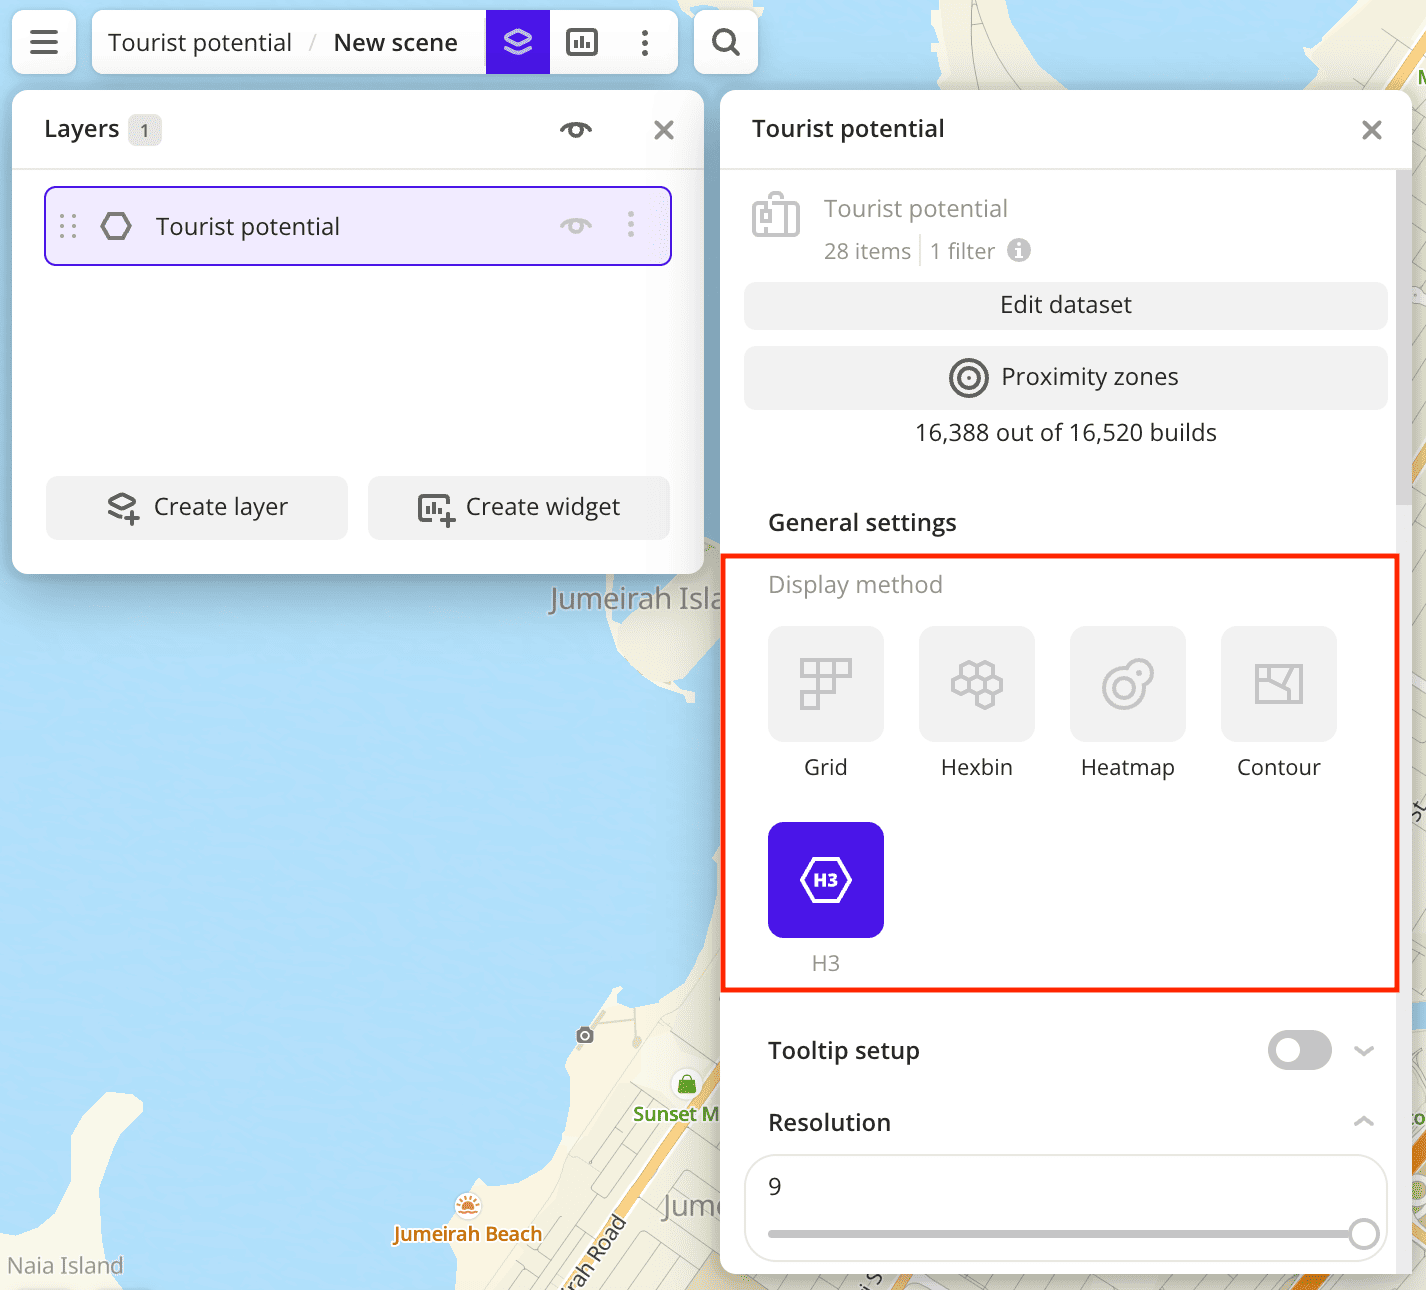
The following visualization methods are available for the dataset:
After creating the layer, configure a basic data visualization:
-
Select the H3 visualization method:
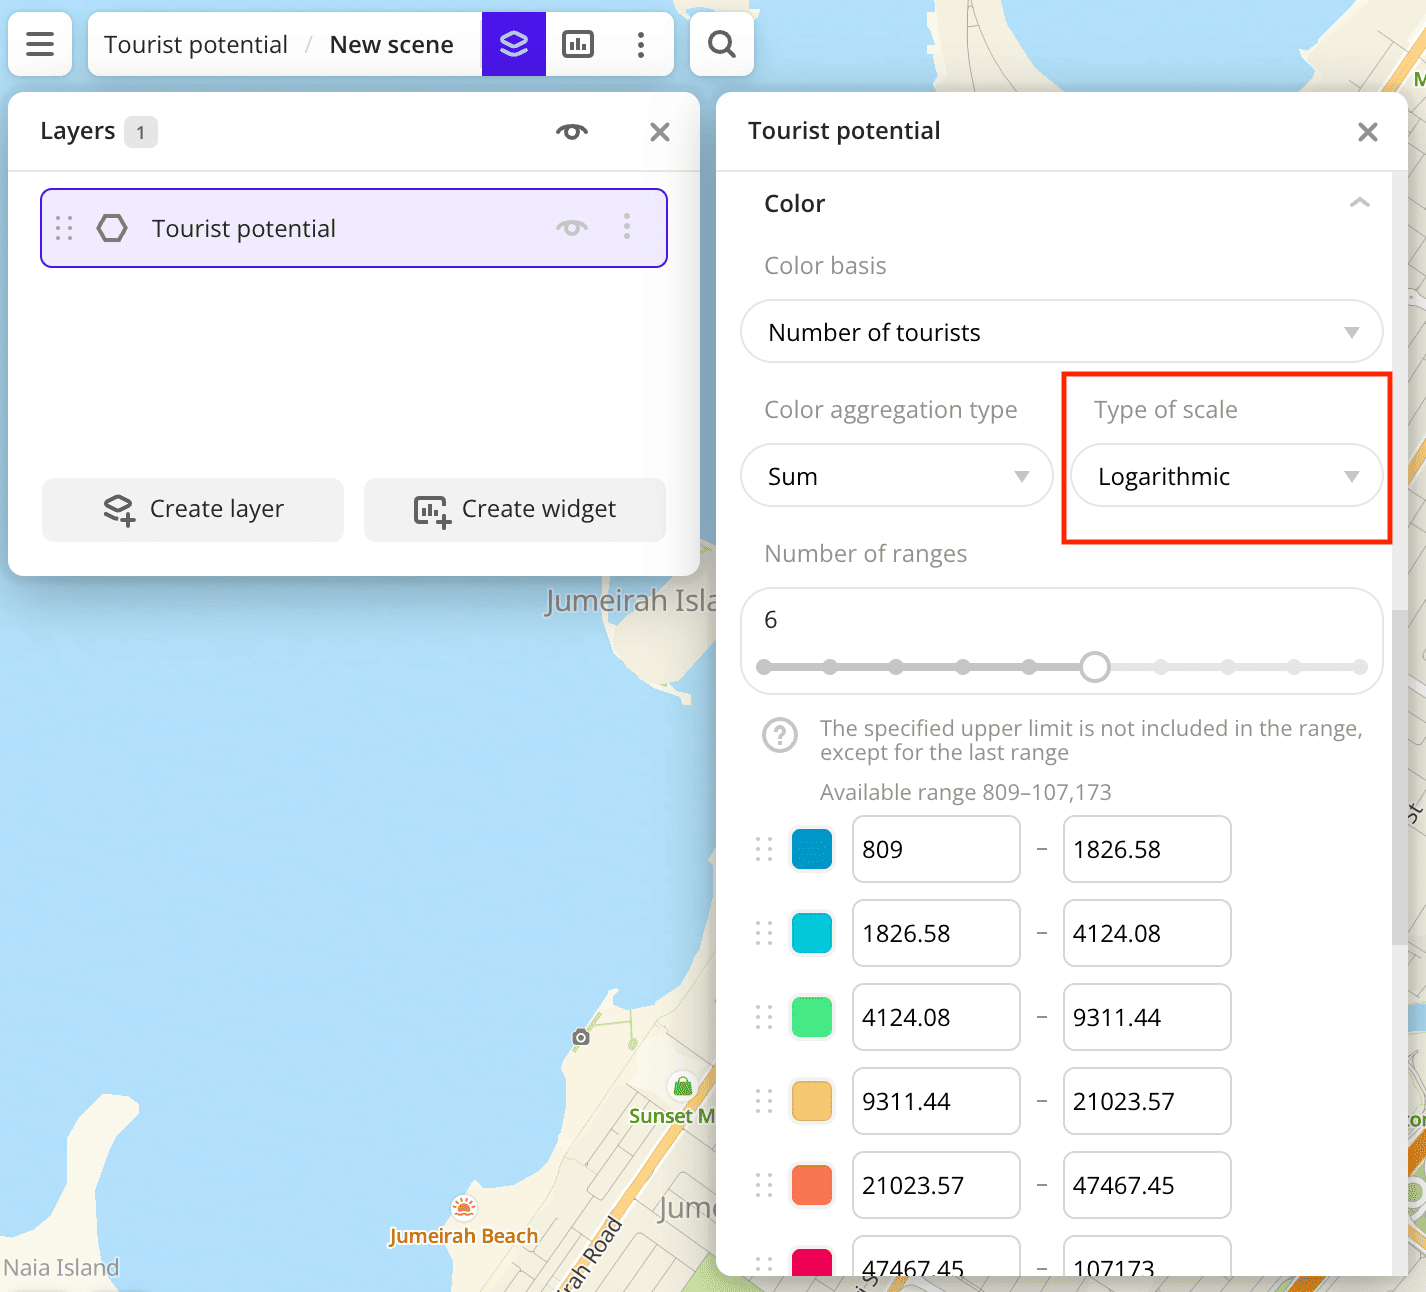
-
In the Type of scale field, select Logarithmic:
Data purchasing
You can purchase data separately as an export in the following formats:
- Table formats:
.csv.txt.json
- Formats for storing geographic data:
.shp(Shape).gpkg(GeoPackage).geojson(GeoJSON)
For more information about the price, available territories, and how to purchase data, fill out the form on urbi.ae.
What's next?
- Getting started.
- Get to know more about other Data categories.
- Get to know how to work with Data visualization.
- Learn more about Layers, Dashboards, Scenes, and Widgets.
- Learn about ready-made Analytics scenarios.