Population well-being
The documentation provides a description with examples of the interface in Russian.
The Population well-being dataset provides information about the income of the working population.
Usage scenarios
The Population well-being dataset helps to solve the problems:
- Selecting a location for opening a business. It helps to evaluate the purchasing power of residents in different districts of the city. For example, premium segment stores can focus on districts with a high average income per person.
- Investment analysis. It allows construction companies and developers to evaluate the demand and feasibility of construction in particular districts. For example, districts with a high average income may be attractive for investment in residential real estate.
- Developing pricing strategies. It helps retail chains and delivery services to adapt their pricing policies based on population income. For example, offering affordable products in districts with low income.
How is the data collected?
The algorithm for calculating the weighted average income of the working population consists of the following steps:
- Obtaining and processing data from the Federal State Statistics Service (Rosstat) on the average monthly wages of employees of organizations by the All-Russian Classifier of Types of Economic Activity (OKVED) sections.
- Matching the Rosstat data with municipal boundaries from 2GIS territorial division data.
- Exporting data on the number of employees in each organization.
- Matching 2GIS directory categories with OKVED sections.
- Dividing municipal territories into H3 cells (hexagons). For more information about the H3 visualization method, see H3.
- Calculating the average salary and the number of employees by each OKVED section for each H3 cell.
- Calculating the weighted average salary for each H3 cell.
Data update and history
- Update frequency: data is updated once a month.
- History: historical data is not available.
Available territories
Data is available only for Russia.
The data may not be available throughout the entire country, but only in populated areas where 2GIS is present. To check data availability, use geofilters or contact technical support.
Data availability
-
Cloud-based (2GIS Pro service):
- Demo tariff plan: data is not available. To start working with the data, change the tariff plan and request access to the dataset.
- Other tariff plans: data is available upon request.
-
On-Premise (installation of the service in a private environment): data is not available.
Getting started
- Go to the Main or Data tab.
- Select the Population well-being dataset.
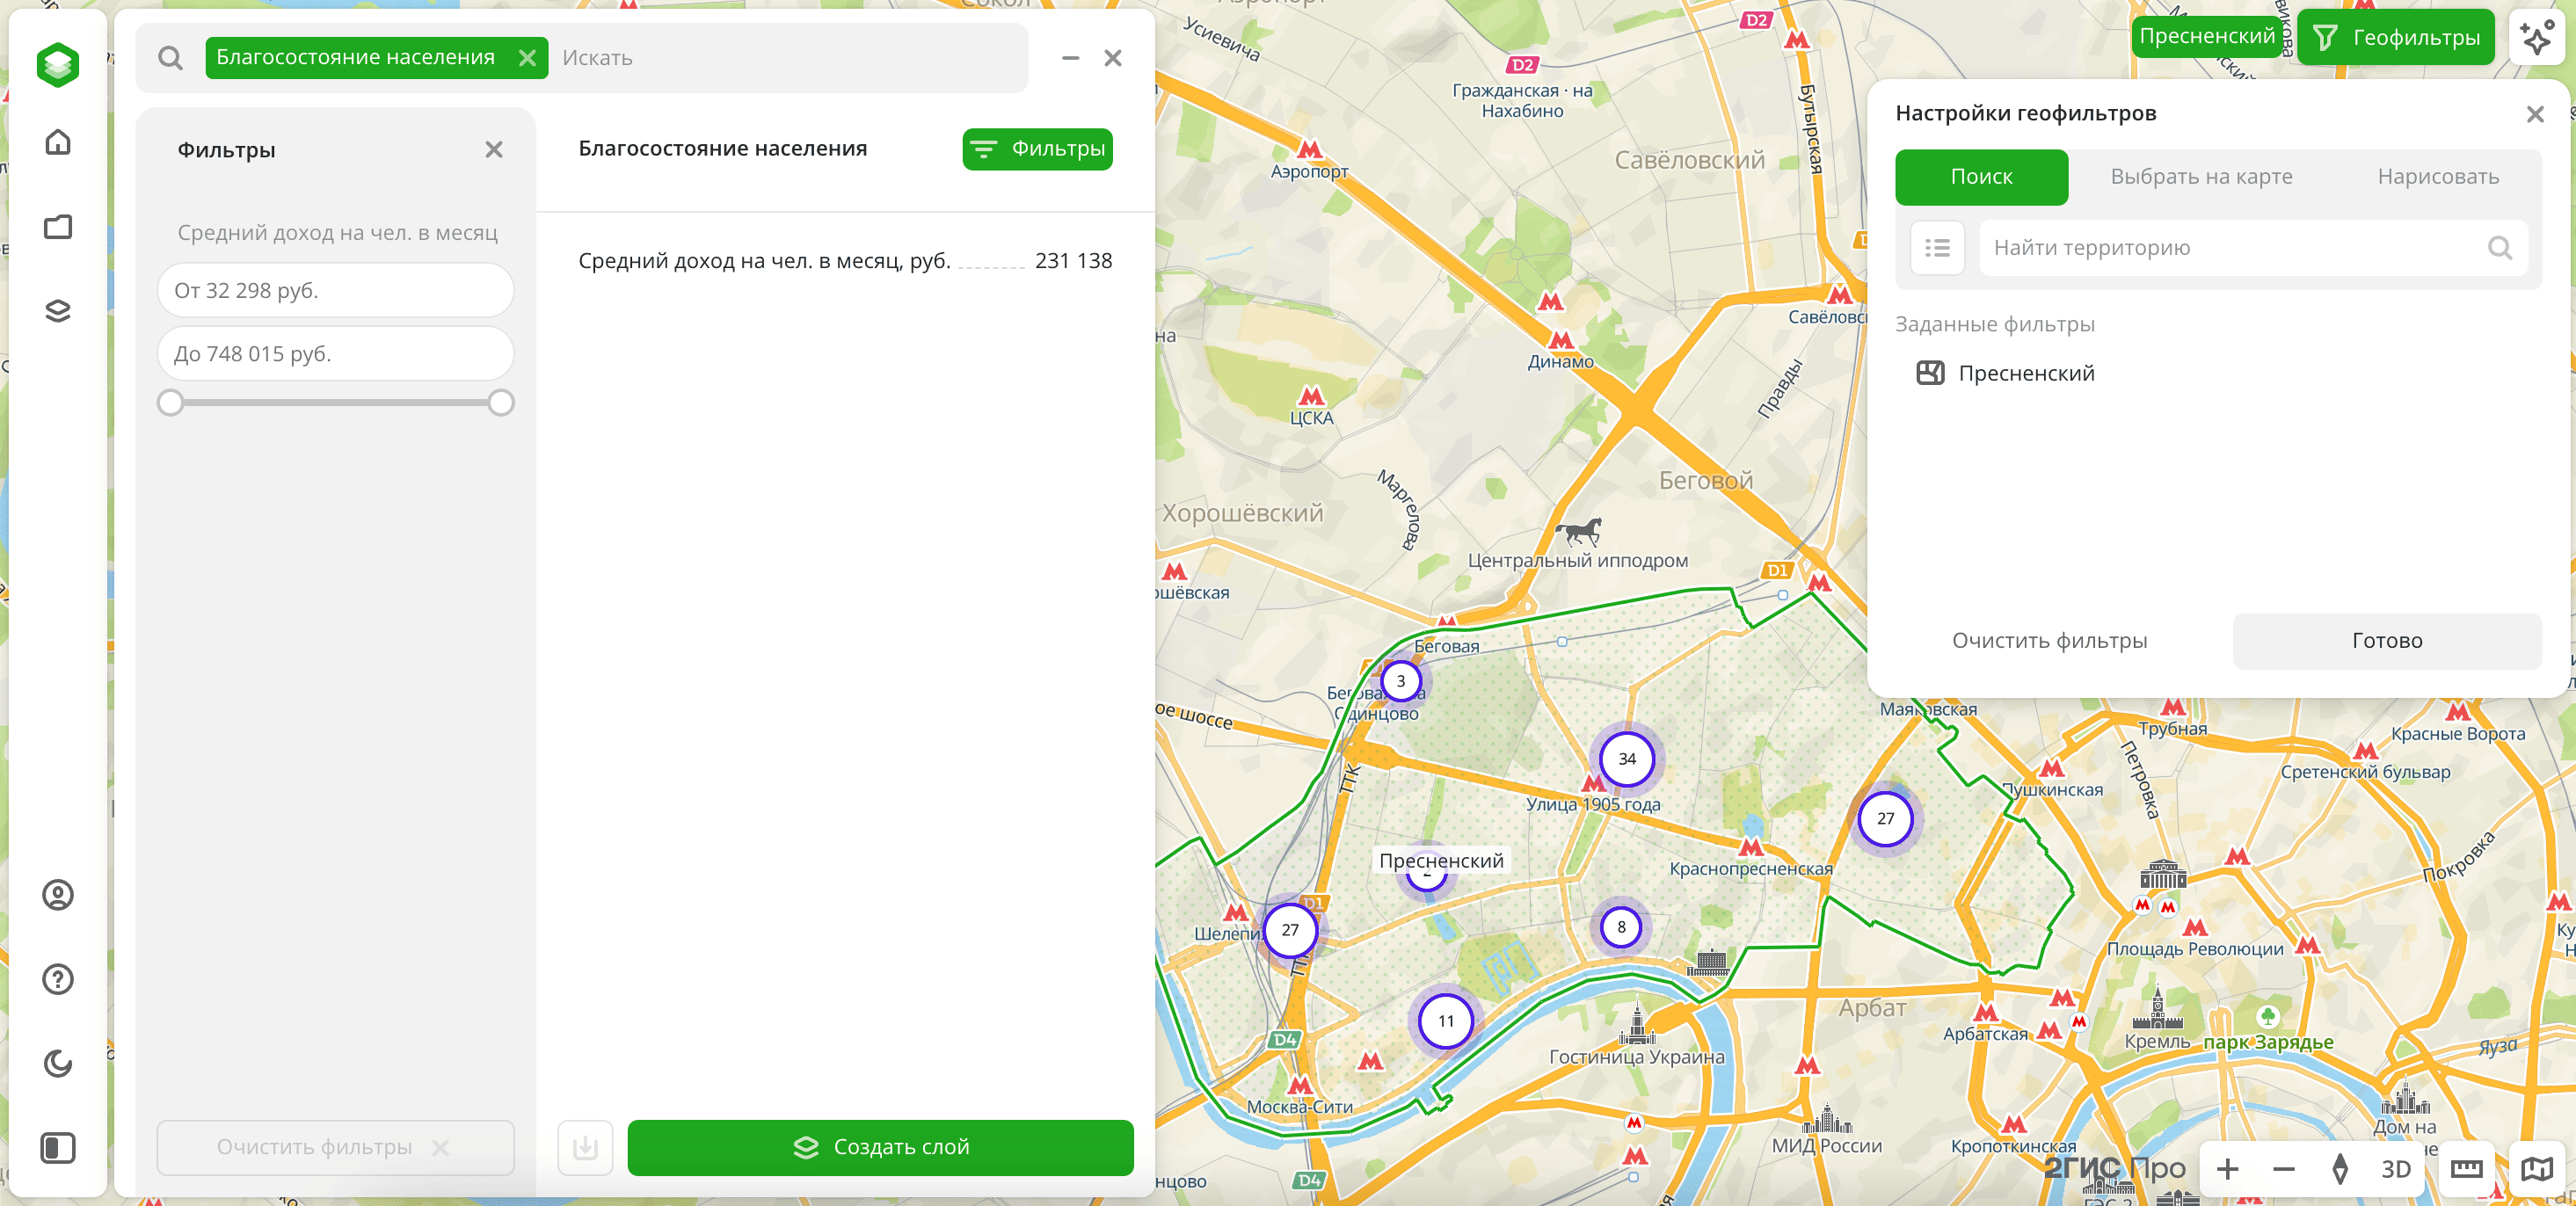
- In the Geofilter settings dialog, select up to 50 territories for which the data sample is created. You can use standard and custom territories and also build polygons, proximity zones, and circles on the map. For more information, see the Geofilters section. After you select the territories, click Done.
- On the Filters tab, set the remaining filters if necessary.
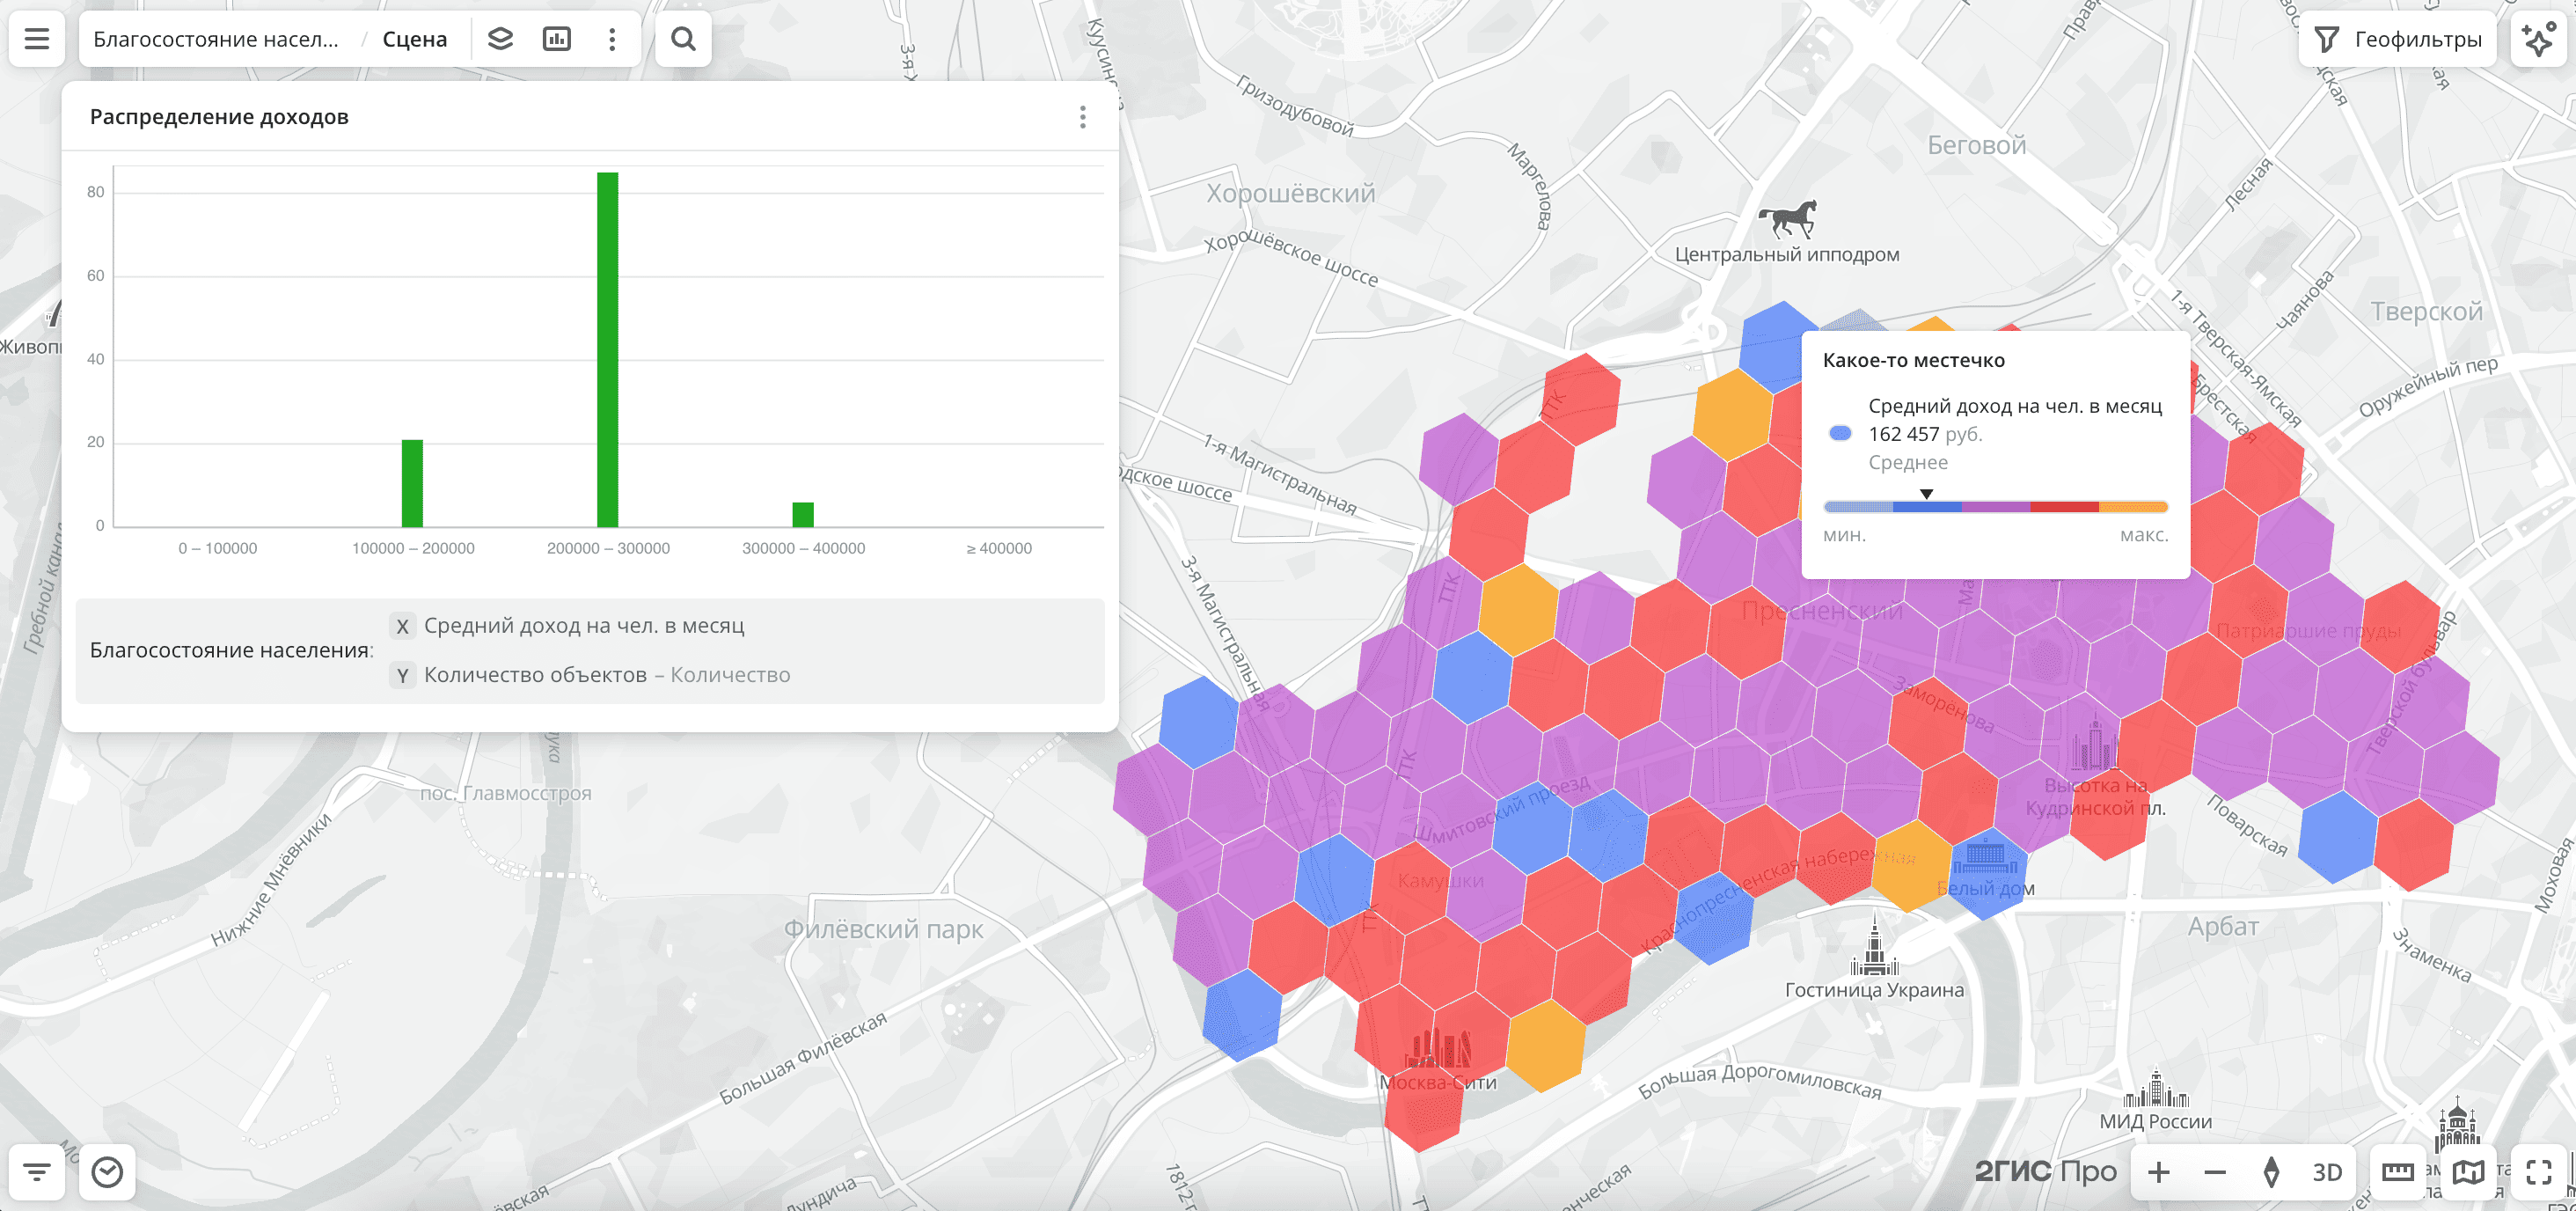
The data is displayed on the map as centroid points: the centers of the object geometries. The average income per person per month in rubles is available in filtering results.
To save the data sample, click Create layer and customize data visualization.
Filters
For the Population well-being dataset, the Average income per person per month filter is available: the average income per person per month in rubles.
To reset the parameter filter, click ![]() icon next to the filter name. To reset all parameter filters, click Reset filters at the bottom of the tab.
icon next to the filter name. To reset all parameter filters, click Reset filters at the bottom of the tab.
To hide the filter by territory, in the Geofilter settings dialog, click ![]() icon next to the geofilter name. To delete the geofilter, click
icon next to the geofilter name. To delete the geofilter, click ![]() icon next to its name. To delete all geofilters, click Clear filters.
icon next to its name. To delete all geofilters, click Clear filters.
Data visualization
The following visualization methods are available for the dataset:
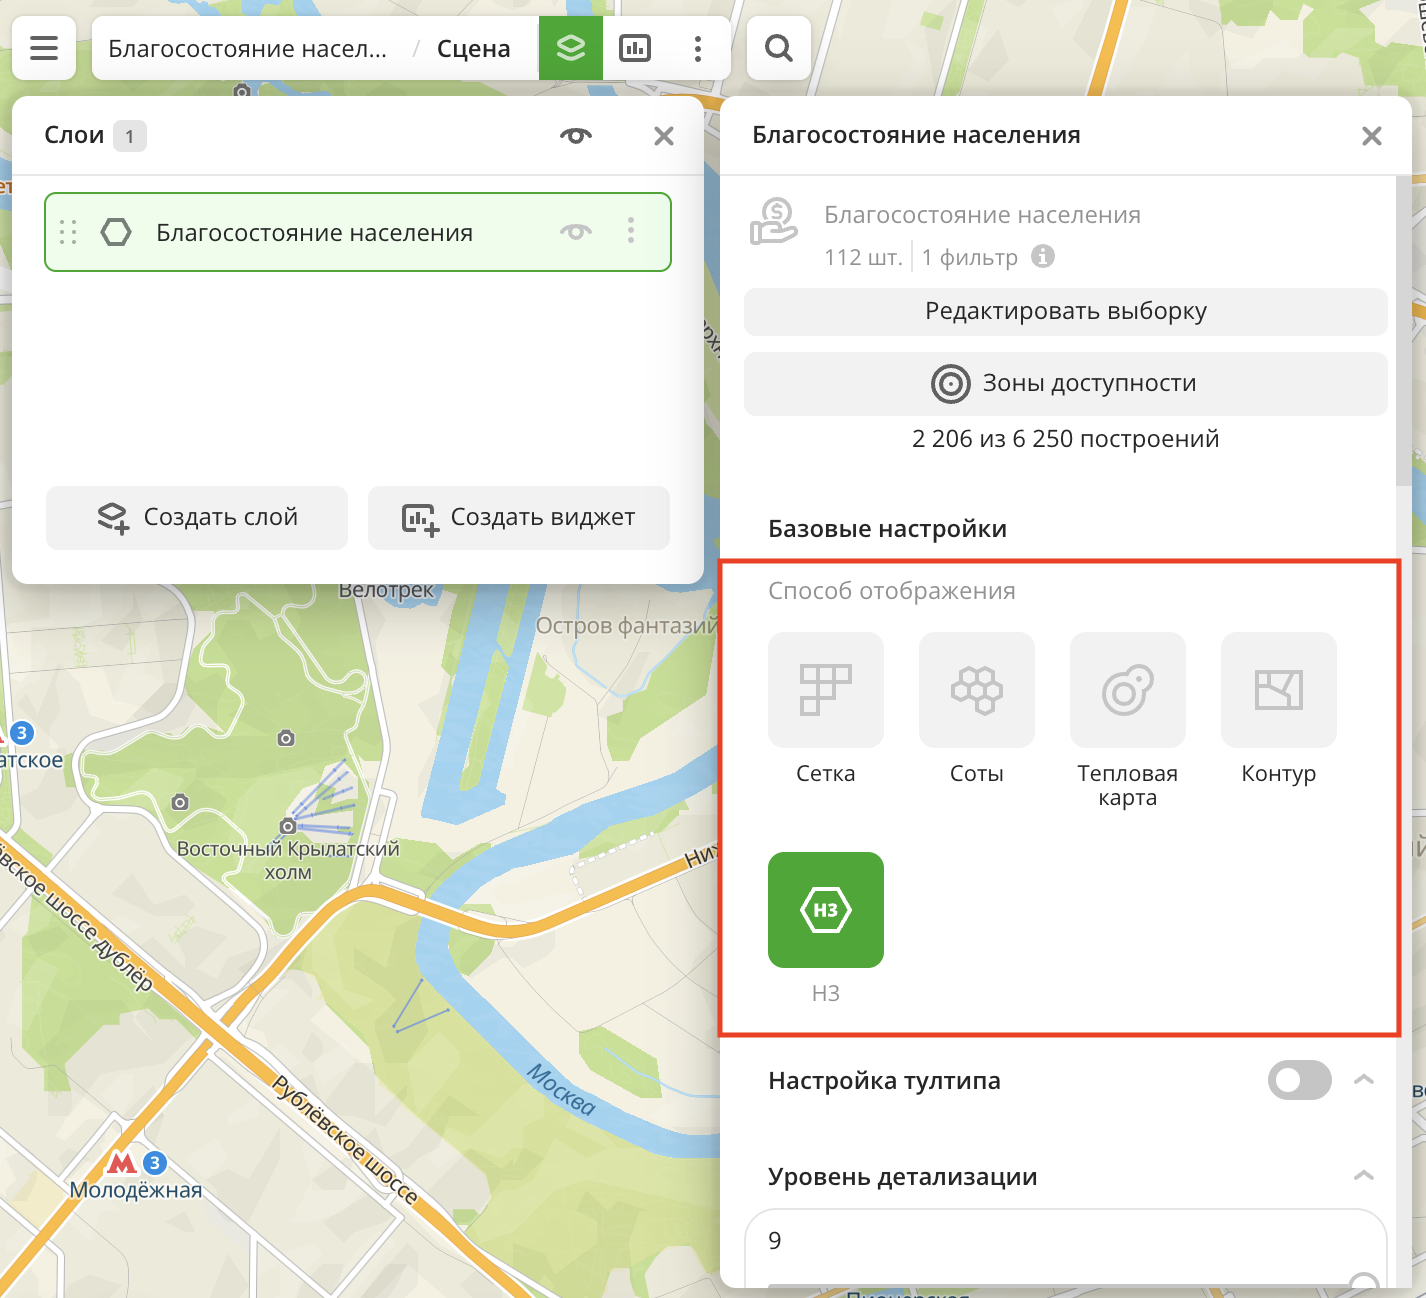
After creating the layer, configure a basic data visualization:
-
Select the H3 visualization method:
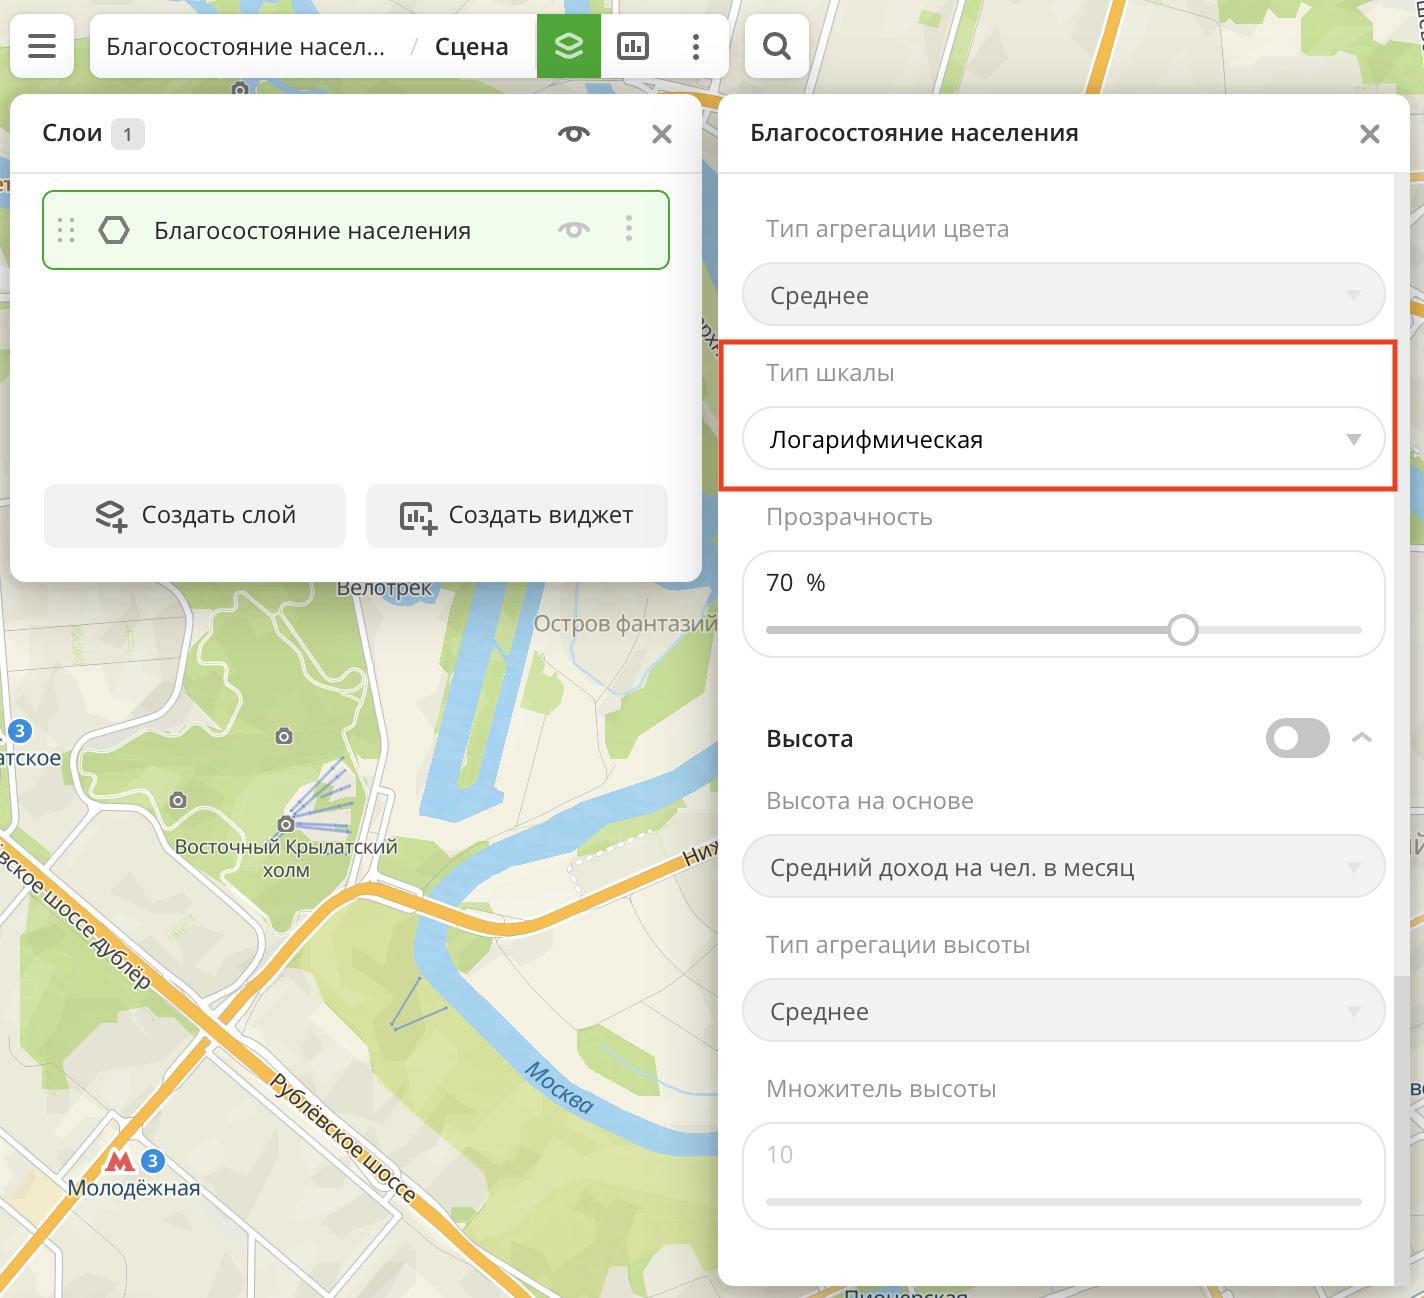
-
In the Type of scale field, select Logarithmic:
Data purchasing
You can purchase data separately as an export in the following formats:
- Table formats:
.csv.txt.json
- Formats for storing geographic data:
.shp(Shape).gpkg(GeoPackage).geojson(GeoJSON)
For more information about the price, available territories, and how to purchase data, fill out the form on urbi.ae.
What's next?
- Getting started.
- Get to know more about other Data categories.
- Get to know how to work with Data visualization.
- Learn more about Layers, Dashboards, Scenes, and Widgets.
- Learn about ready-made Analytics scenarios.