Location analysis
The documentation provides a description with examples of the interface in Russian.
Location analysis allows you to assess the potential of a place for opening a small or medium-sized business and helps you to:
- Find out how many similar venues are located in the selected territory.
- Compare population density and purchasing power in the location with the city.
- Evaluate the flow of pedestrians and cars near a potential location.
- Compare locations with each other.
Locations are analyzed based on 2GIS data: residential and working population, demand, pedestrian and car traffic, and other parameters.
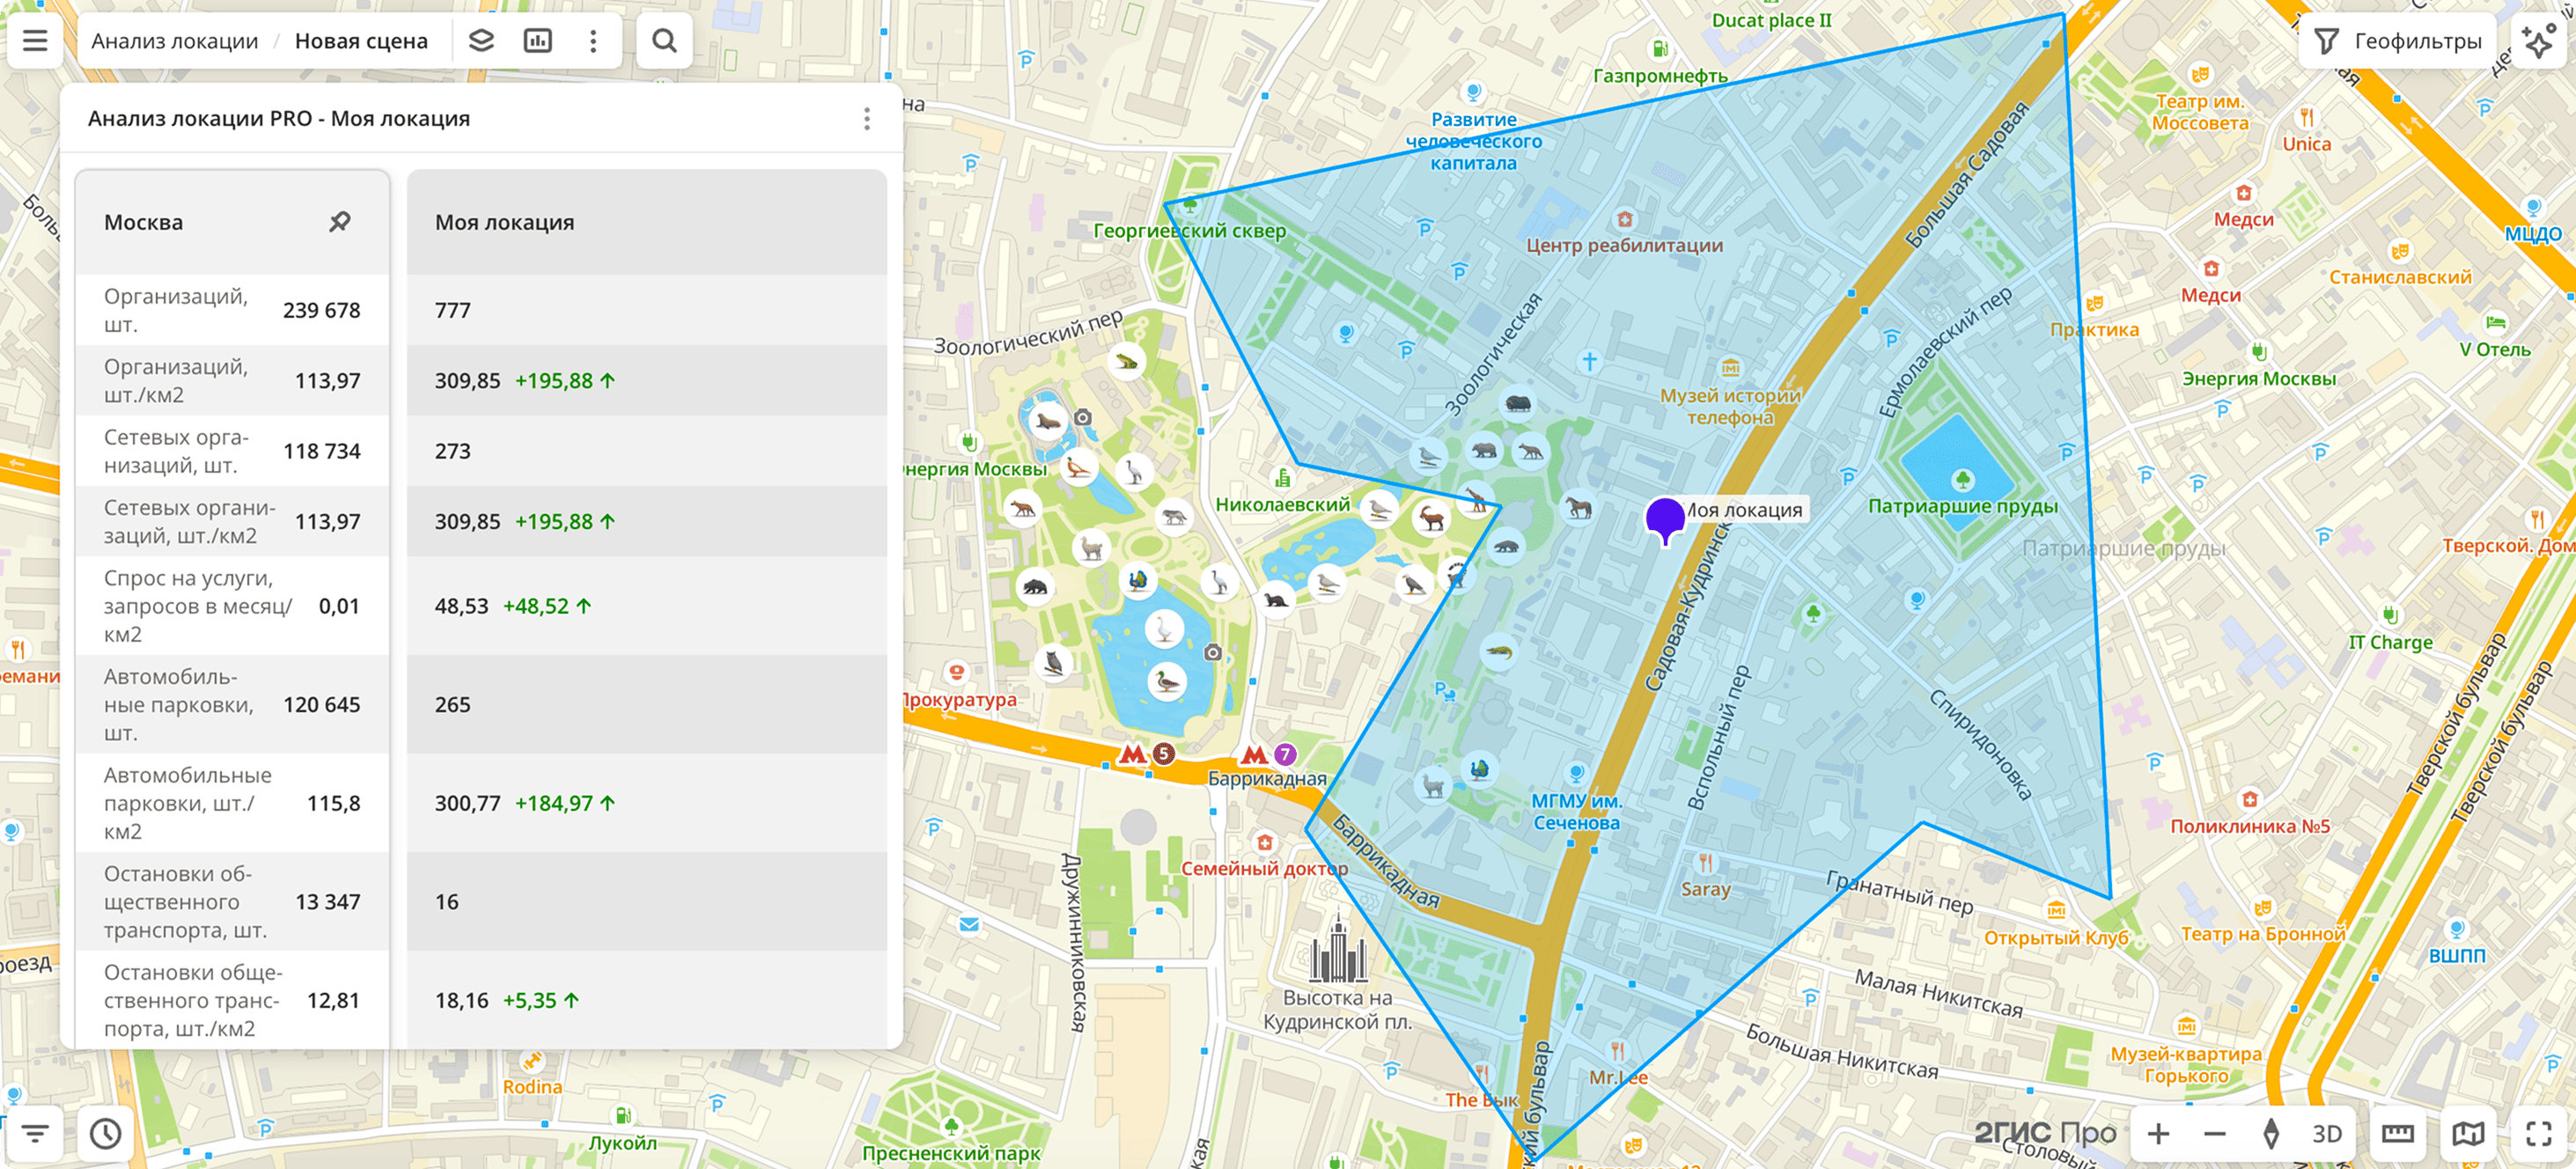
When you perform the analysis, a widget with the Comparison type is created, which can be exported as a PDF report. You can also analyze a location by launching a scenario in the Smart assistant.
Without registering with 2GIS Pro, you can analyze the potential of locations for opening a small or medium-sized business using the interactive Location selection dashboard.
Data in the widget
The widget contains metric values for the city and the selected accessibility zone:
- Organizations, pcs.: number of organizations, including chain organizations (with more than five branches).
- Organizations, pcs./km2: density of organizations, including chain organizations, per 1 km².
- Chain organizations, pcs.: number of organizations with more than five branches.
- Chain organizations, pcs./km2: density of chain organizations per 1 km².
- Demand for services, requests per month/km2: average number of requests in 2GIS per month per 1 km². Calculation period is the last 18 months.
- Car parkings, pcs.: number of car parkings. Only parkings are counted, not the number of parking spaces.
- Car parkings, pcs./km2: density of car parkings per 1 km².
- Public transport stops, pcs.: number of public transport stops.
- Public transport stops, pcs./km2: density of public transport stops per 1 km².
- New buildings, pcs.: number of new residential buildings (built in 2022 or later).
- New buildings, pcs./km2: density of new residential buildings per 1 km².
- Buildings under construction, pcs.: number of buildings under construction.
- Buildings under construction, pcs./km2: density of buildings under construction per 1 km².
- Residential population, people: number of residential population.
- Residential population, people/km2: density of residential population per 1 km².
- Working population, people: number of working population.
- Working population, people/km2: density of working population per 1 km².
- Organizations opened per year, pcs.: number of organizations opened over the last year.
- Organizations opened per year, pcs./km2: density of organizations opened over the last year, per 1 km².
- Organizations closed per year, pcs.: number of organizations closed over the last year.
- Organizations closed per year, pcs./km2: density of organizations closed over the last year, per 1 km².
- Pedestrian traffic, people/hour: average estimated number of pedestrians passing through the point per hour.
- Car traffic, cars/day: average daily car traffic. Calculation period is 12 months.
- Average income per person per month: average monthly income per person.
Getting started
To create a location analysis widget:
-
Go to the Dashboards tab and open a dashboard.
-
Open a scene using the arrows
 and
 . If there is only one scene in the dashboard, it opens automatically.
-
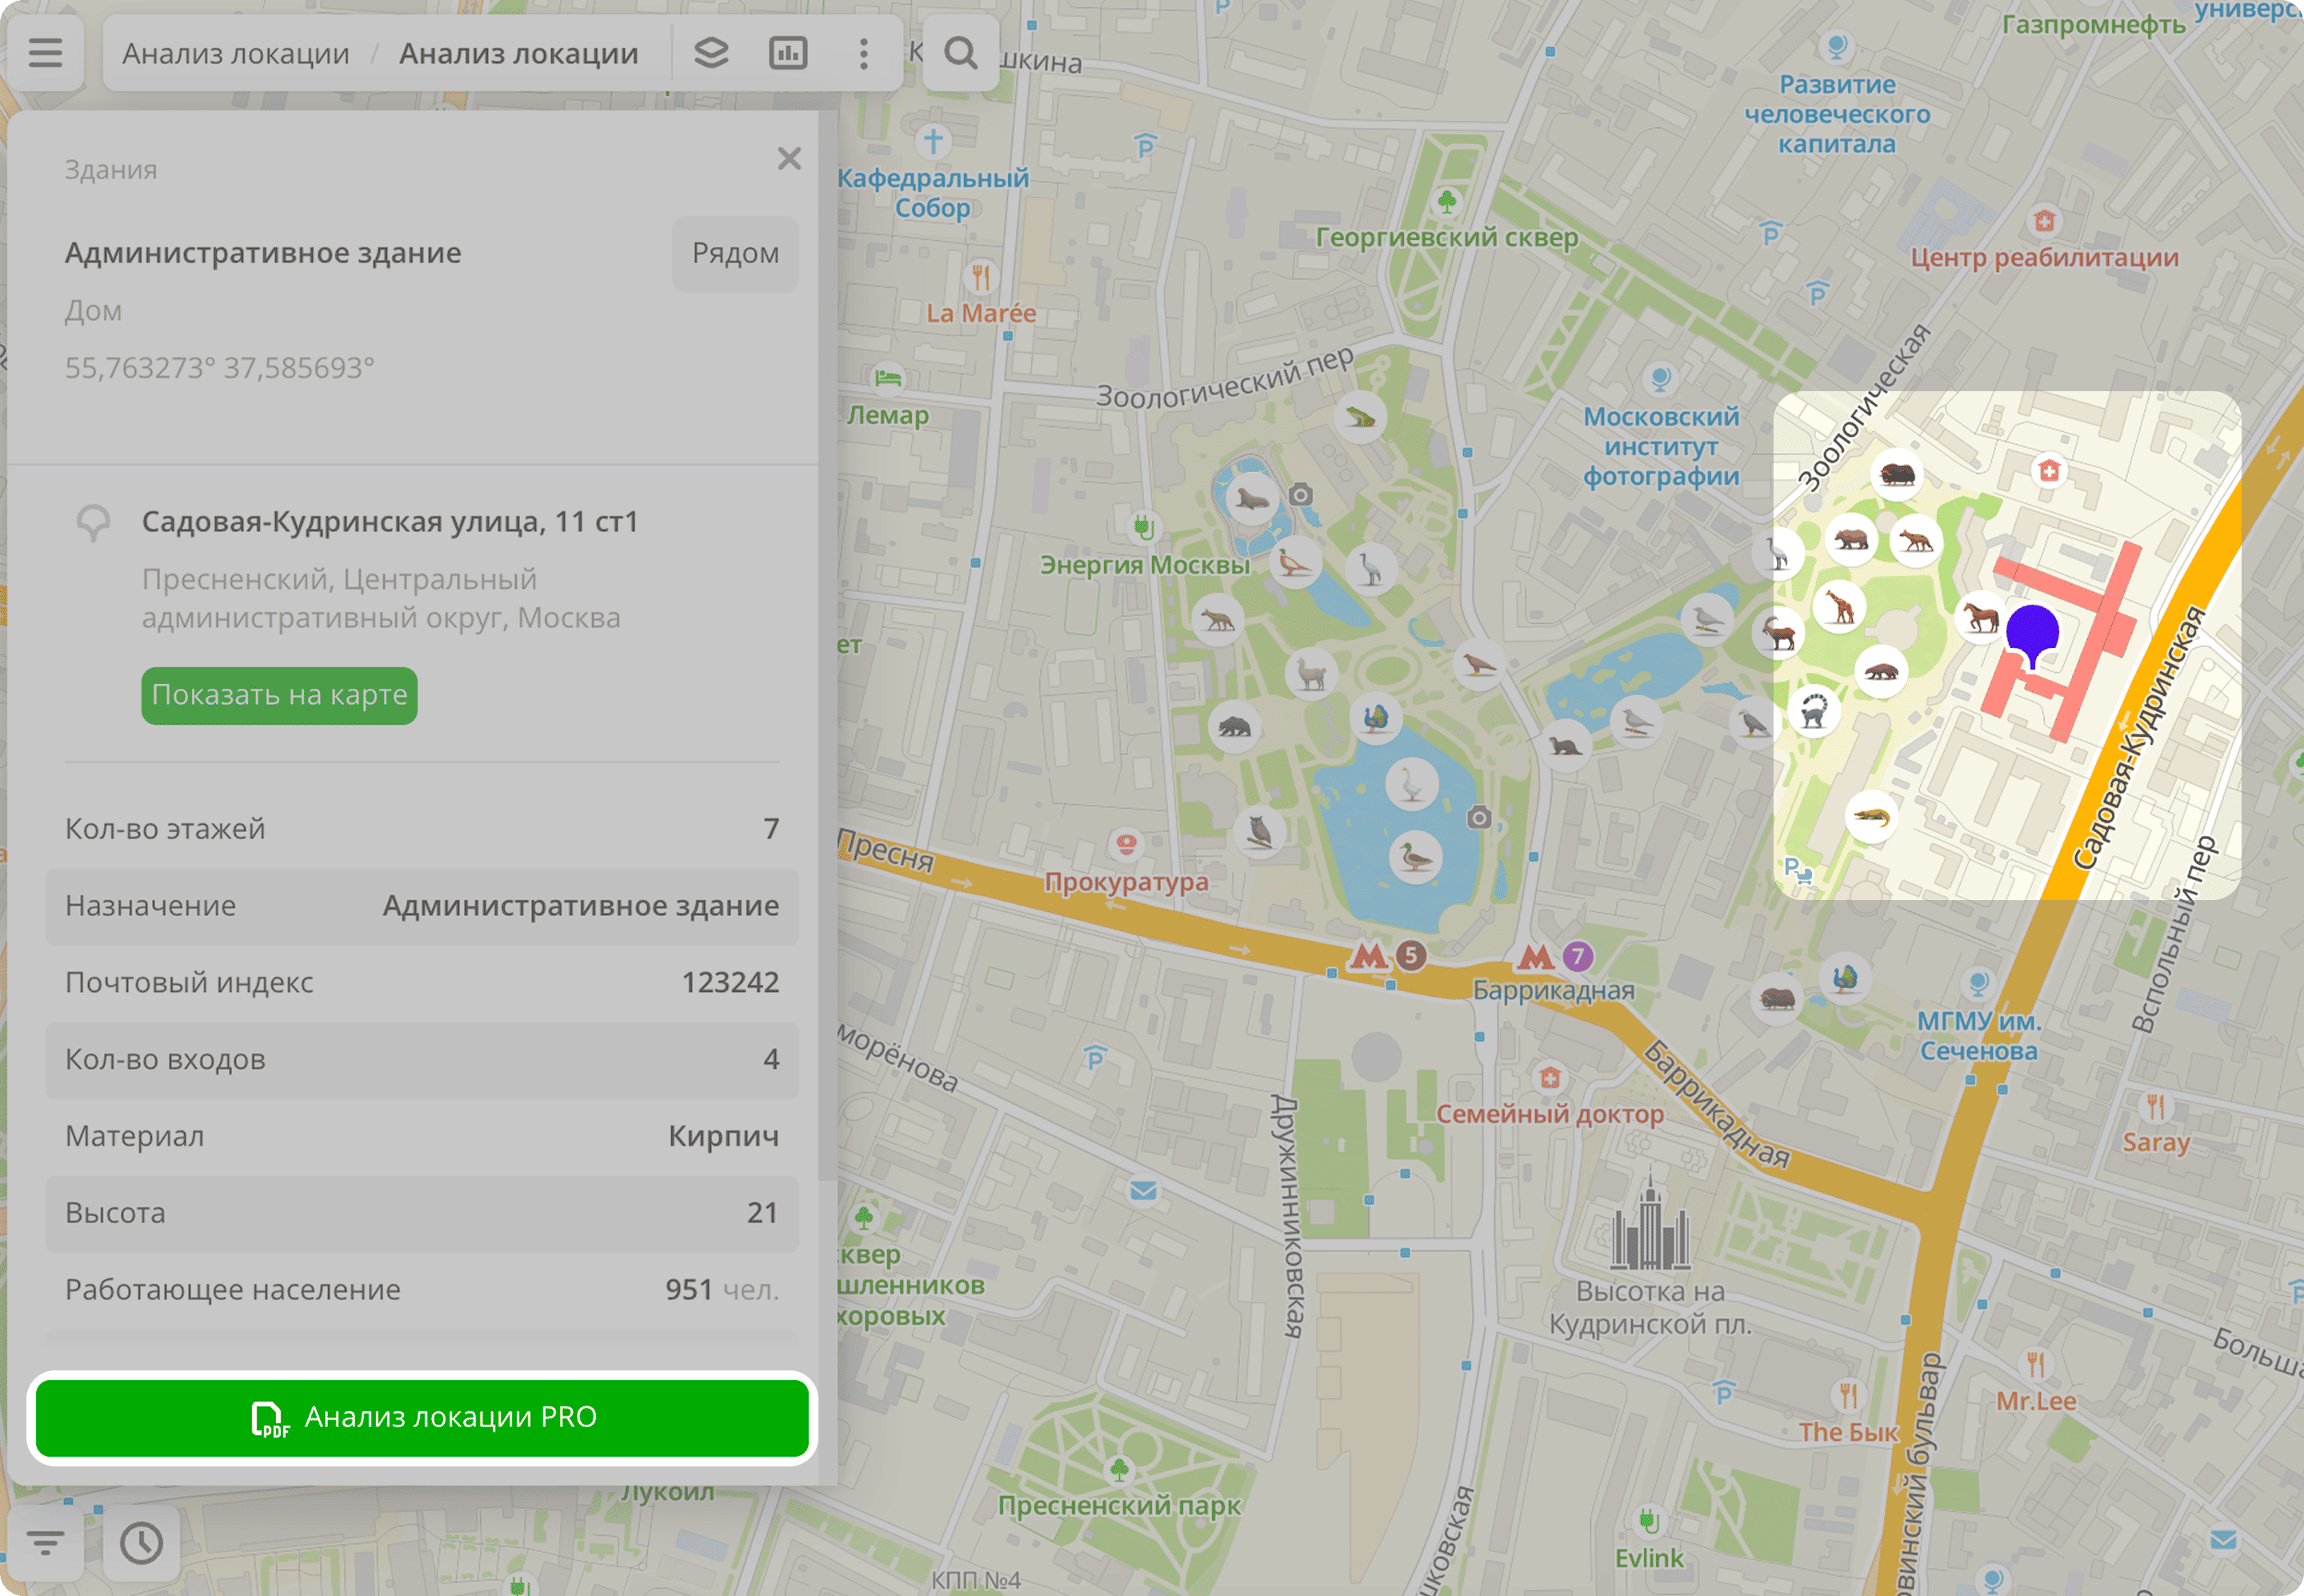
Click a point on the map.
-
Click PRO location analysis.
-
Enter the location name.
-
Specify the proximity zone parameters:
- Proximity zone size: from 1 to 30 minutes from the point.
- Proximity type to objects: on foot or by car.
-
Click Create.
Exporting a report
You can export a location analysis report in PDF format. The file contains:
-
Map with the proximity zone from the point.
-
Table with metrics:
- Metric names.
- Values in the selected location.
- Comparison with average values for the city. For metrics with normalized values per 1 km², the deviation is shown in percentage using the formula
((location − city) / city) × 100%. - Explanation of the metrics.
You cannot change the list of metrics included in the report.
To export the report, in the created widget click  icon and select Export to PDF.
What's next?
- Getting started.
- Get to know service features description.
- Get to know how to work with Data and Data visualization.
- Learn more about Layers, Dashboards, Scenes, and Widgets.