Map
Creating a map
To create a map, create MapControllerOptions, obtain the controller state using the useMapController() method, and pass it to MapView.
import React, { useEffect, useMemo } from 'react';
import { StyleSheet } from 'react-native';
import {
  Bearing,
  CameraPosition,
  DGis,
  GeoPoint,
  Latitude,
  Longitude,
  MapControllerOptions,
  MapView,
  Tilt,
  useMapController,
  Zoom,
} from '@2gis/dgis-mobile-sdk-full';

function point(latitude: number, longitude: number) {
  return new GeoPoint({
    latitude: new Latitude({ value: latitude }),
    longitude: new Longitude({ value: longitude }),
  });
}

export function MapScreen() {
  const context = useMemo(() => DGis.createContext(), []);
  const options = useMemo(
    () =>
      new MapControllerOptions({
        position: new CameraPosition({
          point: point(55.7522, 37.6156),
          zoom: new Zoom({ value: 14 }),
          tilt: new Tilt({ value: 0 }),
          bearing: new Bearing({ value: 0 }),
        }),
      }),
    [],
  );
  const controllerState = useMapController(context, options);
  const mapController =
    controllerState.status === 'ready' ? controllerState.controller : null;

  useEffect(() => {
    if (mapController === null) {
      return;
    }

    return () => {
      mapController.destroy();
    };
  }, [mapController]);

  useEffect(() => {
    return () => DGis.releaseContext(context);
  }, [context]);

  return <MapView controllerState={controllerState} style={styles.map} />;
}

const styles = StyleSheet.create({
  map: { flex: 1 },
});
Map data sources
In some cases, to add objects to the map, you need to create a data source. Data sources are added to the map instead of objects, act as managers for those objects, and are used for working with them.
Types of data sources: moving markers, routes that display current traffic, custom geometric shapes, and so on. Each data source type has a corresponding class. You can get the list of active data sources using the Map.sources property.
Data sources can be passed to MapControllerOptions when creating the map or added later using map.addSource().
import {
  DgisSource,
  DgisSourceWorkingMode,
  MapControllerOptions,
} from '@2gis/dgis-mobile-sdk-full';

const source = DgisSource.createDgisSource(
  context,
  DgisSourceWorkingMode.Online,
);

const options = new MapControllerOptions({
  sources: [source],
});
For immersive data, use the DgisSource.createImmersiveDgisSource() method:
const immersiveSource = DgisSource.createImmersiveDgisSource(context);
map.addSource(immersiveSource);
Offline mode
-
Complete the preparation steps to enable the map to work with preloaded data.
-
Add a map data source. In the createDgisSource() function, set the
workingModeparameter to one of the following DgisSourceWorkingMode values:
OFFLINE- to always use preloaded data only.HYBRID_ONLINE_FIRST- to primarily use online data from 2GIS servers. Preloaded data is used only if it matches online data or data cannot be obtained from the servers.HYBRID_OFFLINE_FIRST- to primarily use preloaded data. Online data from 2GIS servers is used only if preloaded data is missing.
import { DgisSource, DgisSourceWorkingMode } from '@2gis/dgis-mobile-sdk-full';

const offlineSource = DgisSource.createDgisSource(
  context,
  DgisSourceWorkingMode.Offline,
);

map.addSource(offlineSource);
Adding objects
To add dynamic objects to the map (markers, lines, circles, and polygons), create an object manager (MapObjectManager) and specify the map object. Deleting the object manager removes all associated objects from the map. You can create the manager for a dynamic object layer from the style, or pass null to place objects above all other layers.
import { MapObjectManager, type Map } from '@2gis/dgis-mobile-sdk-full';

const manager = new MapObjectManager(map, null);
Use the addObject() and addObjects() methods to add objects. For each dynamic object, you can specify a userData field to store arbitrary data associated with the object. Object settings can be changed after creation.
Use the removeObject() and removeObjects() methods to remove objects. To remove all objects, use the removeAll() method.
MapObjectManager is an object container. As long as the objects are needed on the map, MapObjectManager must be stored at the class level.
Marker
To add a marker to the map, create a Marker object, specify the required settings in MarkerOptions, and pass it to the object manager's addObject() method.
The only required parameter is the marker coordinates (position).
import {
  GeoPointWithElevation,
  Latitude,
  LogicalPixel,
  Longitude,
  Marker,
  MarkerOptions,
  TextStyle,
} from '@2gis/dgis-mobile-sdk-full';

const marker = new Marker(
  new MarkerOptions({
    position: new GeoPointWithElevation({
      latitude: new Latitude({ value: 55.7522 }),
      longitude: new Longitude({ value: 37.6156 }),
    }),
    text: 'Office',
    textStyle: new TextStyle({ fontSize: new LogicalPixel({ value: 14 }) }),
  }),
);

manager.addObject(marker);
To create a marker icon, specify an Image object as the icon parameter. You can create an Image using the following main functions:
- loadLottieFromAsset()
- loadLottieFromFile()
- loadPngFromAsset()
- loadPngFromFile()
- loadSVGFromAsset()
- loadSVGFromFile()
For the complete list of functions, see the ImageLoader object description.
For example, to create a marker with an SVG icon:
import {
  GeoPointWithElevation,
  ImageLoader,
  Latitude,
  Longitude,
  Marker,
  MarkerOptions,
} from '@2gis/dgis-mobile-sdk-full';

const imageLoader = new ImageLoader(context);
const icon = await imageLoader.loadSVGFromAsset('assets/icons/bridge.svg');

const marker = new Marker(
  new MarkerOptions({
    position: new GeoPointWithElevation({
      latitude: new Latitude({ value: 55.7522 }),
      longitude: new Longitude({ value: 37.6156 }),
    }),
    icon,
  }),
);
Line
To draw a line (polyline) on the map, create a Polyline object, specify the line settings in PolylineOptions, and pass the object to the object manager's addObject() method.
You can specify the coordinates of the line vertices and set its width, color, and other parameters.
import {
  Color,
  LogicalPixel,
  Polyline,
  PolylineOptions,
} from '@2gis/dgis-mobile-sdk-full';

const polyline = new Polyline(
  new PolylineOptions({
    points: [
      point(55.7522, 37.6156),
      point(55.758, 37.62),
      point(55.764, 37.61),
    ],
    width: new LogicalPixel({ value: 4 }),
    color: new Color({ argb: 0xff1e88e5 }),
  }),
);

manager.addObject(polyline);
Polygon
To draw a polygon on the map, create a Polygon object, specify the required settings in PolygonOptions, and pass it to the object manager's addObject() method.
Polygon coordinates are specified as a two-dimensional list. The first nested list must contain the coordinates of the polygon's main vertices. The other nested lists are optional and can be specified to create a cutout inside the polygon (one additional list per polygonal cutout).
import {
  Color,
  LogicalPixel,
  Polygon,
  PolygonOptions,
} from '@2gis/dgis-mobile-sdk-full';

const polygon = new Polygon(
  new PolygonOptions({
    contours: [[
      point(55.751, 37.61),
      point(55.755, 37.619),
      point(55.748, 37.622),
    ]],
    color: new Color({ argb: 0x5538bdf8 }),
    strokeWidth: new LogicalPixel({ value: 2 }),
    strokeColor: new Color({ argb: 0xff0284c7 }),
  }),
);

manager.addObject(polygon);
Circle
To draw a circle on the map, create a Circle object, specify the required settings in CircleOptions, and pass it to the object manager's addObject() method:
import {
  Circle,
  CircleOptions,
  Color,
  LogicalPixel,
  Meter,
} from '@2gis/dgis-mobile-sdk-full';

const circle = new Circle(
  new CircleOptions({
    position: point(55.7522, 37.6156),
    radius: new Meter({ value: 150 }),
    color: new Color({ argb: 0x44f97316 }),
    strokeWidth: new LogicalPixel({ value: 2 }),
    strokeColor: new Color({ argb: 0xffea580c }),
  }),
);

manager.addObject(circle);
3D models
Requirements and recommendations
For optimal map performance and correct display of 3D models on the map, follow these requirements and recommendations.
Mandatory requirements:
-
Format: glTF/GLB (
.gltf,.glbfiles). -
Mesh: it is preferred that the model contains one mesh (a geometric object in the scene). Using models with multiple meshes reduces map performance.
-
Texture:
- A mesh can have a texture or a single-color fill.
- The texture resolution must be a power of two (2, 4, 8, 16, 32, 64, 128, and 256). High-resolution textures reduce map performance.
- The supported image formats are
.png,.jpg, and.bmp. - Texture compression is not supported.
-
Instantiation: extensions for instantiation are not supported.
Usage and performance recommendations:
- Size: the optimal size for unique models is no more than 10 000 vertices; for typical models (for example, trees), it is from 200 to 2000 vertices.
- Texture: the optimal texture size for unique models is 256×256; for typical models, it is 64×64.
- Colors: if you do not customize your own map styles and only load models, it is recommended that the model texture colors match the colors of the 2GIS map.
- Compression: the Draco algorithm is recommended for model compression.
- Matrix animations: supported, but using them reduces map performance.
- PBR lighting model: supported, but using it reduces map performance.
- Local transformations: local transformations (translations, rotations, and scaling) are supported but reduce map performance.
Adding models
To add a 3D model to the map:
- Convert the model into a ModelData object to be used in the SDK using the ModelLoader.loadFromAsset() method.
- Create a ModelSize object and specify the model size in one of the following ways:
- To set a constant model size that will not change when the map scale changes, use the
logicalPixel()method and specify the size in logical pixels. - To set a size that depends on the map scale (the model becomes smaller when zooming out and vice versa), use the
scale()method and specify the model scaling factor as ModelScale.
- Create a ModelMapObject, specify the required settings in ModelMapObjectOptions, and pass it to the object manager's
addObject()method.
import {
  GeoPointWithElevation,
  Latitude,
  LogicalPixel,
  Longitude,
  ModelLoader,
  ModelMapObject,
  ModelMapObjectOptions,
  ModelSize,
} from '@2gis/dgis-mobile-sdk-full';

const modelLoader = new ModelLoader(context);
const data = await modelLoader.loadFromAsset('map/model.glb');

const model = new ModelMapObject(
  new ModelMapObjectOptions({
    position: new GeoPointWithElevation({
      latitude: new Latitude({ value: 55.7522 }),
      longitude: new Longitude({ value: 37.6156 }),
    }),
    data,
    size: ModelSize.logicalPixel(new LogicalPixel({ value: 80 })),
  }),
);

manager.addObject(model);
Adding multiple objects
Do not add a collection of objects to the map by calling addObject() in a loop over the entire collection, as this leads to performance loss. To add a collection of objects, prepare the entire collection first and add it using the addObjects() method:
manager.addObjects([marker, polyline, polygon, circle]);
manager.removeObjects([polyline, polygon]);
manager.removeAll();
Clustering
Clustering is the visual grouping of closely located objects (markers) into a single cluster as you zoom out the map. Grouping occurs gradually: the lower the zoom level, the fewer clusters are formed. A cluster is displayed as a marker with a number indicating the number of objects in the cluster.
To add markers to the map in clustering mode, create an object manager (MapObjectManager) using the MapObjectManager.withClustering() method and specify the following properties:
- The map instance (
map). - The minimum distance between markers in logical pixels at zoom levels where clustering is active (
logicalPixel). - The zoom level at which and above only individual markers are visible, without clusters (
maxZoom). - The zoom level at which and below no new clusters are formed (
minZoom). - A custom implementation of the SimpleClusterRenderer protocol, which is used to customize clusters in MapObjectManager.
import {
  LogicalPixel,
  MapObjectManager,
  SimpleClusterOptions,
  TextStyle,
  Zoom,
  type SimpleClusterObject,
  type SimpleClusterRenderer,
} from '@2gis/dgis-mobile-sdk-full';

const clusterRenderer: SimpleClusterRenderer = {
  renderCluster(cluster: SimpleClusterObject) {
    return new SimpleClusterOptions({
      icon: null,
      text: String(cluster.objectCount),
      textStyle: new TextStyle({ fontSize: new LogicalPixel({ value: 16 }) }),
    });
  },
};

const clusteredManager = MapObjectManager.withClustering(
  map,
  new LogicalPixel({ value: 80 }),
  new Zoom({ value: 18 }),
  clusterRenderer,
  new Zoom({ value: 0 }),
  null,
);
Once an object manager with clustering is created, you can add markers as usual using addObject() or addObjects().
Generalization
Generalization is the visual grouping of closely located objects (markers) such that, as you zoom out the map, a single "key" object is displayed instead of several markers. Grouping occurs gradually: the lower the zoom level, the fewer groups are formed.
To add markers to the map in generalization mode, create an object manager (MapObjectManager) using the MapObjectManager.withGeneralization() method and specify the following properties:
- The map instance (
map). - The minimum distance between markers in logical pixels at zoom levels where generalization is active (
logicalPixel). - The zoom level at which and above only individual markers are visible, without groups (
maxZoom). - The zoom level at which and below no new groups are formed (
minZoom).
const generalizedManager = MapObjectManager.withGeneralization(
  map,
  new LogicalPixel({ value: 80 }),
  new Zoom({ value: 18 }),
  new Zoom({ value: 0 }),
  null,
);
Once an object manager with generalization is created, you can add markers as usual using addObject() or addObjects().
Custom geolocation marker
You can replace the default geolocation marker on the map with a custom 3D model. See the requirements for uploaded models in the 3D models section.
To set a custom geolocation marker:
- Create a geolocation data source using the MyLocationMapObjectSource object and set the marker type to
Modelin themarkerTypeparameter. - Add the created source to the map using the
map.addSource()method.
import {
  MyLocationControllerSettings,
  MyLocationMapObjectMarkerType,
  MyLocationMapObjectSource,
} from '@2gis/dgis-mobile-sdk-full';

const locationSource = new MyLocationMapObjectSource(
  context,
  new MyLocationControllerSettings({}),
  MyLocationMapObjectMarkerType.Model,
);

map.addSource(locationSource);
Selecting objects
Highlighting objects by tapping the map
- Get information about the objects that fall within the tap area using the getRenderedObjects() method.
- Check the first object and call the setHighlighted() method, which accepts a list of directory identifiers for the objects to change as DgisObjectId.
import {
  DgisMapObject,
  DgisSource,
  ScreenDistance,
  ScreenPoint,
} from '@2gis/dgis-mobile-sdk-full';

const connection = controller.gestureRecognizer.tap.subscribe(screenPoint => {
  const future = map.getRenderedObjects(
    new ScreenPoint({ x: screenPoint.x, y: screenPoint.y }),
    new ScreenDistance({ value: 8 }),
  );

  future.onComplete(
    objects => {
      const info = objects[0];
      const object = info?.item.item;
      const source = info?.item.source;

      if (object instanceof DgisMapObject && source instanceof DgisSource) {
        source.setHighlighted([object.id], true);
      }

      future.destroy();
    },
    error => {
      console.warn(error);
    },
  );
});

// When the handler is no longer needed:
connection.disconnect();
Controlling the camera
Use the Camera object, available through the map.camera property, to control the camera.
Changing camera position
To start a camera flight animation, call the moveToCameraPosition() method and specify the flight parameters:
position- the final camera position (coordinates and zoom level). You can also specify the camera tilt and rotation (CameraPosition).time- the flight duration in seconds (Duration).animationType- the animation type (CameraAnimationType).
The moveToCameraPosition() function returns a Future object that you can use to handle the flight completion event.
import {
  CameraAnimationType,
  CameraPosition,
  Duration,
  Zoom,
} from '@2gis/dgis-mobile-sdk-full';

const future = map.camera.moveToCameraPosition(
  new CameraPosition({
    point: point(55.7522, 37.6156),
    zoom: new Zoom({ value: 16 }),
  }),
  Duration.ofMilliseconds(600),
  CameraAnimationType.Default,
);

future.onComplete(
  () => future.destroy(),
  error => {
    console.warn(error);
  },
);
For more precise control over the flight animation, you can use a flight controller that determines the camera position at each moment. To do this, implement the CameraMoveController interface and pass the created object to the moveToCameraPosition() method instead of the flight parameters.
Getting camera state
You can obtain the current camera state (whether the camera is currently flying) using the state property. See CameraState for a list of possible camera states.
const cameraState = map.camera.state;
Getting camera position
You can obtain the current camera position using the position property (see the CameraPosition object):
const cameraPosition = map.camera.position;
Calculating camera position
To display an object or a group of objects on the screen, use the calcPositionForObjects() or calcPositionForGeometry() method to calculate the camera position:
import { calcPositionForObjects } from '@2gis/dgis-mobile-sdk-full';

const position = calcPositionForObjects(
  map.camera,
  [marker, polyline],
  null,
  null,
  null,
  null,
  null,
);

map.camera.position = position;
Configuring the camera position point and viewpoint
You can control how the map is displayed on the screen, for example, by changing the size of the map viewport while keeping the view position. To do this, use screen points: the camera position point BaseCamera.positionPoint and the camera viewpoint BaseCamera.viewPoint.
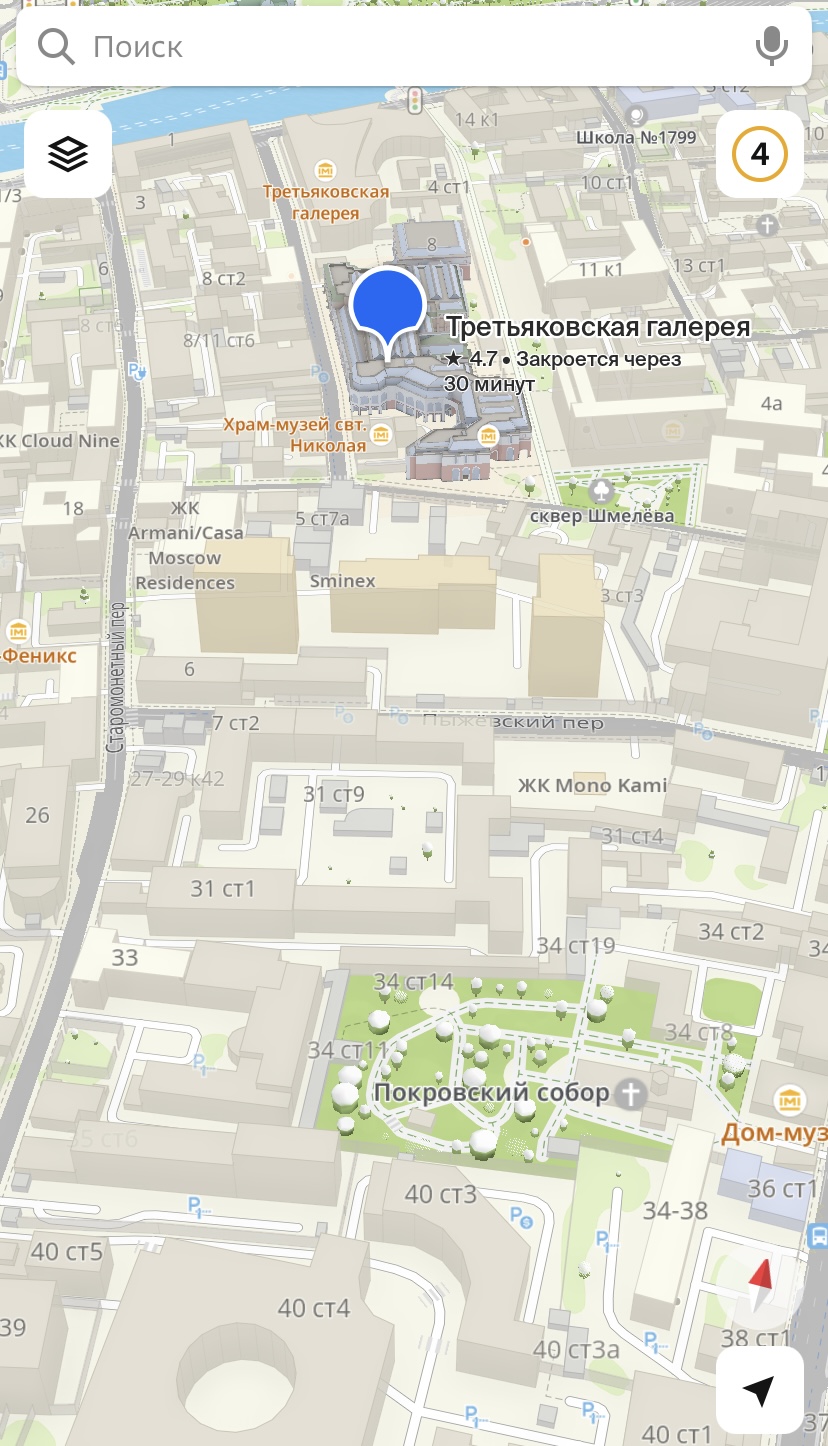
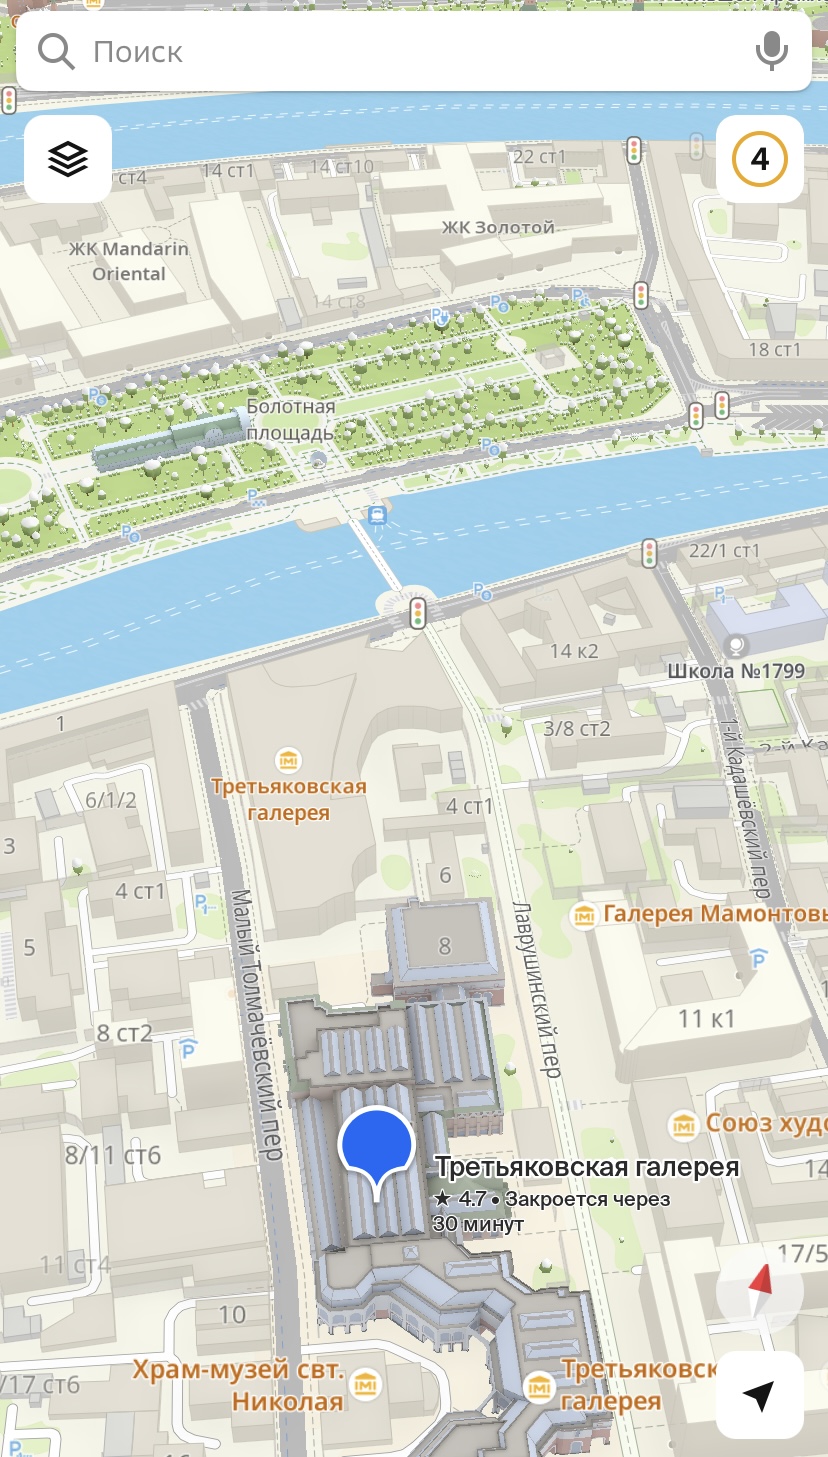
The camera position point (BaseCamera.positionPoint) is the screen point to which the camera is anchored, taking BaseCamera.padding into account. The point is set relative to the map viewport:
import { CameraPositionPoint } from '@2gis/dgis-mobile-sdk-full';

map.camera.positionPoint = new CameraPositionPoint({ x: 0.5, y: 0.75 });
When the camera position point changes, the map viewport changes and the observation point CameraPosition.point shifts. This is a terrain point in geographic coordinates located at the camera position point. The tilt angle CameraPosition.tilt and camera rotation angle CameraPosition.bearing do not change:
The camera viewpoint (BaseCamera.viewPoint) is the screen point the camera is looking at. The point is set relative to the map viewport:
import { CameraViewPoint } from '@2gis/dgis-mobile-sdk-full';

map.camera.viewPoint = new CameraViewPoint({ x: 0.5, y: 0.5 });
When the camera viewpoint changes, the direction of view relative to the observation point changes. The observation point CameraPosition.point does not shift, and the tilt angle CameraPosition.tilt and camera rotation angle CameraPosition.bearing do not change:
visibleArea and visibleRect
The camera has two properties that describe the geometry of the visible area in different ways. visibleRect has the GeoRect type and is always a rectangle. visibleArea is an arbitrary geometry. You can see the difference in examples with different camera tilt angles relative to the map:
-
With a 45° tilt,
visibleRectandvisibleAreaare not equal: in this case,visibleRectis larger because it must be a rectangle containingvisibleArea.visibleAreais shown in blue andvisibleRectin red.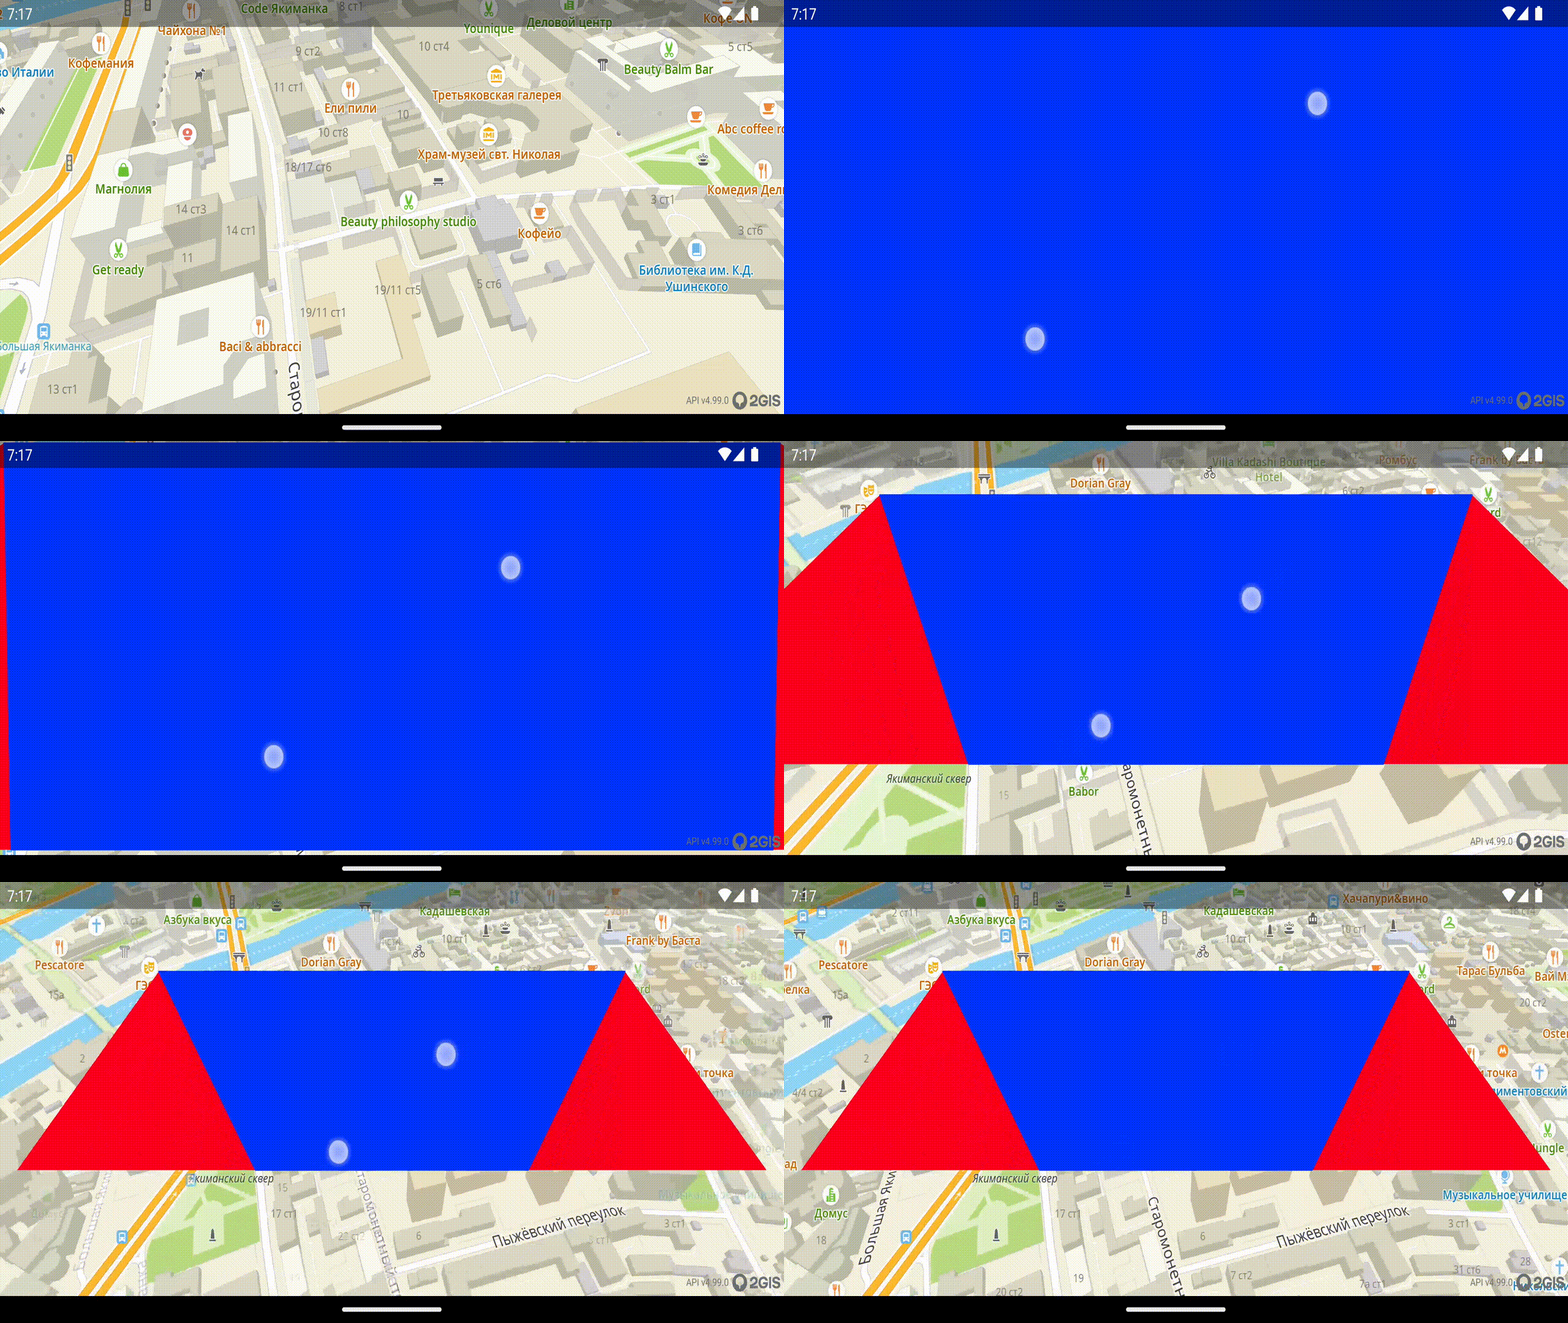
-
With a 0° tilt,
visibleAreaandvisibleRectoverlap, as shown by the color change.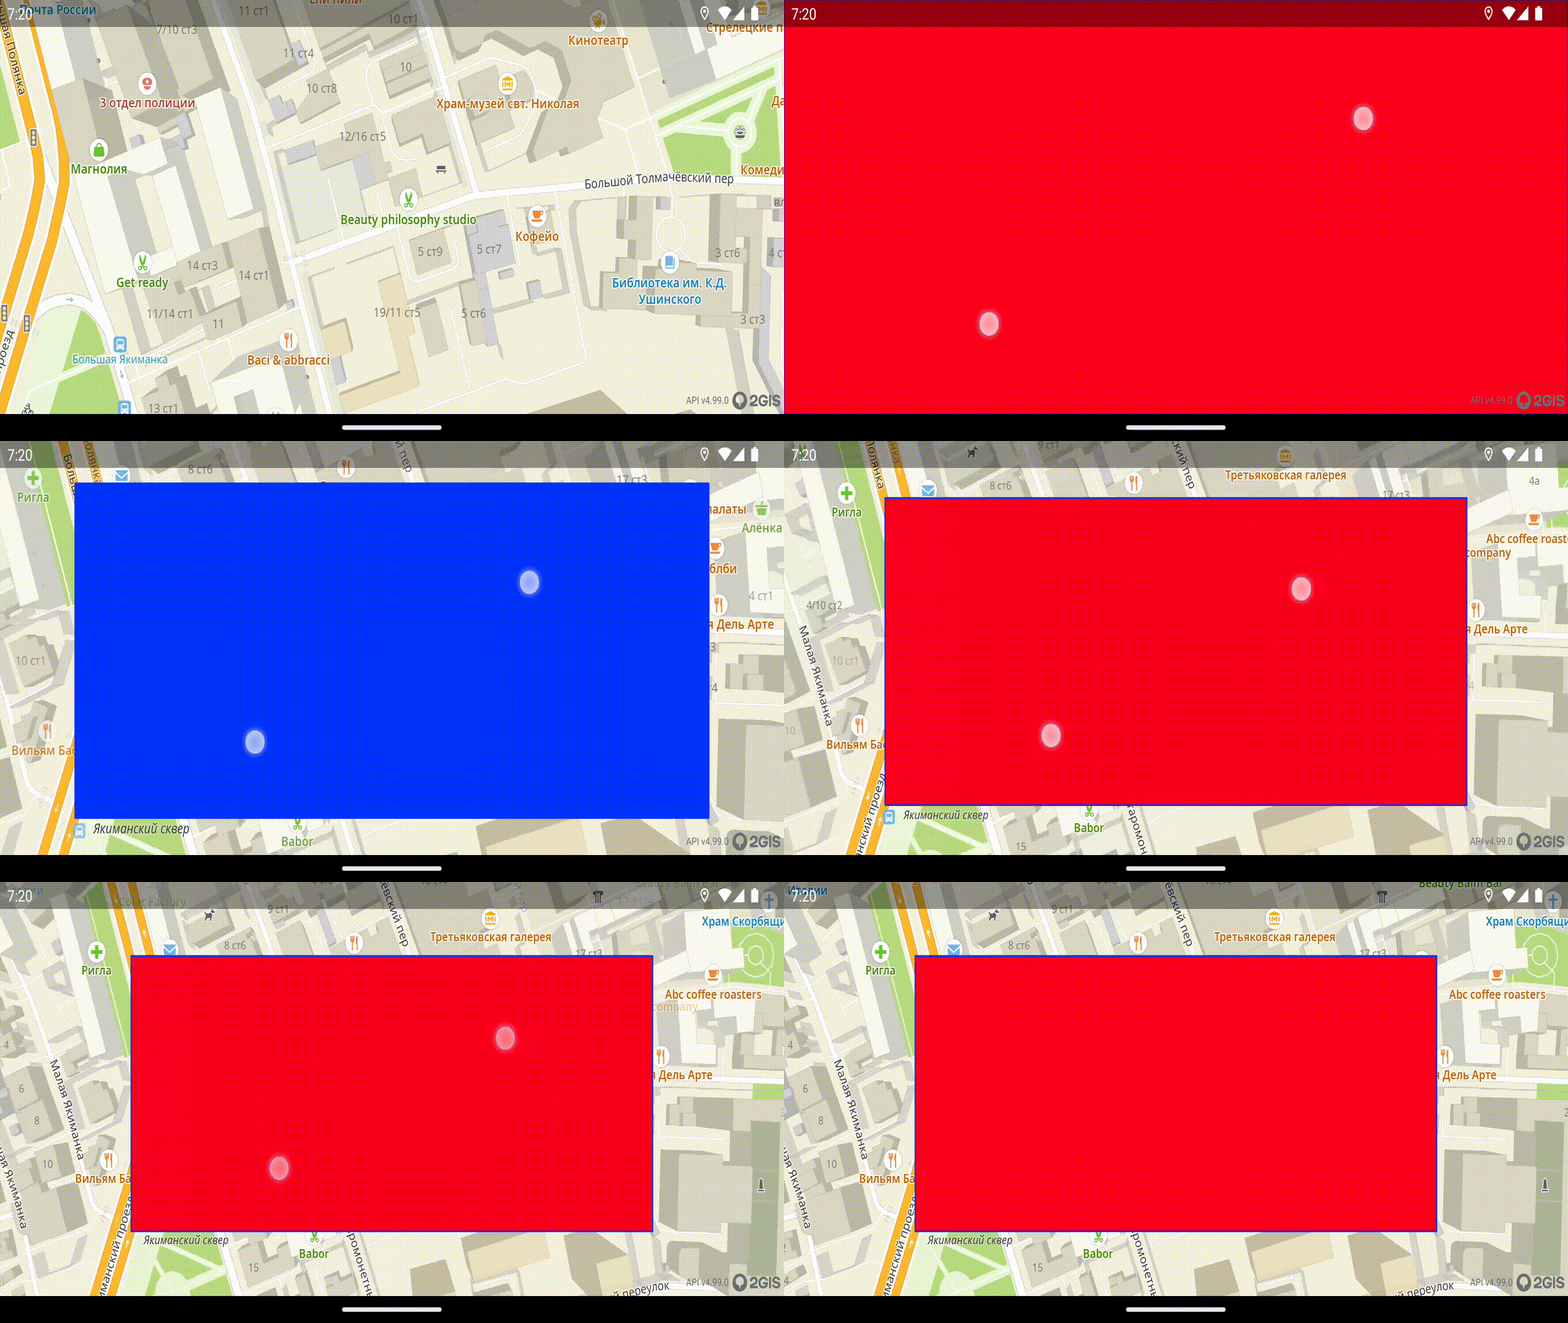
Detecting whether an object falls within the camera coverage area
Using the visibleArea property, you can obtain the map area covered by the camera as Geometry. Using the intersects() method, you can get the intersection of the camera coverage area with the required geometry:
map.camera.visibleArea.intersects(geometry);
Floor plans
With the SDK, you can display building floor plans on the map and switch between floors. Detailed floor plans are available only for certain groups of buildings (for example, shopping malls). To get started, obtain access to the Places API and additionally to floor plan information. See Getting started for details.
The main object for working with floor plans is the IndoorManager class, which is available through the map's indoorManager property.
Showing and hiding floor plans
To control the display of floor plans, use the setIndoorState() method of the IndoorManager class:
import { IndoorManagerState } from '@2gis/dgis-mobile-sdk-full';

// Show floor plans
map.indoorManager.setIndoorState(IndoorManagerState.Enabled);

// Hide floor plans
map.indoorManager.setIndoorState(IndoorManagerState.Disabled);
Switching between floors
To get information about the floor plans of the building currently displayed on the map, use the focusedBuilding property of the IndoorManager class or subscribe to the focusedBuildingChannel:
const connection = map.indoorManager.focusedBuildingChannel.subscribe(building => {
  if (building !== null) {
    console.log('Focused building:', building.id);
  }
});
To switch between floors, specify the required floor index in the activeLevelIndex property of the IndoorBuilding object:
map.indoorManager.focusedBuilding.activeLevelIndex = 2;
Creating a UI for floor control
To create a UI element for floor control, use the ready-made IndoorControl component:
import { IndoorControl } from '@2gis/dgis-mobile-sdk-full';

<IndoorControl map={map} showOverview />;
Highlighting floors
To highlight objects on floors, use DgisSource.setHighlighted().
Traffic jams on the map
To display the traffic jams layer on the map, create a TrafficSource data source and pass it to the map's addSource() method:
import { TrafficSource } from '@2gis/dgis-mobile-sdk-full';

const trafficSource = new TrafficSource(context);
map.addSource(trafficSource);
Road events on the map
You can configure the display of road events from 2GIS data on the map and add your own events.
Displaying events on the map
To display the road events layer on the map, create a RoadEventSource data source and add it to the map using the map's addSource() method:
import { RoadEventSource } from '@2gis/dgis-mobile-sdk-full';

const roadEventSource = new RoadEventSource(context);
map.addSource(roadEventSource);
To remove the created data source and all associated objects, call the map's removeSource() method:
map.removeSource(roadEventSource);
Adding an event
You can add your own road event to the map, which will be visible to all 2GIS map users. You can place an event on the map only within a 2 km radius of your current location.
-
Create an instance of the RoadEventManager object manager.
-
Add an event of one of the types below (each type has its own icon on the map):
- Car accident. Call the createAccident() method and specify the event coordinates (GeoPoint), affected lanes (Lane), and a text description of the event.
- Traffic camera. Call the createCamera() method and specify the event coordinates (GeoPoint) and a text description.
- Road closure. Call the createRoadRestriction() method and specify the event coordinates (GeoPoint) and a text description.
- Roadworks. Call the createRoadWorks() method and specify the event coordinates (GeoPoint), affected lanes (Lane), and a text description of the event.
- Comment. Call the createComment() method and specify the event coordinates (GeoPoint) and a text description.
- Other event. Call the createOther() method and specify the event coordinates (GeoPoint), affected lanes (Lane), and a text description of the event.
Example of adding roadworks:
import { EnumSet, Lane, RoadEventManager } from '@2gis/dgis-mobile-sdk-full';

const roadEventManager = RoadEventManager.instance(context);
const future = roadEventManager.createRoadWorks(
  point(55.7522, 37.6156),
  EnumSet.of(Lane),
  'Roadworks',
);

future.onComplete(
  result => {
    console.log('Road event created:', result);
    future.destroy();
  },
  error => {
    console.warn(error);
  },
);
Getting objects using screen coordinates
You can get information about map objects using pixel coordinates. To do this, call the map's getRenderedObjects() method and specify the pixel coordinates and the radius in screen millimeters (no more than 30). The method returns a deferred result containing information about all objects found within the specified radius in the visible map area (a List<RenderedObjectInfo> list).
import { ScreenDistance, ScreenPoint } from '@2gis/dgis-mobile-sdk-full';

const future = map.getRenderedObjects(
  new ScreenPoint({ x: 120, y: 240 }),
  new ScreenDistance({ value: 12 }),
);

future.onComplete(
  objects => {
    console.log(objects[0]?.closestMapPoint);
    future.destroy();
  },
  error => {
    console.warn(error);
  },
);
Working with map control gestures
You can customize map control gestures through MapController.gestureRecognizer.
The following gestures can be used to control the map by default:
- Panning the map in any direction with one finger.
- Panning the map in any direction with multiple fingers.
- Rotating the map with two fingers.
- Scaling the map with two fingers (pinch gesture).
- Zooming in with a double tap.
- Zooming out with a two-finger tap.
- Scaling the map with a tap-tap-swipe gesture using one finger.
- Tilting the camera by swiping up or down with two fingers.
All gestures are enabled by default. You can disable individual gestures using GestureManager if necessary.
const tapConnection = controller.gestureRecognizer.tap.subscribe(point => {
  console.log('Tap:', point.x, point.y);
});

const longTouchConnection = controller.gestureRecognizer.longTouch.subscribe(point => {
  console.log('Long touch:', point.x, point.y);
});
The following methods are available for gestures:
enableGesture()- enables a gesture.disableGesture()- disables a gesture.gestureEnabled()- checks whether a gesture is enabled or disabled.
import { TransformGesture } from '@2gis/dgis-mobile-sdk-full';

const gestureManager = controller.gestureRecognizer.gestureManager;

gestureManager?.disableGesture(TransformGesture.Rotation);
gestureManager?.enableGesture(TransformGesture.Scaling);
To change settings or get information about several gestures at once, use the enabledGestures property directly.
Some gestures have their own settings:
- MultiTouchRecognizeSettings for panning with multiple fingers.
- RotationRecognizeSettings for rotation.
- ScalingRecognizeSettings for scaling.
- TiltRecognizeSettings for tilting.
See the corresponding documentation pages for details about these settings. The settings objects are available through GestureManager properties.