GeoJSON
Для показа GeoJSON данных на карте нужно:
- подключить источник этих данных в карту;
- добавить слой в стиль карты, который объяснит, как рисовать эти данные.
Подключение источника данных
Возьмем простейший пример данных в формате GeoJSON:
const data = {
    type: 'FeatureCollection',
    features: [
        {
            type: 'Feature',
            properties: {},
            geometry: {
                type: 'Polygon',
                coordinates: [
                    [
                        [55.41, 25.34],
                        [55.44, 25.34],
                        [55.43, 25.37],
                        [55.41, 25.34],
                    ],
                ],
            },
        },
    ],
};
Для их подключения в качестве источника данных карты нужно использовать класс GeoJsonSource:
const source = new mapgl.GeoJsonSource(map, {
    data,
});
Так мы добавили полигон только в данные карты. Однако, отрисовать этот полигон не получится, поскольку его нельзя связать с конкретным слоем стиля карты. Полигон добавился в общий массив данных карты, а там его невозможно отличить от других полигонов.
Чтобы полигон отличался от других, можно добавить ему уникальное свойство в properties:
const data = {
    type: 'FeatureCollection',
    features: [
        {
            type: 'Feature',
            properties: {
                foo: 'qwe', // Уникальное свойство
            },
            geometry: {
                type: 'Polygon',
                coordinates: [
                    [
                        [55.41, 25.34],
                        [55.44, 25.34],
                        [55.43, 25.37],
                        [55.41, 25.34],
                    ],
                ],
            },
        },
    ],
};
Либо добавить уникальное свойство всему источнику данных через поле attributes:
const source = new mapgl.GeoJsonSource(map, {
    data,
    attributes: {
        bar: 'asd', // Уникальное свойство
    },
});
Теперь такой полигон можно связать с новым слоем стилем карты, а значит и отрисовать.
Добавление слоя в стиль карты
Стиль карты — это конфиг, который описывает как рисовать данные карты. Стиль состоит из слоев. Каждый слой содержит:
- в поле
filter— логику фильтрации данных карты для определения, какие именно данные будут рисоваться этим слоем; - в поле
style— описание внешнего вида объектов отрисовки (цвет, ширина, шрифт и пр.).
Подробнее про стиль карты можно узнать в Спецификации стиля.
Добавление через API
Выше мы добавили полигон в качестве источника данных карты, теперь его нужно связать с новым слоем стиля.
Для начала создадим новый слой:
const layer = {
    id: 'my-polygons-layer', // ID каждого слоя должен быть уникальным

    // Логика фильтрации или выбора данных для этого слоя
    filter: [
        'match',
        ['sourceAttr', 'bar'],
        ['asd'],
        true, // Значение при совпадении атрибута bar источника cо значением "asd"
        false, // Значение при несовпадении
    ],

    // Тип объекта отрисовки
    type: 'polygon',

    // Стиль объекта отрисовки
    style: {
        color: '#0000ff',
    },
};
Здесь в filter используются:
SourceAttrExpression— для получения значений из свойстваbarисточника данных;MatchExpression— для сопоставления полученного свойства из атрибутаbarсо строковым значением"asd".
Если при добавлении данных был выбран вариант не со свойством источника данных, а с добавление свойства только одному объекту GeoJSON в properties, то вместо SourceAttrExpression нужно использовать GetExpression.
В конце созданный слой нужно добавить в стиль карты с помощью map.addLayer(layer), и карта перерисуется уже вместе с новым полигоном:
<!DOCTYPE html>
<html lang="en">
    <head>
        <meta charset="UTF-8" />
        <meta name="viewport" content="width=device-width, initial-scale=1.0" />
        <title>2GIS Map API</title>
        <meta name="description" content="GeoJSON polygon example" />
        <style>
            html,
            body,
            #container {
                margin: 0;
                width: 100%;
                height: 100%;
                overflow: hidden;
            }
        </style>
    </head>
    <body>
        <div id="container"></div>
        <script src="https://mapgl.2gis.com/api/js/v1"></script>
        <script>
            const map = new mapgl.Map('container', {
                center: [55.425, 25.355],
                zoom: 13,
                key: 'Your API access key',
            });

            const data = {
                type: 'FeatureCollection',
                features: [
                    {
                        type: 'Feature',
                        properties: {},
                        geometry: {
                            type: 'Polygon',
                            coordinates: [
                                [
                                    [55.41, 25.34],
                                    [55.44, 25.34],
                                    [55.43, 25.37],
                                    [55.41, 25.34],
                                ],
                            ],
                        },
                    },
                ],
            };

            const source = new mapgl.GeoJsonSource(map, {
                data,
                attributes: {
                    bar: 'asd',
                },
            });

            const layer = {
                id: 'my-polygons-layer', // Each layer ID must be unique

                // Data filtering logic
                filter: [
                    'match',
                    ['sourceAttr', 'bar'],
                    ['asd'],
                    true, // Result if value of bar source attribute equals "asd"
                    false, // Result if not
                ],

                // Drawing object type
                type: 'polygon',

                // Style of drawing object
                style: {
                    color: '#0000ff',
                },
            };

            map.on('styleload', () => {
                map.addLayer(layer);
            });
        </script>
    </body>
</html>
Добавление после загрузки стиля
Сразу после создания карты её стиль будет пустым, до тех пор пока он не загрузится с сервера. Важно дождаться его загрузки, прежде чем добавлять новый слой, поскольку загруженный стиль полностью затрет старый. Для этого в примере выше используется событие styleload, которое всплывает каждый раз после установки нового стиля:
map.on('styleload', () => {
    map.addLayer(layer);
});
Если вы меняете стиль карты с помощью метода map.setStyleById(), то вместо события вы также можете использовать Promise, который возвращает метод:
map.setStyleById('e05ac437-fcc2-4845-ad74-b1de9ce07555').then(() => {
    map.addLayer(layer);
});
Добавление перед другим слоем
Слои стиля упорядочены относительно друг друга. Порядок слоев определяет то, в какой последовательности они будут рисоваться на карте.
По умолчанию метод map.addLayer(layer) добавляет слой в конец списка, т.е. новый слой будет рисоваться последним. Если нужно добавить новый слой не в конец, а перед другим слоем, то нужно в методе указать вторым параметром ID другого слоя:
map.addLayer(anotherLayer, 'my-polygons-layer');
Вставить новый слой можно также перед слоями, которые настраиваются в Редакторе стилей:
map.addLayer(layer, '577315');
<!DOCTYPE html>
<html lang="en">
    <head>
        <meta charset="UTF-8" />
        <meta name="viewport" content="width=device-width, initial-scale=1.0" />
        <title>2GIS Map API</title>
        <meta name="description" content="GeoJSON polygon under roads example" />
        <style>
            html,
            body,
            #container {
                margin: 0;
                width: 100%;
                height: 100%;
                overflow: hidden;
            }
        </style>
    </head>
    <body>
        <div id="container"></div>
        <script src="https://mapgl.2gis.com/api/js/v1"></script>
        <script>
            const map = new mapgl.Map('container', {
                center: [55.425, 25.355],
                zoom: 13,
                key: 'Your API access key',
            });

            const data = {
                type: 'FeatureCollection',
                features: [
                    {
                        type: 'Feature',
                        properties: {},
                        geometry: {
                            type: 'Polygon',
                            coordinates: [
                                [
                                    [55.41, 25.34],
                                    [55.44, 25.34],
                                    [55.43, 25.37],
                                    [55.41, 25.34],
                                ],
                            ],
                        },
                    },
                ],
            };

            const source = new mapgl.GeoJsonSource(map, {
                data,
                attributes: {
                    bar: 'asd',
                },
            });

            const layer = {
                id: 'my-polygons-layer', // Each layer ID must be unique

                // Data filtering logic
                filter: [
                    'match',
                    ['sourceAttr', 'bar'],
                    ['asd'],
                    true, // Result if value of bar source attribute equals "asd"
                    false, // Result if not
                ],

                // Drawing object type
                type: 'polygon',

                // Style of drawing object
                style: {
                    color: '#0000ff',
                },
            };

            map.on('styleload', () => {
                map.addLayer(layer, '577315');
            });
        </script>
    </body>
</html>
Добавление через редактор стилей
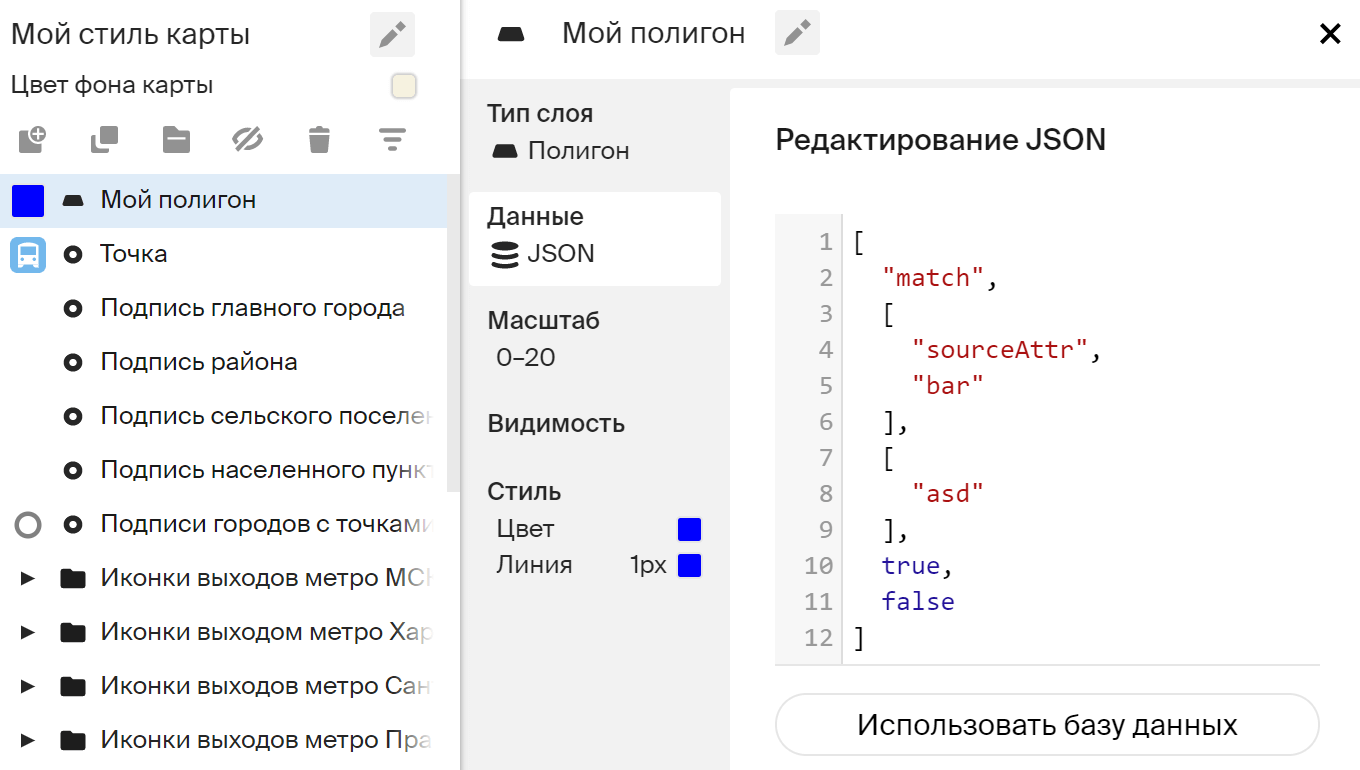
Для отображения источника данных необязательно добавлять слой через API, можно также добавить его в Редакторе стилей в свой стиль карты.
Для этого там при создании нового слоя на этапе выбора данных нужно нажать на кнопку JSON — добавить вручную и добавить MatchExpression, который нужно было бы указать в filter при добавлении слоя через API:
События
Чтобы подписаться на клик по объекту GeoJSON или на другие события MapEventTable, надо использовать метод on() у карты. Для объектов GeoJSON в событиях в поле targetData приходит специальный тип GeoJsonEventTargetData, который содержит все исходные данные объекта.
<!DOCTYPE html>
<html lang="en">

<head>
    <meta charset="UTF-8" />
    <meta name="viewport" content="width=device-width, initial-scale=1.0" />
    <title>2GIS Map API</title>
    <meta name="description" content="GeoJSON events example" />
    <style>
        html,
        body,
        #container {
            margin: 0;
            width: 100%;
            height: 100%;
            overflow: hidden;
        }
    </style>
</head>

<body>
    <div id="container"></div>
    <script src="https://mapgl.2gis.com/api/js/v1"></script>
    <script>
        const map = new mapgl.Map('container', {
            center: [55.4218, 25.3357],
            zoom: 17,
            pitch: 45,
            key: 'Your API access key',
        });

        const data = {
            type: 'FeatureCollection',
            features: [
                {
                    type: 'Feature',
                    properties: {
                        type: 'star',
                        name: 'geoJson Polygon - star-polygon A'
                    },
                    geometry: {
                        type: 'Polygon',
                        coordinates: [
                            [
                                [55.422656536102316, 25.335250625051458],
                                [55.42331099510195, 25.335570623342118],
                                [55.42392253875736, 25.33520214038817],
                                [55.423622131347685, 25.335774258177413],
                                [55.42422294616701, 25.336074861355655],
                                [55.423579216003446, 25.33610395194616],
                                [55.42338609695437, 25.336666368655063],
                                [55.42309641838077, 25.336123345669286],
                                [55.422409772872946, 25.33614273938931],
                                [55.42298913002018, 25.33580334884018],
                                [55.422656536102316, 25.335250625051458],
                            ],
                        ],
                    },
                },
                {
                    type: 'Feature',
                    properties: {
                        type: 'star',
                        name: 'geoJson Polygon - star-polygon B'
                    },
                    geometry: {
                        type: 'Polygon',
                        coordinates: [
                            [
                                [55.419437885284445, 25.334988807638815],
                                [55.42009234428408, 25.335308806621768],
                                [55.42070388793948, 25.334940322870644],
                                [55.420403480529814, 25.33551244189763],
                                [55.42100429534914, 25.335813045726233],
                                [55.42036056518557, 25.33584213637969],
                                [55.420167446136496, 25.336404554305396],
                                [55.419877767562895, 25.335861530144776],
                                [55.419191122055075, 25.335880923906757],
                                [55.419770479202306, 25.33554153262335],
                                [55.419437885284445, 25.334988807638815],
                            ],
                        ],
                    },
                },

                {
                    type: 'Feature',
                    properties: {
                        type: 'marker',
                        label: 'Star A',
                        color: 'blue',
                        name: 'geoJson Point - star-marker A'
                    },
                    geometry: {
                        type: 'Point',
                        coordinates: [55.42332172393799, 25.33587122702617],
                    },
                },
                {
                    type: 'Feature',
                    properties: {
                        type: 'marker',
                        label: 'Star B',
                        color: 'blue',
                        name: 'geoJson Point - star-marker B'
                    },
                    geometry: {
                        type: 'Point',
                        coordinates: [55.420124530792236, 25.335590017150714],
                    },
                },

            ],
        };

        const source = new mapgl.GeoJsonSource(map, {
            data,
            attributes: {
                bar: 'asd',
            },
        });

        map.on('styleload', () => {
            map.addLayer(
                {
                    type: 'polygon',
                    id: 'my-stars',
                    filter: [
                        'all',
                        ['match', ['sourceAttr', 'bar'], ['asd'], true, false],
                        ['match', ['get', 'type'], ['star'], true, false],
                    ],
                    style: {
                        color: '#fcc9ff',
                    },
                },
            );


            map.addLayer({
                type: 'point',
                id: 'my-marker',
                filter: [
                    'all',
                    ['match', ['sourceAttr', 'bar'], ['asd'], true, false],
                    ['match', ['get', 'type'], ['marker'], true, false],
                ],
                style: {
                    iconImage: ['match', ['get', 'color'], ['blue'], 'ent_i', 'ent'],
                    iconWidth: 25,
                    textField: ['get', 'label'],
                    textFont: ['Noto_Sans'],
                    textColor: '#0098ea',
                    textHaloColor: '#fff',
                    textHaloWidth: 1,
                    iconPriority: 100,
                    textPriority: 100,
                },
            });
        });
        map.on('click', (e) => { if (e.targetData.type === 'geojson') { alert('GeoJsonFeature clicked: ' + e.targetData.feature.properties.name) } })
    </script>
</body>

</html>
Комплексный пример
Ниже представлен сложный пример использования GeoJSON, в нем одновременно:
- подключаются разные типы данных GeoJSON (
Point,Polygon,LineString); - показываются разные объекты отрисовки (
line,dashedLine,point,polygon); - используются составные выражения в
filter; - используются выражения внутри стилевых свойств.
<!DOCTYPE html>
<html lang="en">
<head>
<meta charset="UTF-8" />
<meta name="viewport" content="width=device-width, initial-scale=1.0" />
<title>2GIS Map API</title>
<meta name="description" content="GeoJSON complex example" />
<style>
html,
body,
#container {
margin: 0;
width: 100%;
height: 100%;
overflow: hidden;
}
</style>
</head>
<body>
<div id="container"></div>
<script src="https://mapgl.2gis.com/api/js/v1"></script>
<script>
const map = new mapgl.Map('container', {
center: [55.4218, 25.3357],
zoom: 17,
pitch: 45,
key: 'Your API access key',
});
const data = {
type: 'FeatureCollection',
features: [
{
type: 'Feature',
properties: {
type: 'topLine',
},
geometry: {
type: 'LineString',
coordinates: [
[55.41612267494202, 25.3373063569028],
[55.418890714645386, 25.33572577372391],
[55.41969537734985, 25.336870001646474],
[55.42081117630005, 25.33621061738493],
[55.421626567840576, 25.337393627765234],
[55.42233467102051, 25.336966969617198],
[55.42382597923279, 25.339100245313542],
],
},
},
{
type: 'Feature',
properties: {
type: 'star',
},
geometry: {
type: 'Polygon',
coordinates: [
[
[55.422656536102316, 25.335250625051458],
[55.42331099510195, 25.335570623342118],
[55.42392253875736, 25.33520214038817],
[55.423622131347685, 25.335774258177413],
[55.42422294616701, 25.336074861355655],
[55.423579216003446, 25.33610395194616],
[55.42338609695437, 25.336666368655063],
[55.42309641838077, 25.336123345669286],
[55.422409772872946, 25.33614273938931],
[55.42298913002018, 25.33580334884018],
[55.422656536102316, 25.335250625051458],
],
],
},
},
{
type: 'Feature',
properties: {
type: 'star',
},
geometry: {
type: 'Polygon',
coordinates: [
[
[55.419437885284445, 25.334988807638815],
[55.42009234428408, 25.335308806621768],
[55.42070388793948, 25.334940322870644],
[55.420403480529814, 25.33551244189763],
[55.42100429534914, 25.335813045726233],
[55.42036056518557, 25.33584213637969],
[55.420167446136496, 25.336404554305396],
[55.419877767562895, 25.335861530144776],
[55.419191122055075, 25.335880923906757],
[55.419770479202306, 25.33554153262335],
[55.419437885284445, 25.334988807638815],
],
],
},
},
{
type: 'Feature',
properties: {
type: 'bottomLine',
},
geometry: {
type: 'LineString',
coordinates: [
[55.42360067367554, 25.33460092894936],
[55.42147636413574, 25.335803348840205],
[55.42107939720153, 25.335231231188487],
[55.42302131652832, 25.334077290746556],
],
},
},
{
type: 'Feature',
properties: {
type: 'marker',
label: 'Star #2',
color: 'blue',
},
geometry: {
type: 'Point',
coordinates: [55.42332172393799, 25.33587122702617],
},
},
{
type: 'Feature',
properties: {
type: 'marker',
label: 'Star #1',
color: 'blue',
},
geometry: {
type: 'Point',
coordinates: [55.420124530792236, 25.335590017150714],
},
},
{
type: 'Feature',
properties: {
type: 'marker',
color: 'gray',
},
geometry: {
type: 'Point',
coordinates: [55.4215407371521, 25.336588794091984],
},
},
{
type: 'Feature',
properties: {
type: 'marker',
color: 'gray',
},
geometry: {
type: 'Point',
coordinates: [55.42234539985657, 25.33490153504211],
},
},
],
};
const source = new mapgl.GeoJsonSource(map, {
data,
attributes: {
bar: 'asd',
},
});
map.on('styleload', () => {
map.addLayer(
{
type: 'polygon',
id: 'my-stars',
filter: [
'all',
['match', ['sourceAttr', 'bar'], ['asd'], true, false],
['match', ['get', 'type'], ['star'], true, false],
],
style: {
color: '#fcc9ff',
},
},
'31871',
);
map.addLayer(
{
type: 'dashedLine',
id: 'my-dashedline',
filter: [
'all',
['match', ['sourceAttr', 'bar'], ['asd'], true, false],
['match', ['get', 'type'], ['topLine'], true, false],
],
style: {
color: '#0baf08',
width: 10,
dashLength: 10,
gapLength: 5,
},
},
'595890',
);
map.addLayer(
{
type: 'line',
id: 'my-line',
filter: [
'all',
['match', ['sourceAttr', 'bar'], ['asd'], true, false],
['match', ['get', 'type'], ['bottomLine'], true, false],
],
style: {
color: '#ffcd17',
width: 7,
},
},
'595890',
);
map.addLayer({
type: 'point',
id: 'my-marker',
filter: [
'all',
['match', ['sourceAttr', 'bar'], ['asd'], true, false],
['match', ['get', 'type'], ['marker'], true, false],
],
style: {
iconImage: ['match', ['get', 'color'], ['blue'], 'ent_i', 'ent'],
iconWidth: 25,
textField: ['get', 'label'],
textFont: ['Noto_Sans'],
textColor: '#0098ea',
textHaloColor: '#fff',
textHaloWidth: 1,
iconPriority: 100,
textPriority: 100,
},
});
});
</script>
</body>
</html>