Layer types for the Mobile SDK
In the Style editor, you can use style layers with different types. Each layer type has its own set of settings and defines the appearance of selected groups of objects. Each type has different sets of map data available, and you can manage their style via a layer. For example, different classes of roads and streets are available for a layer with the Line type. Areas, blocks, buildings, and others are available for a layer with the Polygon type.
Layer types differ depending on the map style: for the Mobile SDK (see below) or MapGL JS API.
The base style for the Mobile SDK has more than 200 configured layers: see the list of layers. If you need to add objects to the map that are not available in the configured layers, you can create a layer with the required type from scratch. In other cases, it is recommended to configure existing layers.
Two groups of layers are available for the Mobile SDK: standard and dynamic. You can configure dynamic layers, but they are not displayed on the map in the Style editor.
Standard layer types:
- Polygon
- Line
- Raised polygon
- Point
- Line caption
- Stripe
- Line of arrows
- 3D model
- Building model
- Overpass
- Metric point
Dynamic layer types:
- Gradient line
- Displaced смещением
- Circle in the map plane
- Transparent polygon
- Dynamic arrow
- Bubble
- Directional model
- Raster layer
- Dynamic object
Standard layers
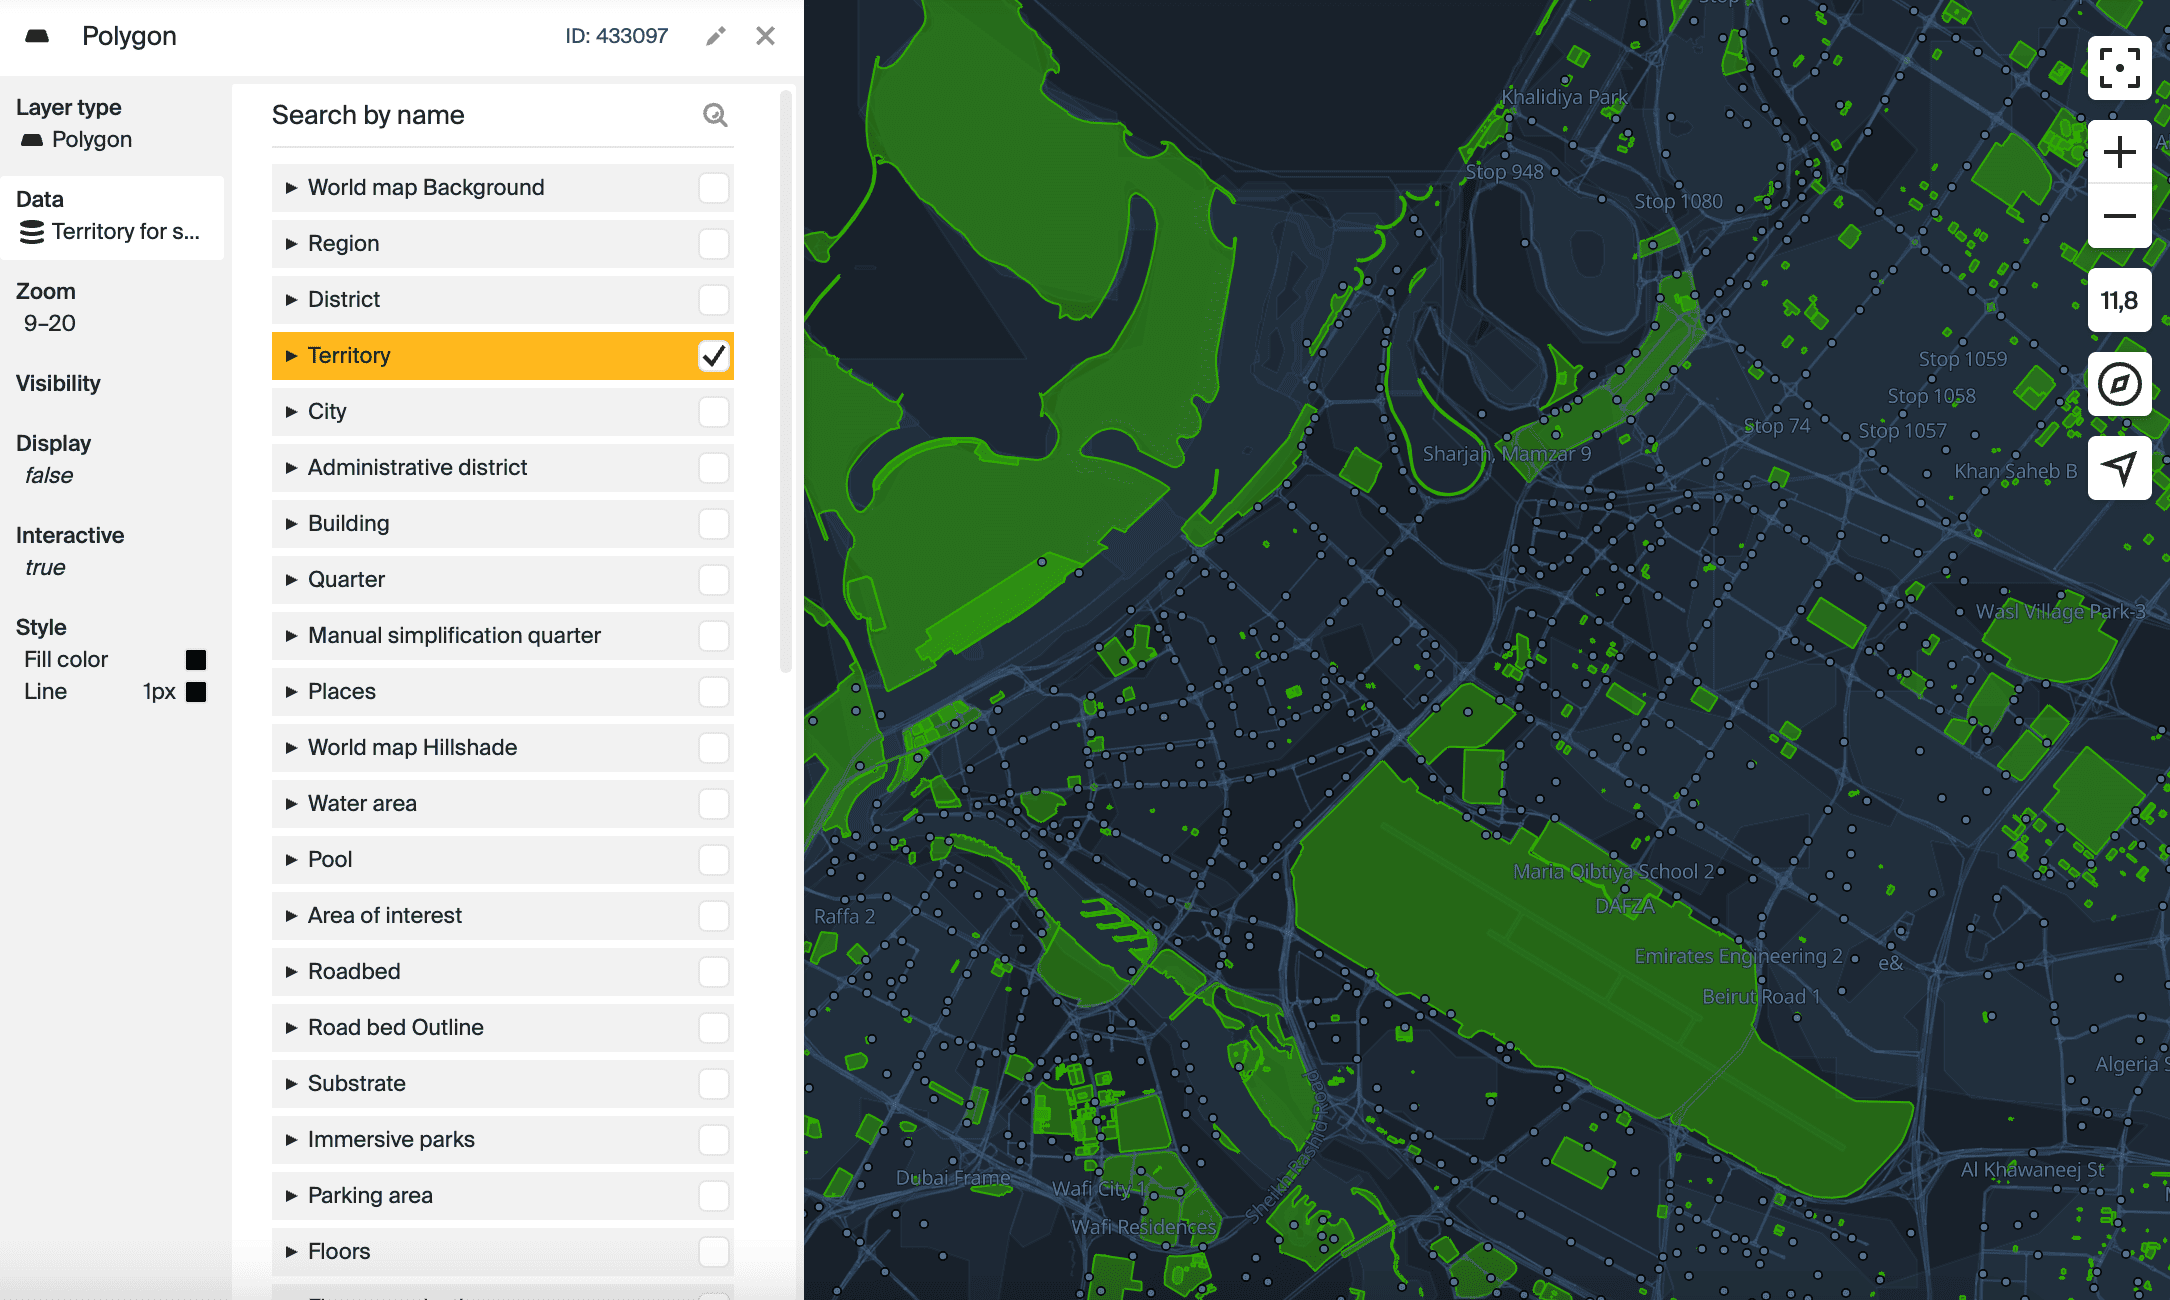
Polygon
Display on the map: a polygon with a color background and an outline.
What data it is used for:
- Water objects: rivers, lakes, seas, etc.
- Hillshade.
- Countries with borders.
- Forest on the world map.
- Quarters.
- Parking areas.
- And others.
Typical settings: fill color, stroke color, and stroke width.
Layer example:
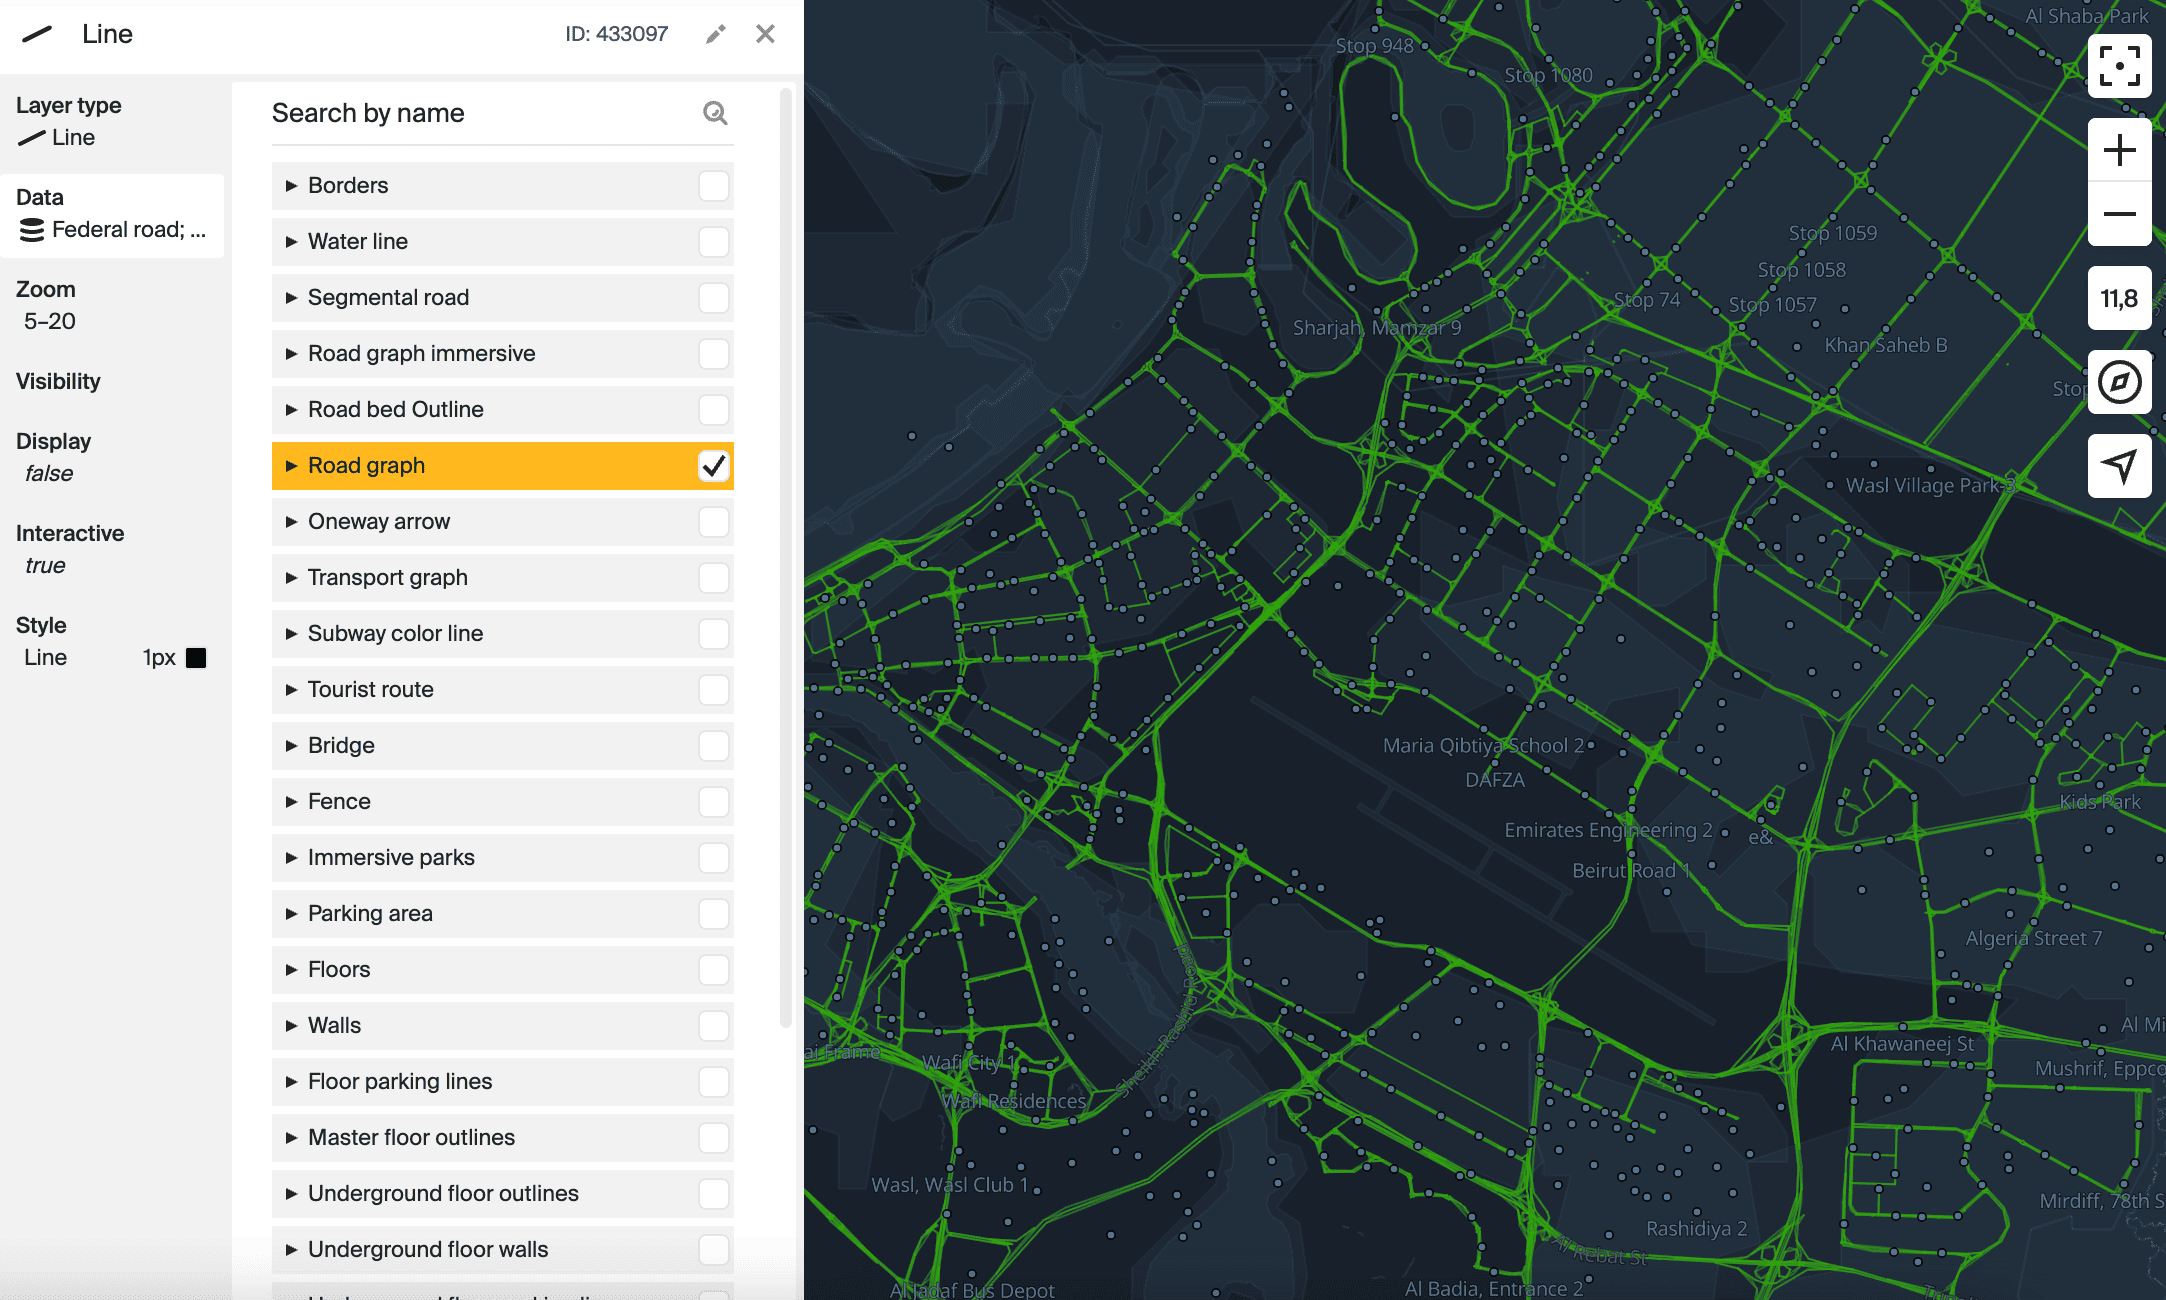
Line
Display on the map: wide line.
What data it is used for:
- Road graph: roads and streets of different classes and types, tunnels, etc.
- Transport graph: bus route lines, metro, etc.
- Bridges.
- Tourist routes.
- Borders of countries, regions, and districts.
- And others.
Typical settings: fill color, line width, and other parameters.
Layer example:
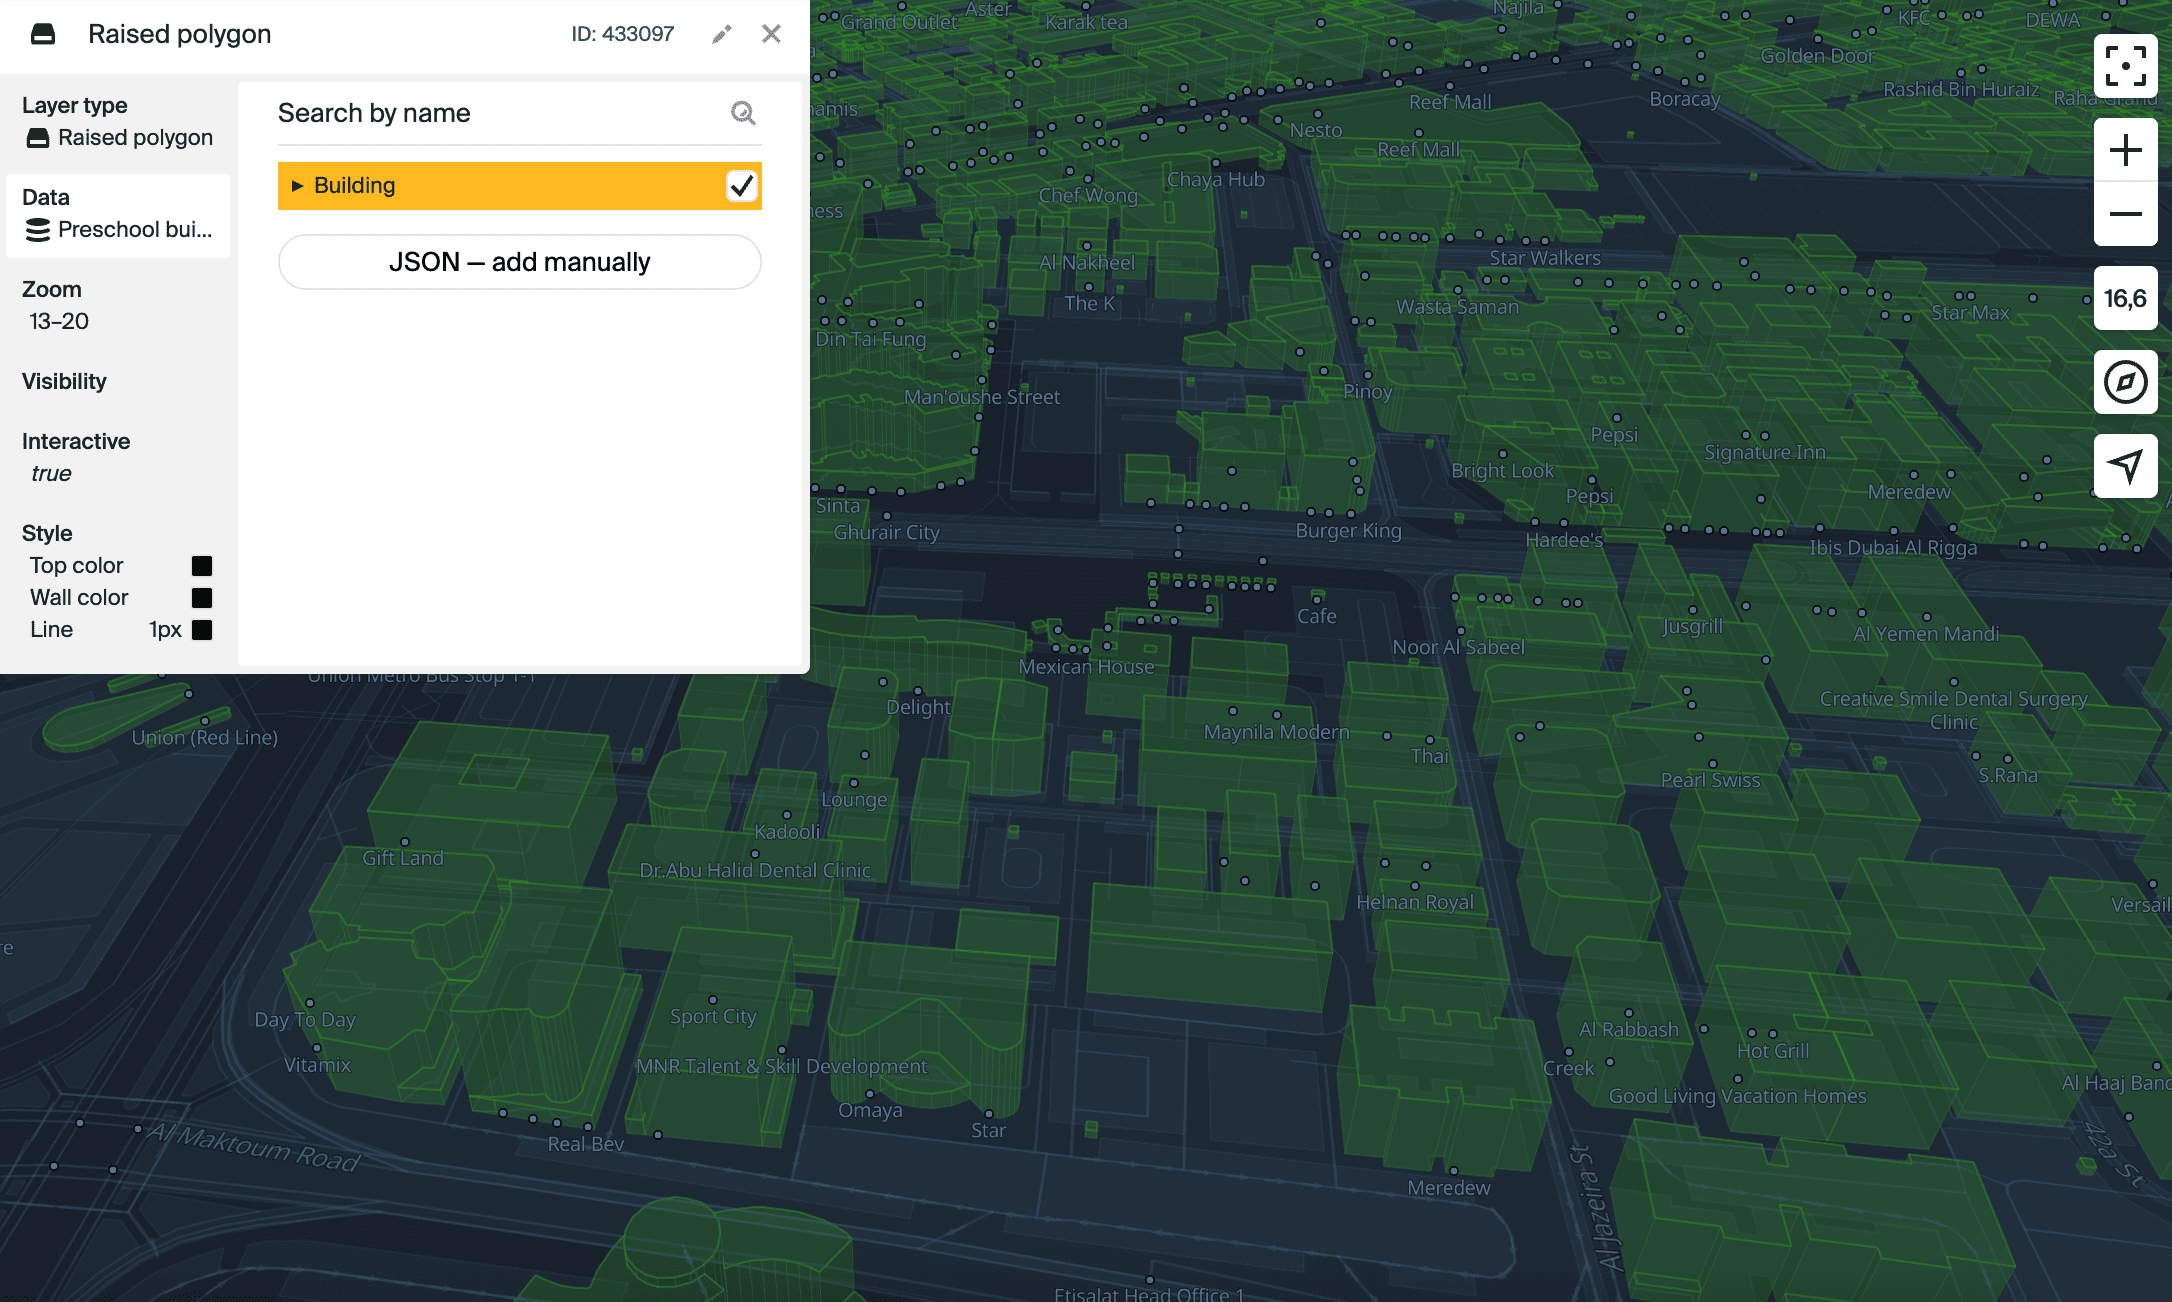
Raised polygon
Display on the map: polygon with a color background and an outline, extended upwards.
What data it is used for:
- Residential buildings.
- Administrative buildings.
- Schools.
- And others.
Typical settings: sides fill color, stroke color and width, and near camera fade.
Layer example:
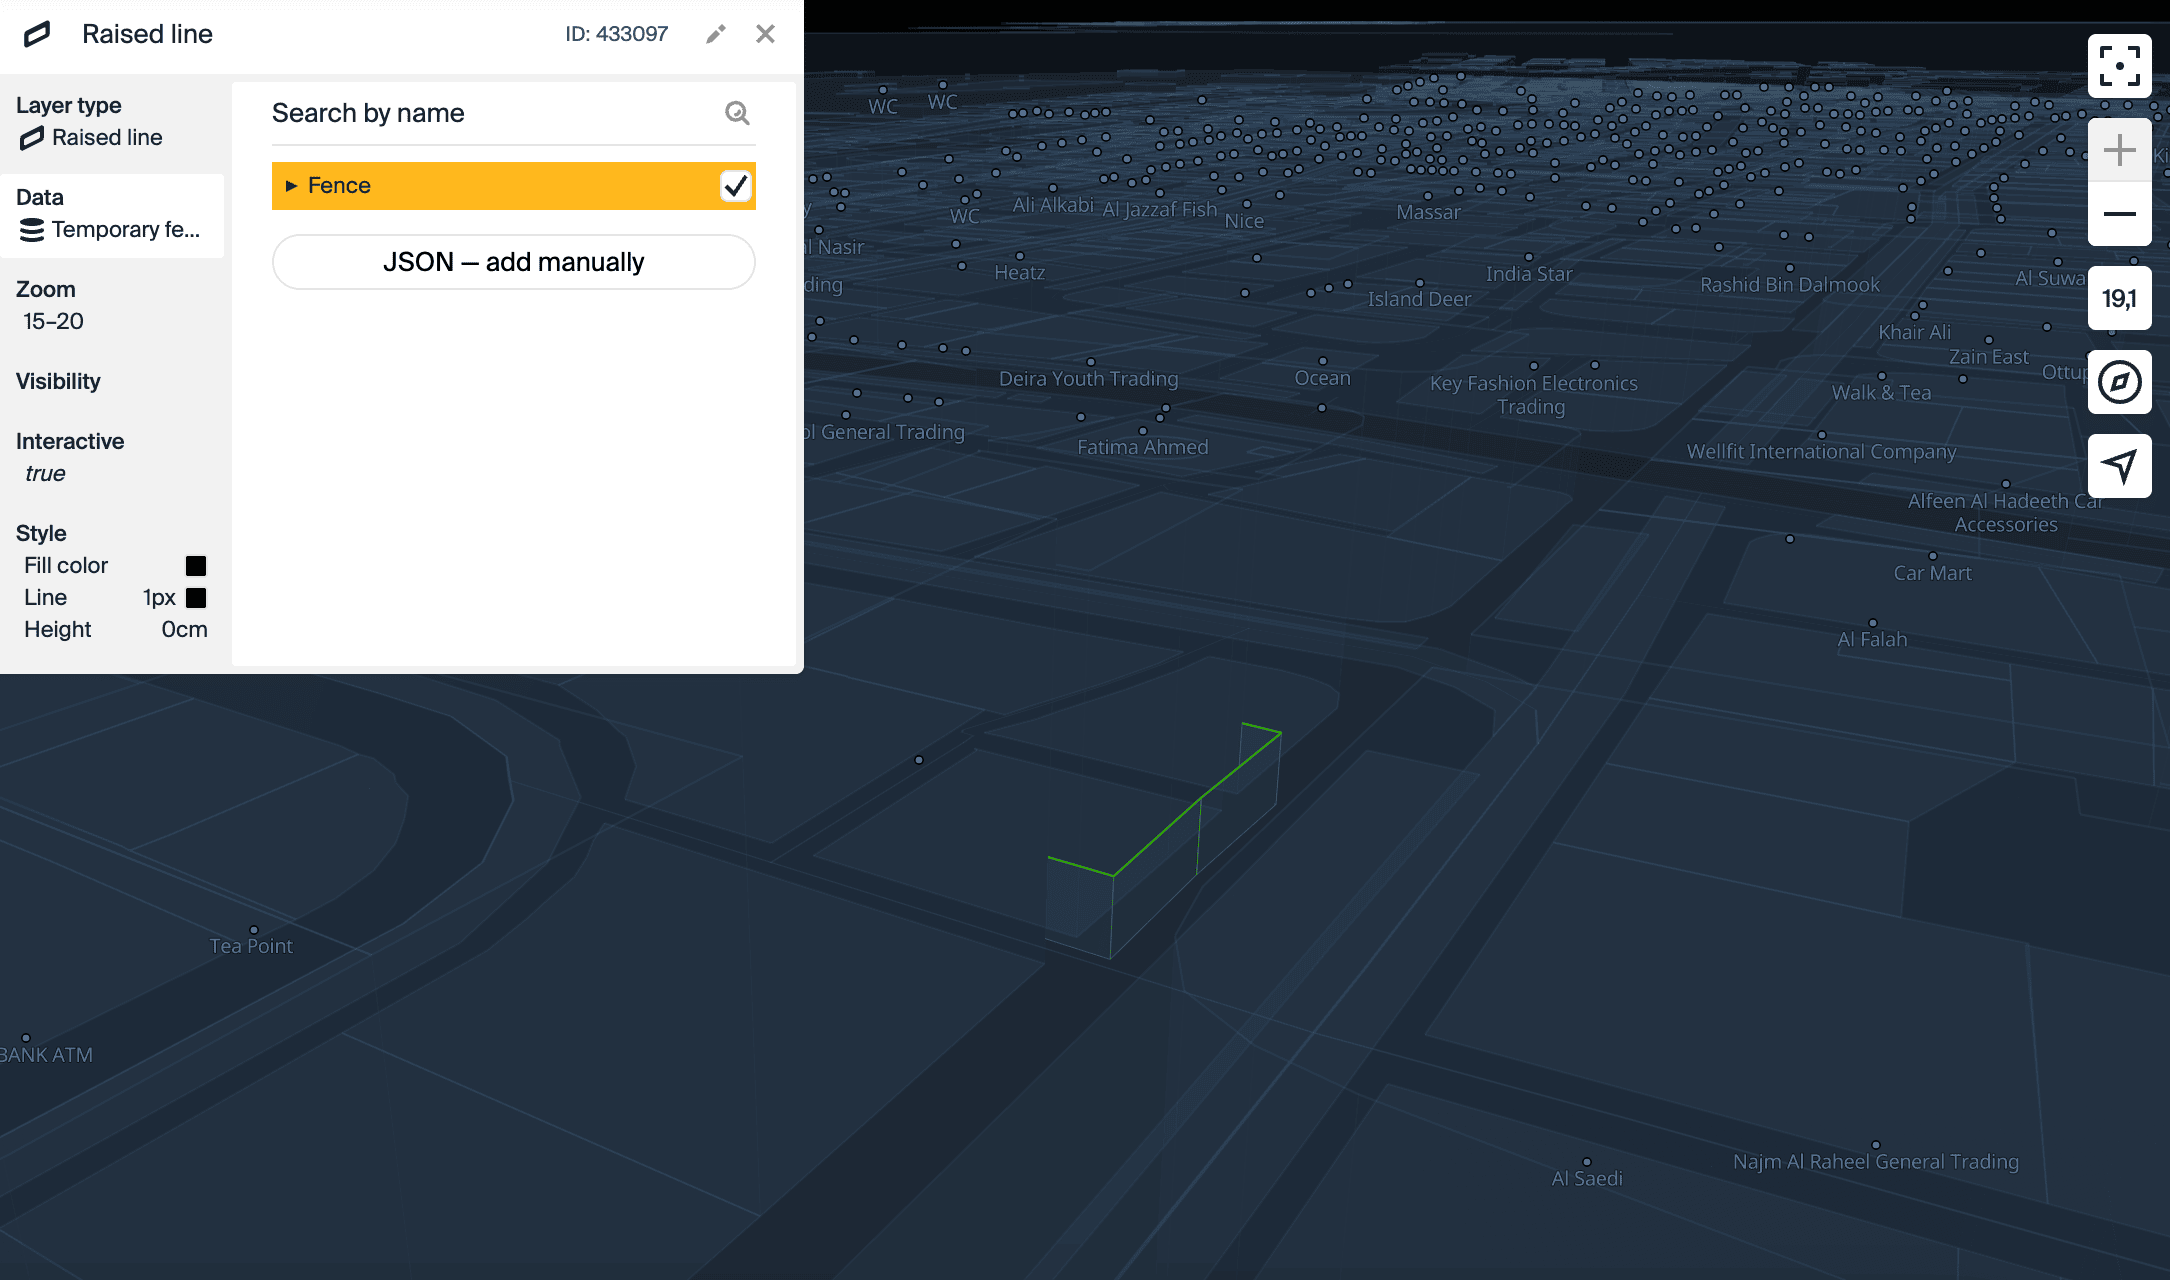
Raised line
Display on the map: line with a width and an outline, extended upwards.
What data it is used for: fences.
Typical settings: sides fill color, stroke color and width, object height, and near camera fade.
Layer example:
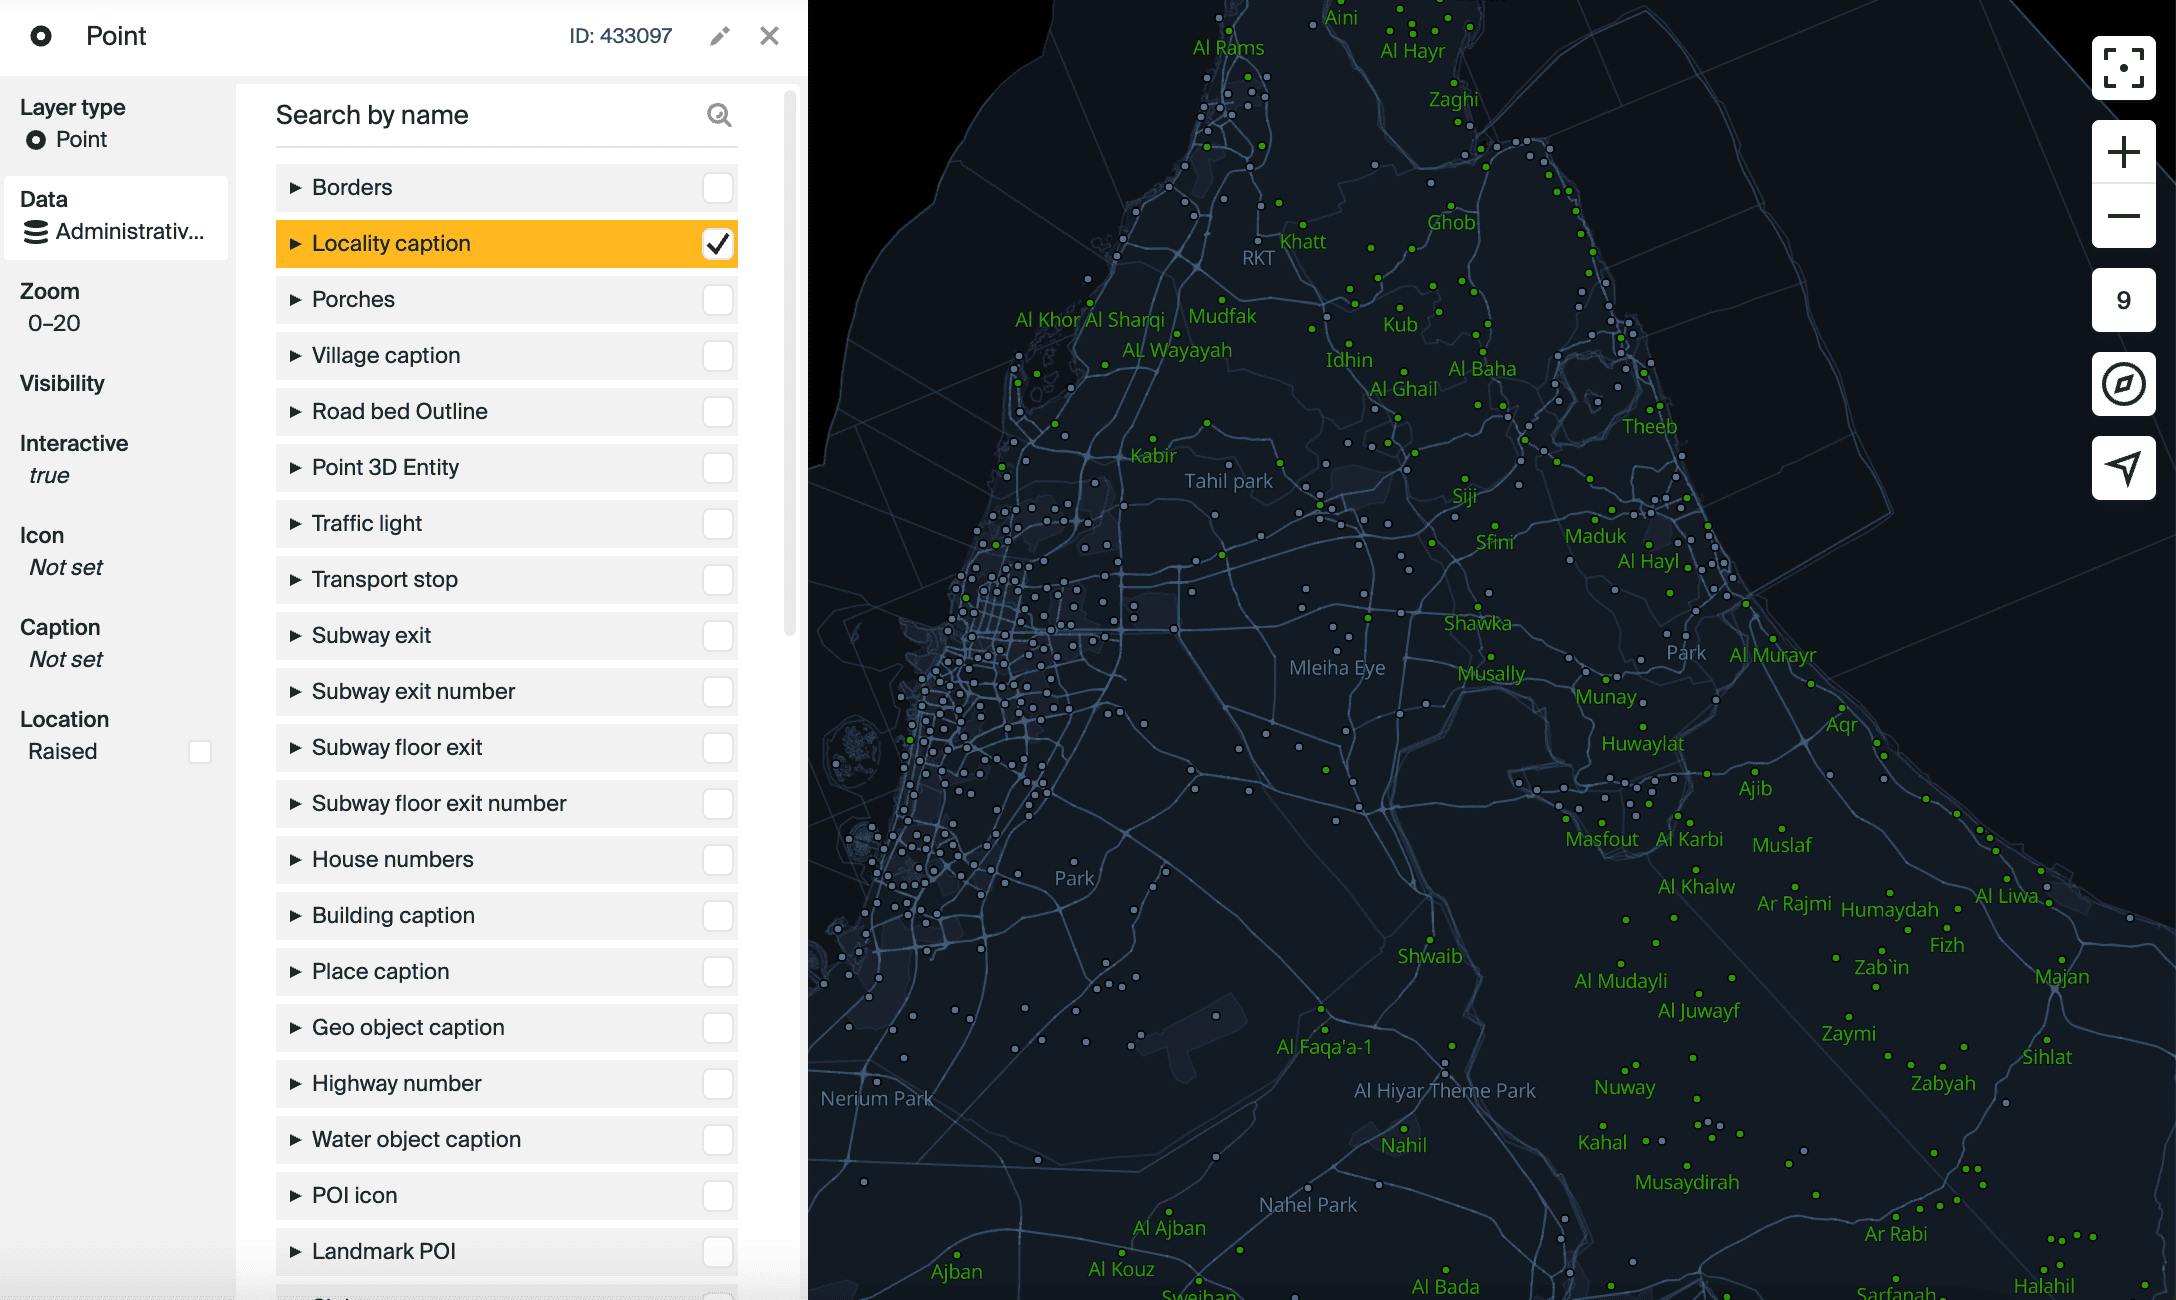
Point
Display on the map: icons of objects in default and selected states, and their captions; captions for 3D objects and geographic objects on the world map.
What data it is used for:
- Labels for countries, regions, settlements.
- Labels for bodies of water: lakes, seas, oceans.
- Labels for house and building numbers, entrances.
- Labels for public transport stops, metro stations, and exits.
- Point 3D objects: swings, slides, umbrellas, benches, etc.
- Traffic lights.
- Icons for public transport stops, metro stations, parking lots, firms, urban infrastructure facilities, etc.
- And others.
Typical settings: icon settings (icon, icon size, opacity, and others), caption settings (font, font size, caption color, letter spacing, and others), location settings (icon anchor point, caption positioning, space between text and icon, and others).
Layer example:
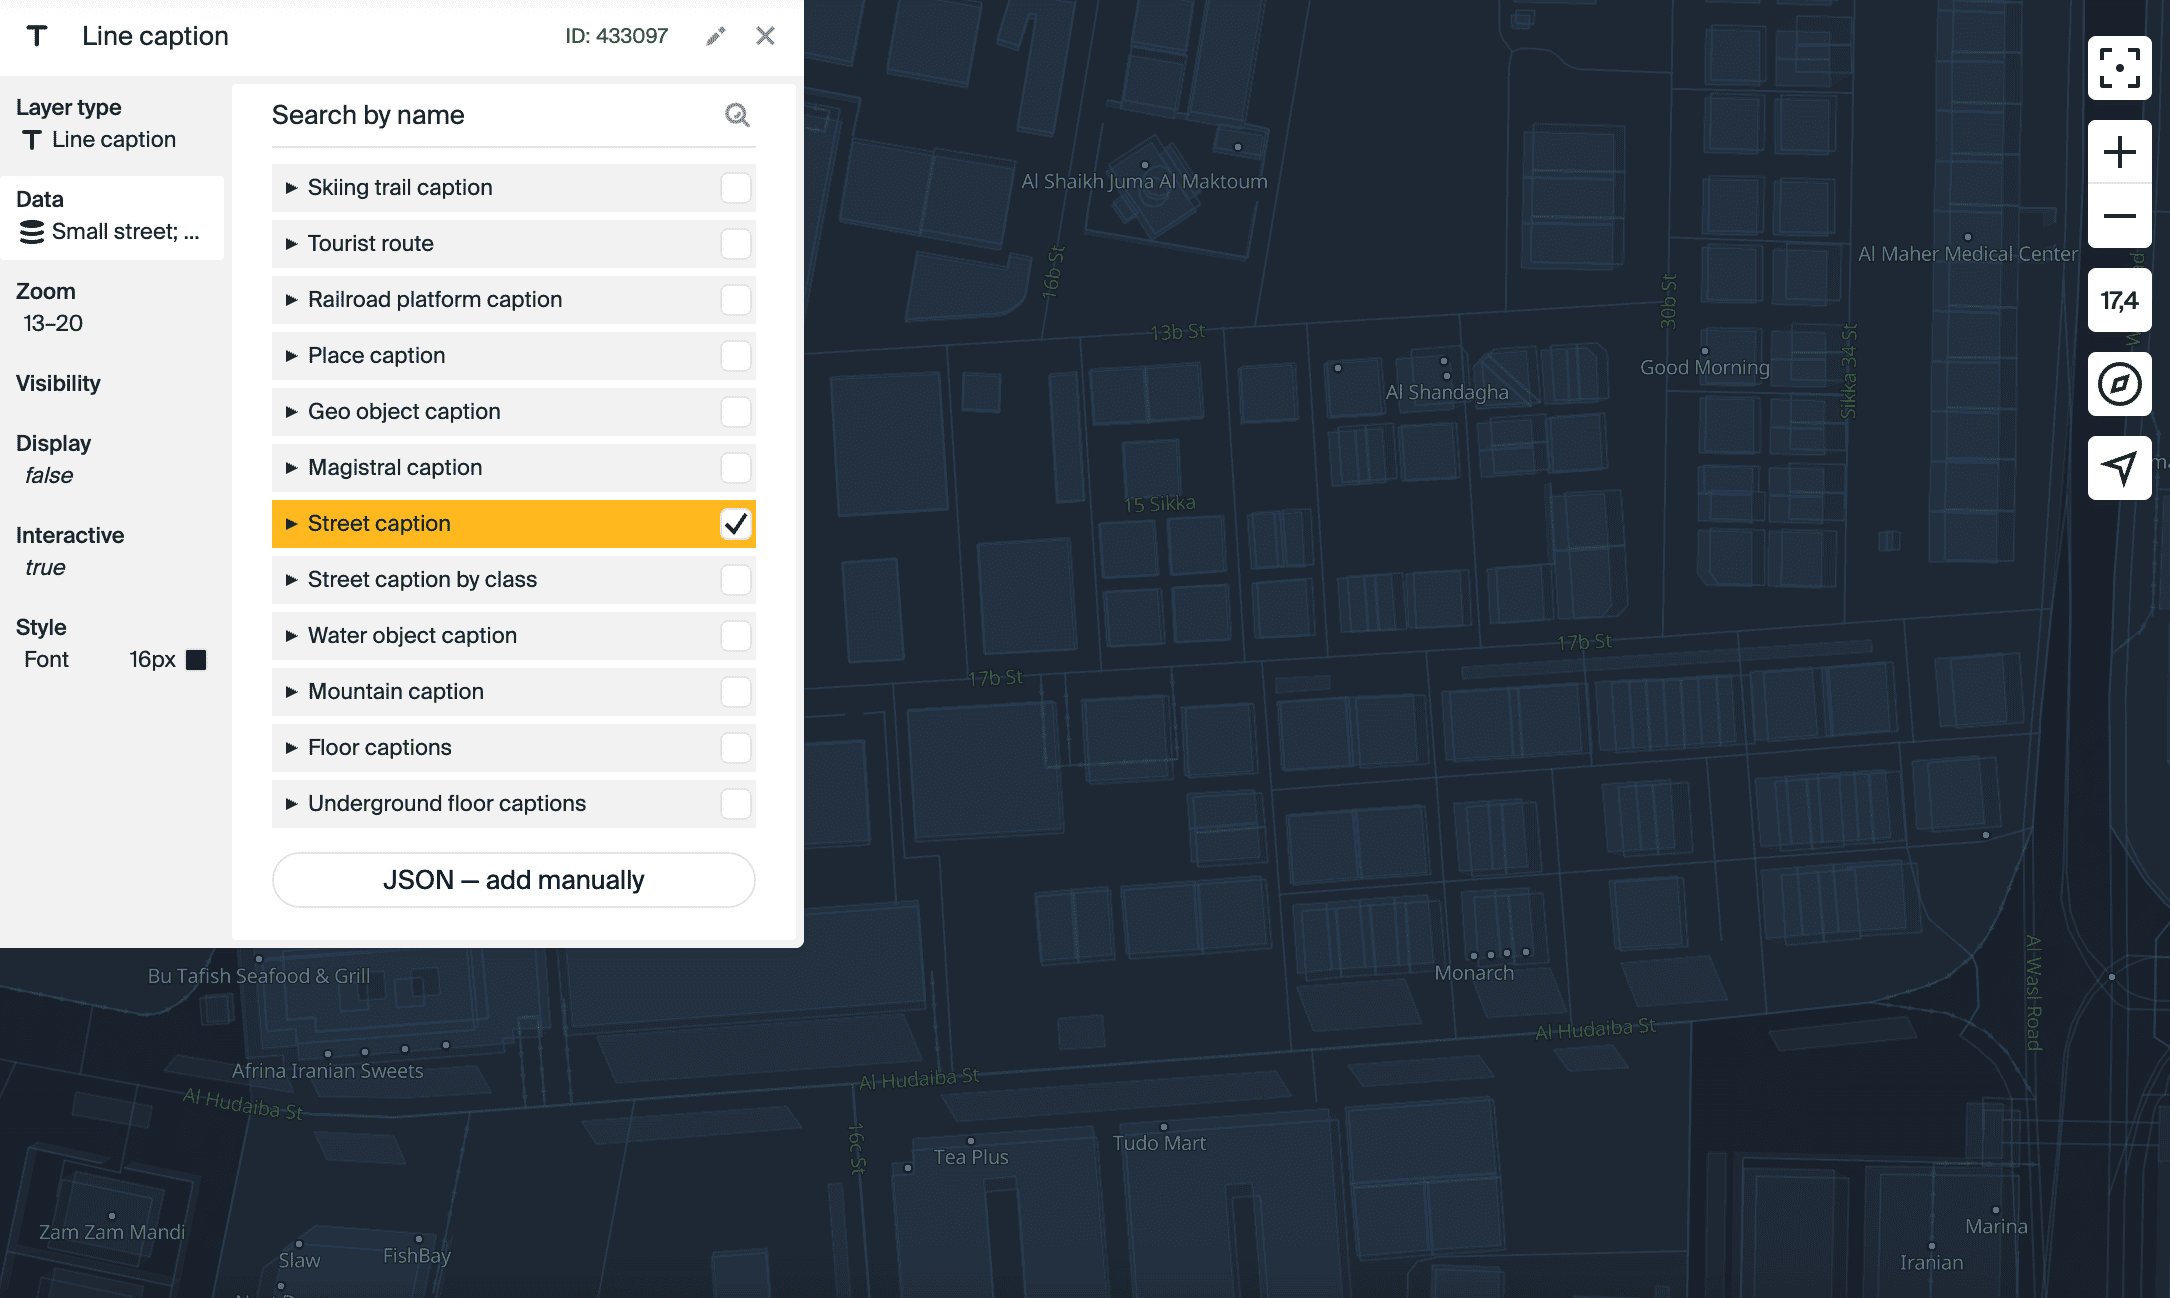
Line caption
Display on the map: text caption along the line.
What data it is used for:
- Captions of roads and streets of different classes.
- Captions of rivers, canals.
- And others.
Typical settings: font, font size, caption color, letter spacing, and other parameters.
Layer example:
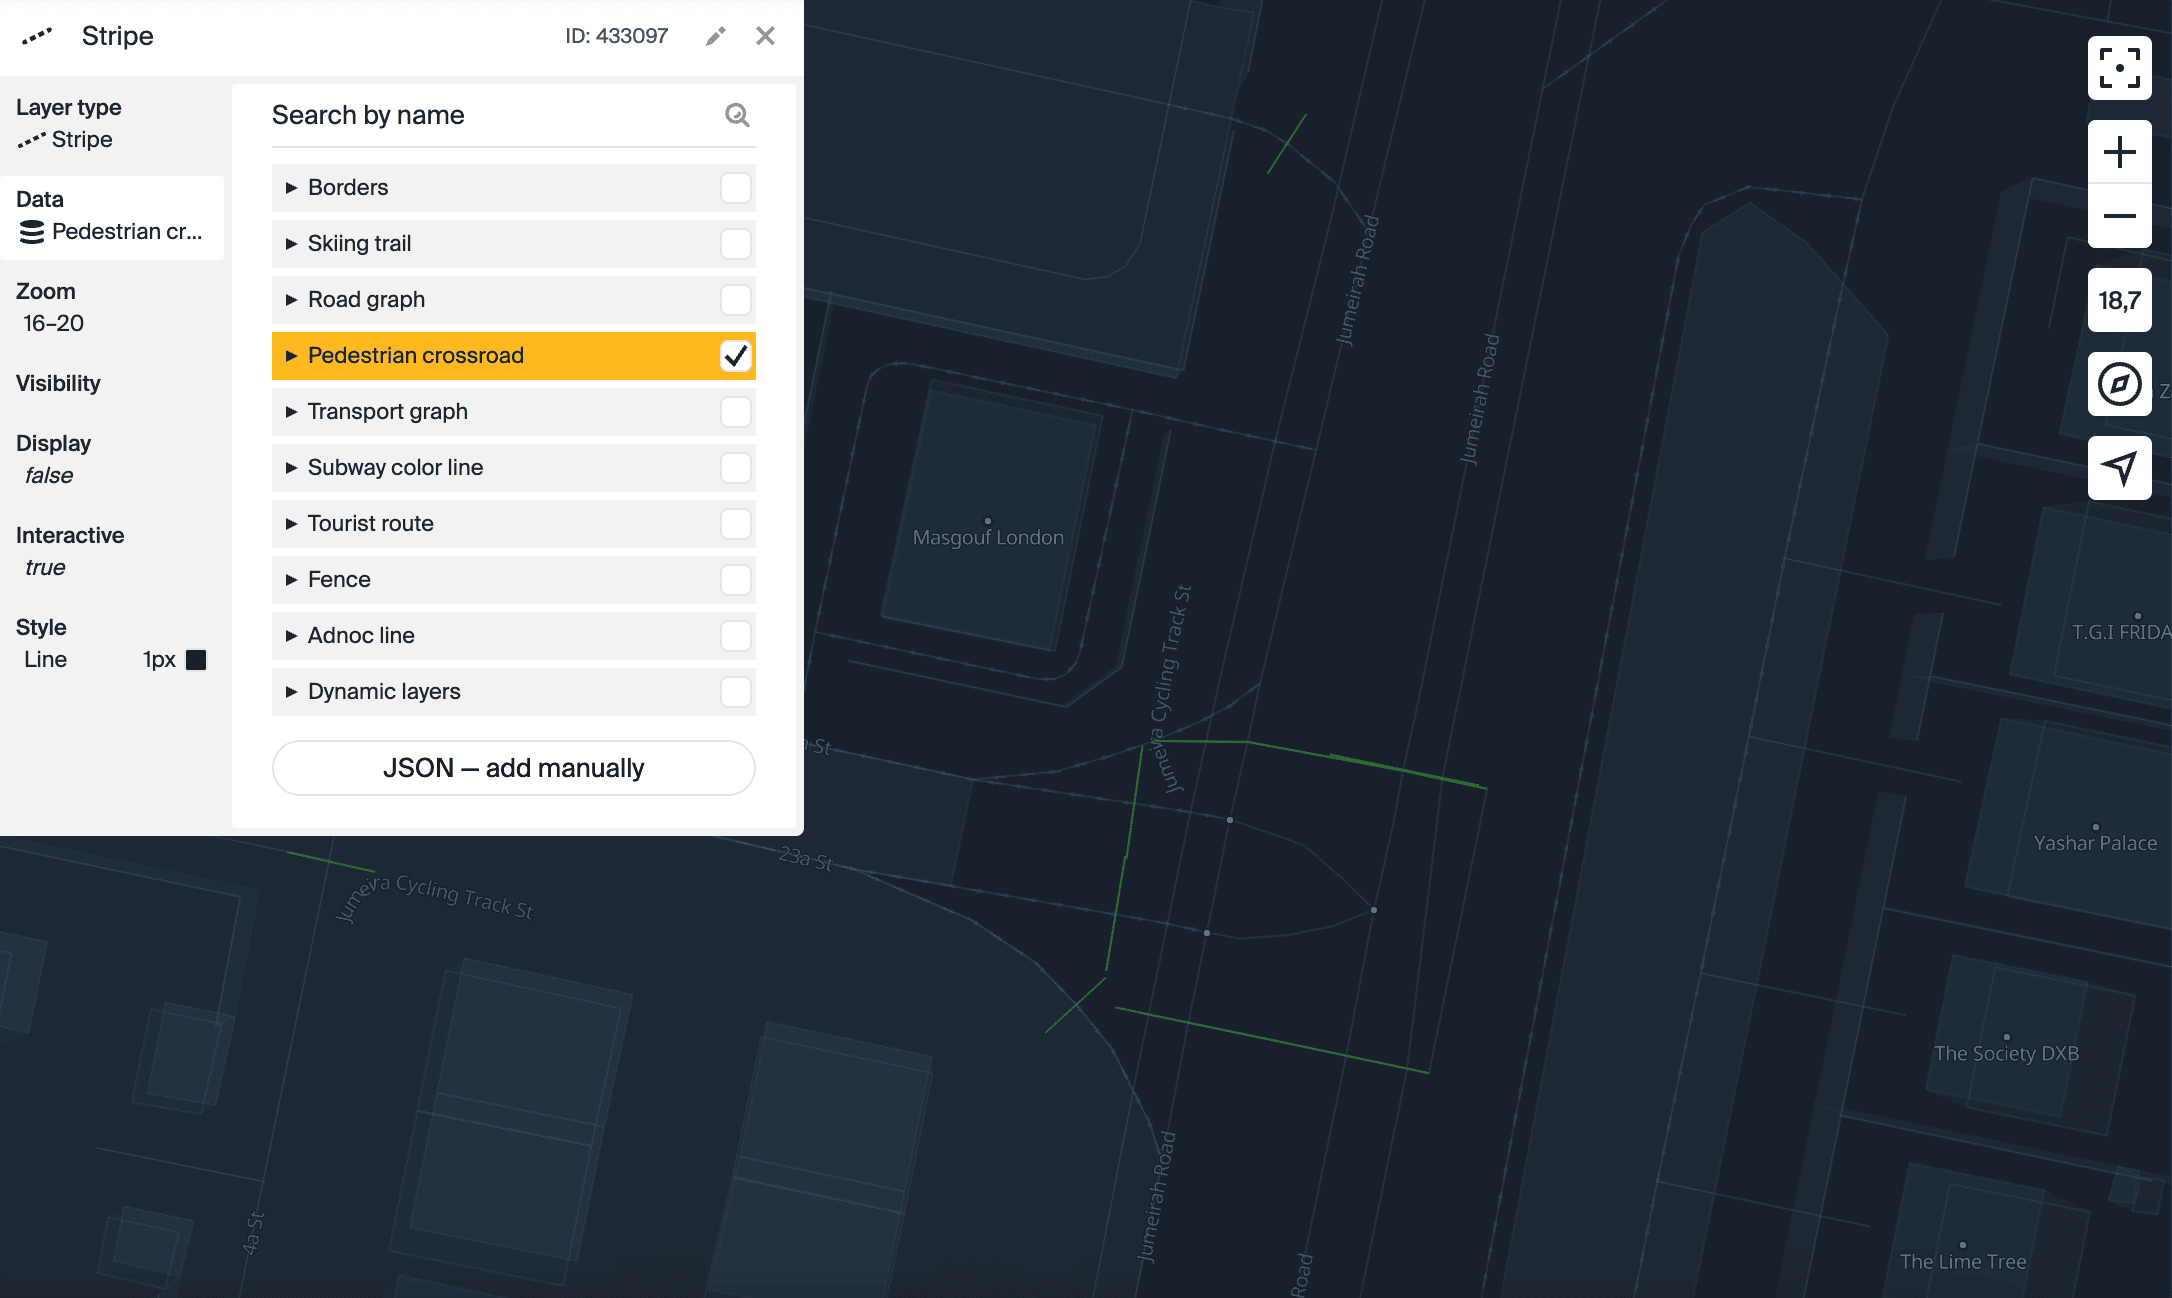
Stripe
Display on the map: wide dashed line.
What data it is used for:
- Road graph: pedestrian and bicycle roads, underground passages, roads under construction, etc.
- Transport graph: railway, tram, water transport route lines, etc.
- Pedestrian crossings.
- Tourist routes.
- Skiing trails.
- Boundaries of districts and administrative regions.
- And others.
Typical settings: fill color, line width, dash length, spacing color, and other parameters.
Layer example:
Line of arrows
Display on the map: arrows arranged in a line.
What data it is used for: direction arrows on roads of different classes.
Typical settings: fill color, line width, arrow line length, and other parameters.
Layer example:
![]()
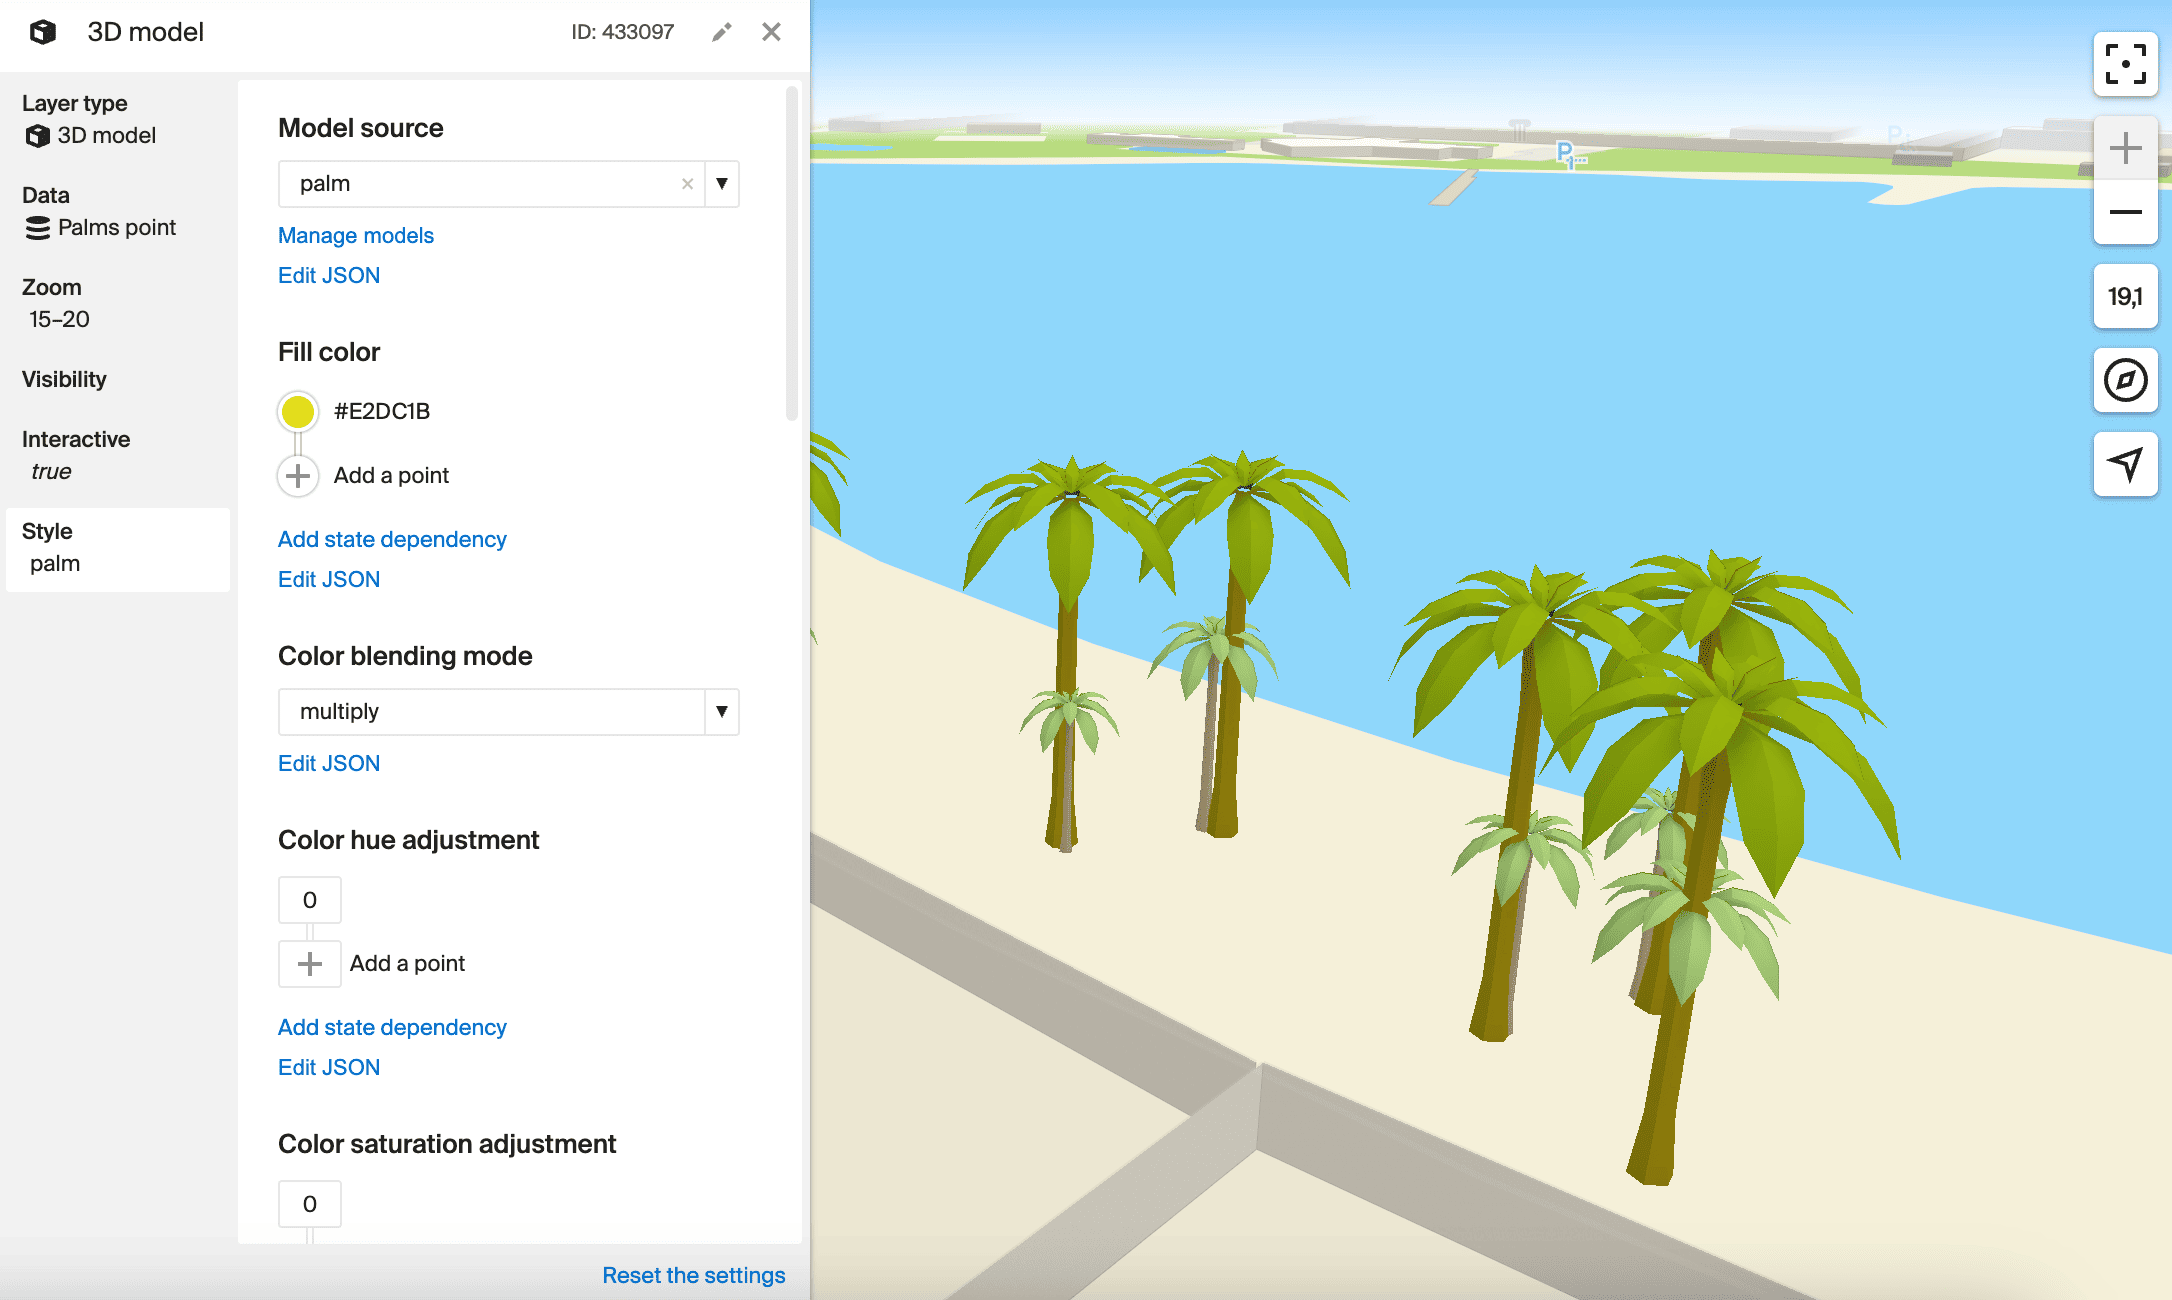
3D model
Display on the map: a simple 3D model.
What data it is used for:
- Trees.
- Benches.
- Lampposts.
- Custom 3D models.
- And others.
Typical settings: model source; fill color; coordinates of the scale, rotation, and offset of the object; near camera fade, and other parameters.
Layer example:
Building model
Display on the map: a complex 3D model tied to a specific building and replacing it on the map.
What data it is used for: custom 3D models of buildings.
Typical settings: fill color, stroke color and width, and near camera fade.
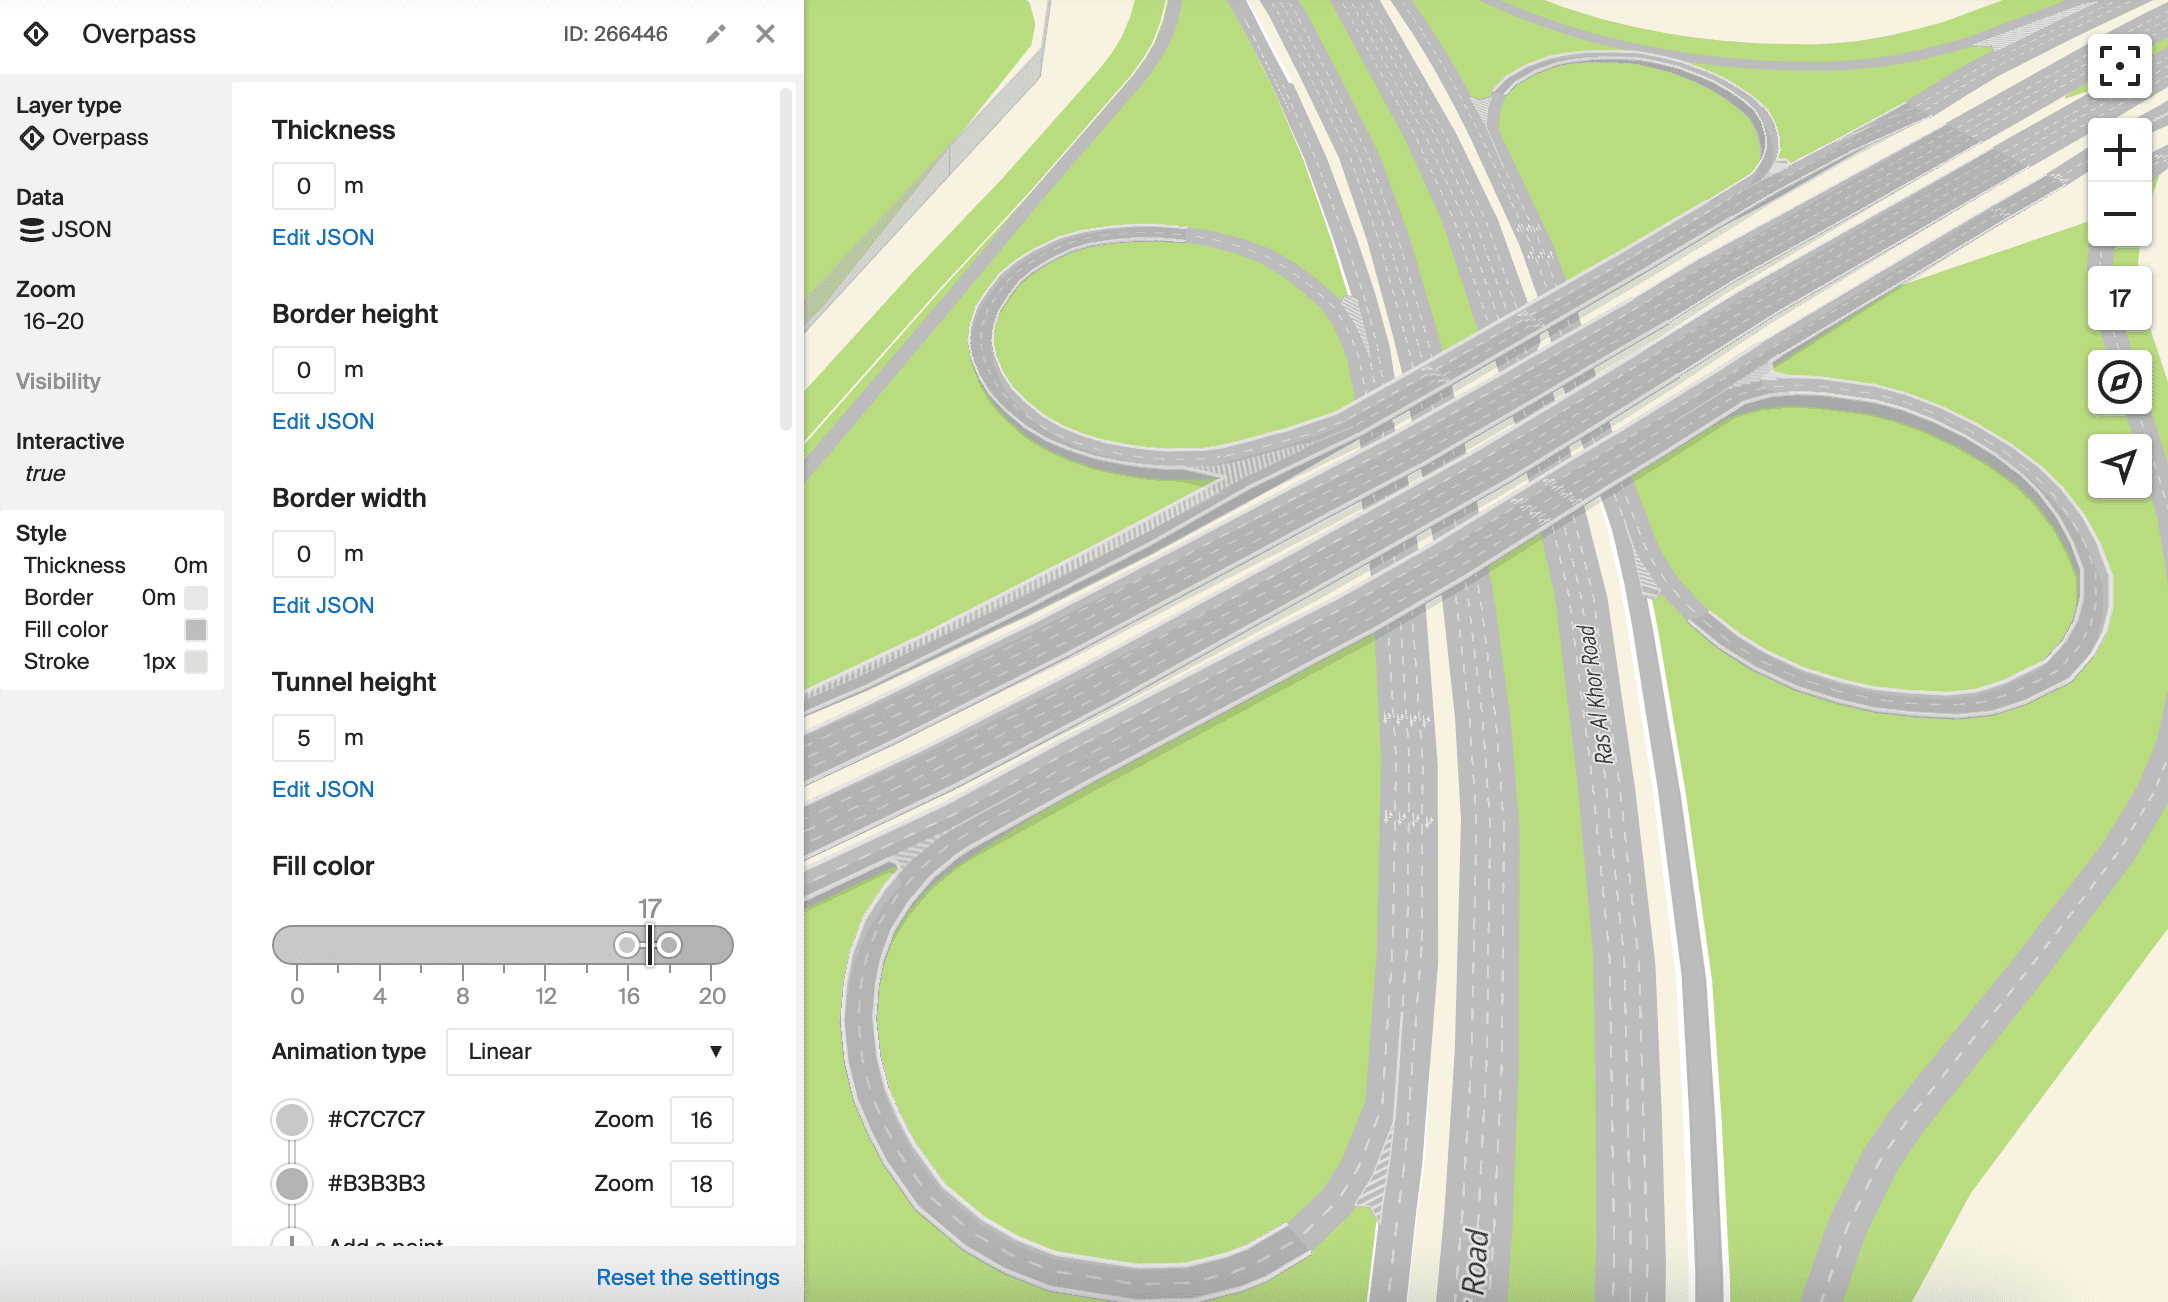
Overpass
Display on the map: 3D model of the overpass.
What data it is used for: immersive overpasses.
Typical settings: thickness, height and width of borders, tunnel height, sides fill color, stroke color and width, and other parameters.
Layer example:
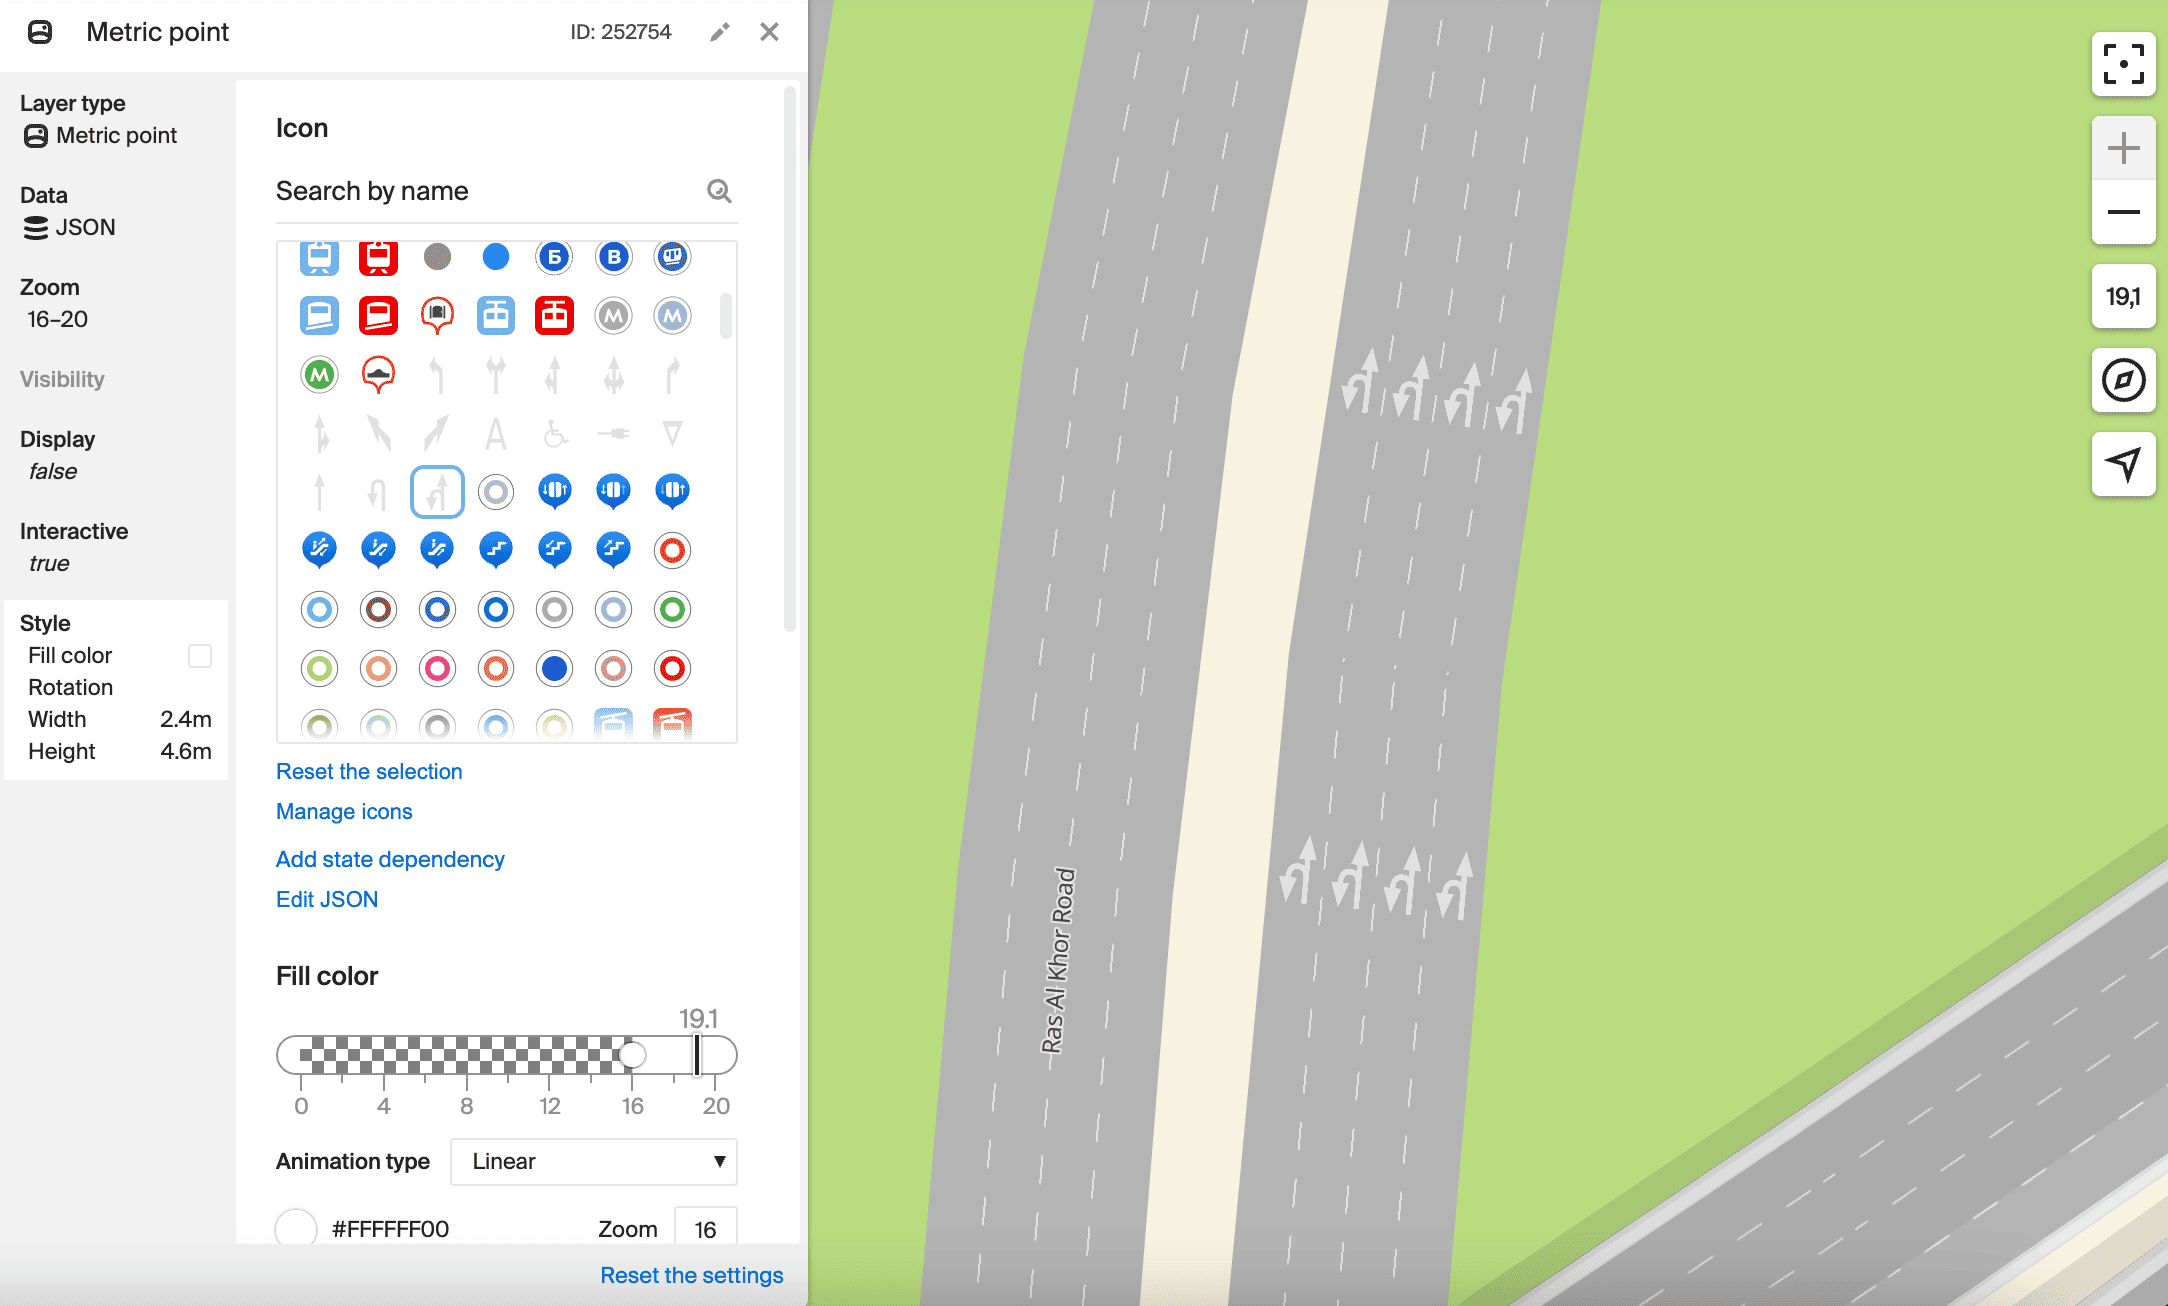
Metric point
Display on the map: a flat image of objects on the map.
What data it is used for: for any objects. You can upload images in .svg format and add a flat icon to a 3D object. For example, you can add arrows for immersive roads.
Typical settings: icon, fill color, rotation, width, and height.
Layer example:
Dynamic layers
Gradient line
Route lines with traffic jams.
Displaced line
A line with offset from the roads on the map. Used to display traffic jams.
Circle in the map plane
Displays the accuracy of the geolocation.
Transparent polygon
A polygon invisible on the map. Returns the list of displayed objects.
Dynamic arrow
Maneuver arrows.
Bubble
Bubbles with route information.
Directional model
Location marker.
Raster layer
Display on the map: data from an external source in the form of raster tiles overlying the main map.
What data it is used for:
- data from external sources: satellite images, heatmaps, territory plans, etc.
- raster tiles 2GIS, obtained using the Raster Tiles API.
Typical settings: available zoom levels, opacity, and other parameters.
Dynamic object
Objects created from custom code.