Trees on map
Displaying trees on the map always involves finding a balance between a realistic image and appropriate amout of data to create it. The example in this section illustrates a case when location points of certain trees and tree types in each point are known. The task is to display trees in the defined points and make them look natural.
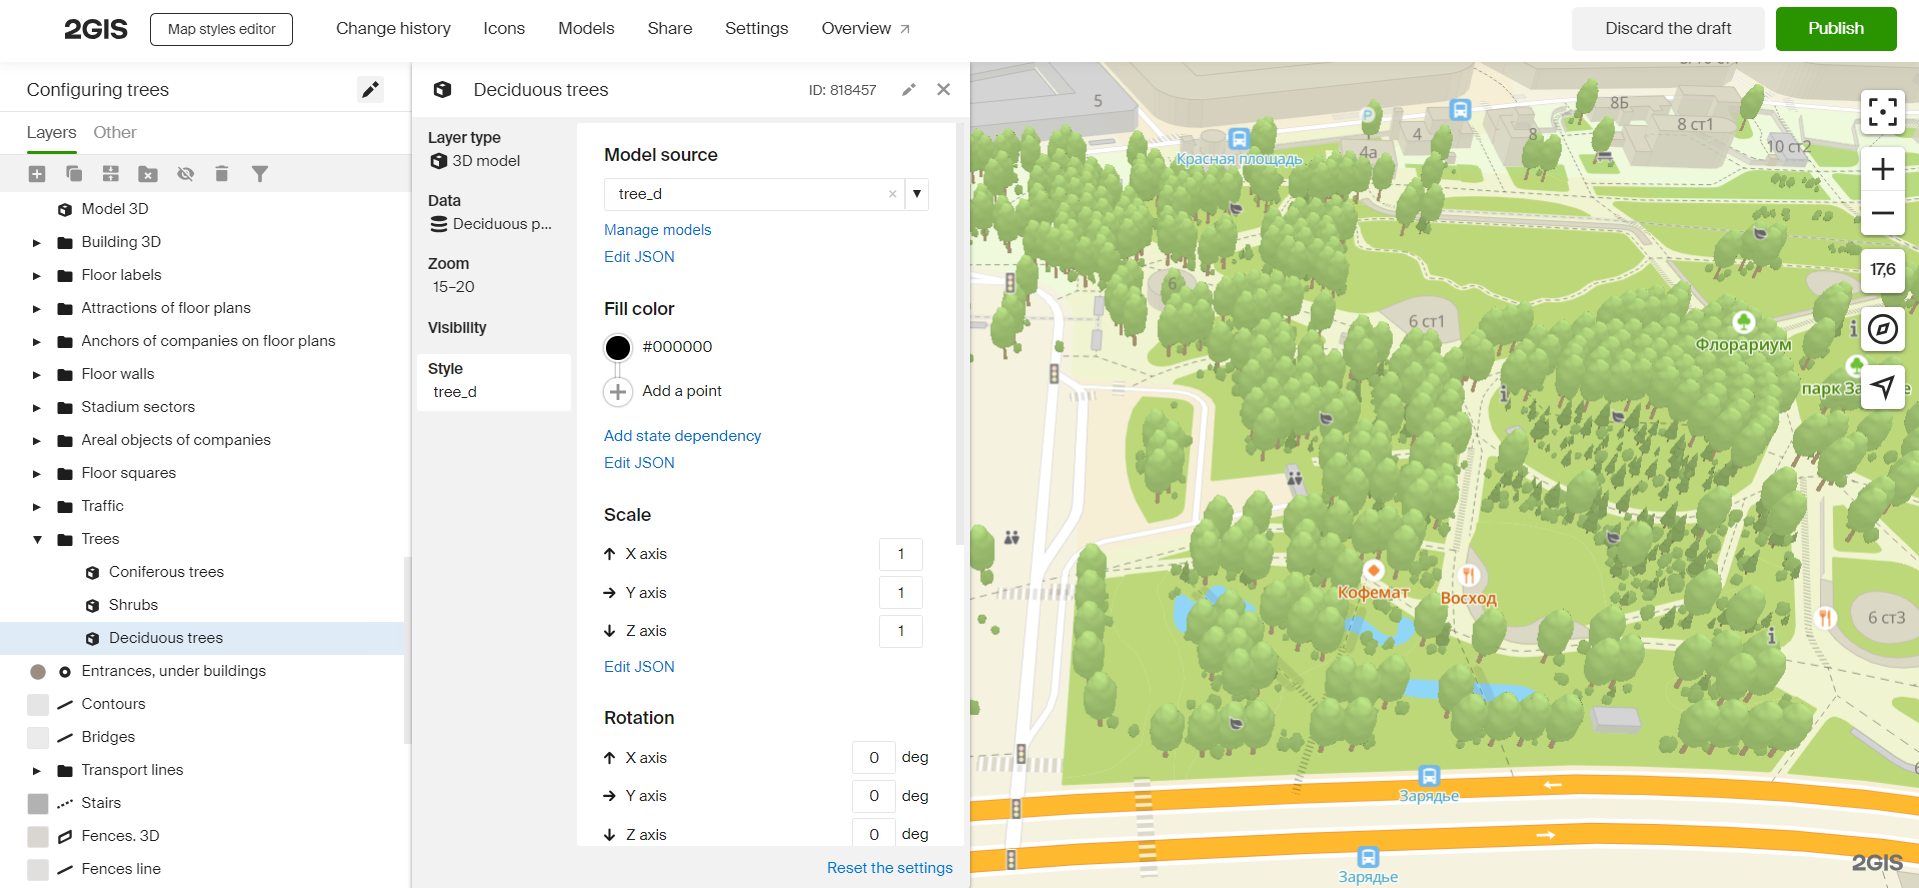
Configuring a style layer
-
Open the Style editor.
-
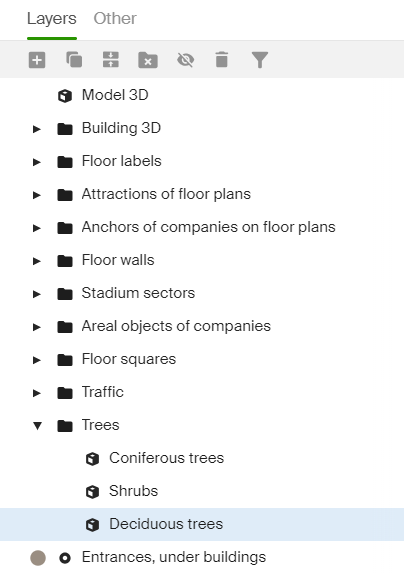
Add a new layer and select the 3D model layer type.
-
On the Data tab, expand the Trees sublist and select the required vegetation types.
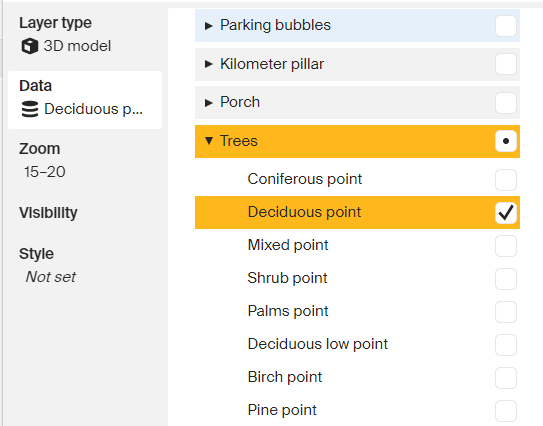
-
Group the style layers and place them after polygon and line objects but before layers with POI: trees are decorations and they should not overlay POI.
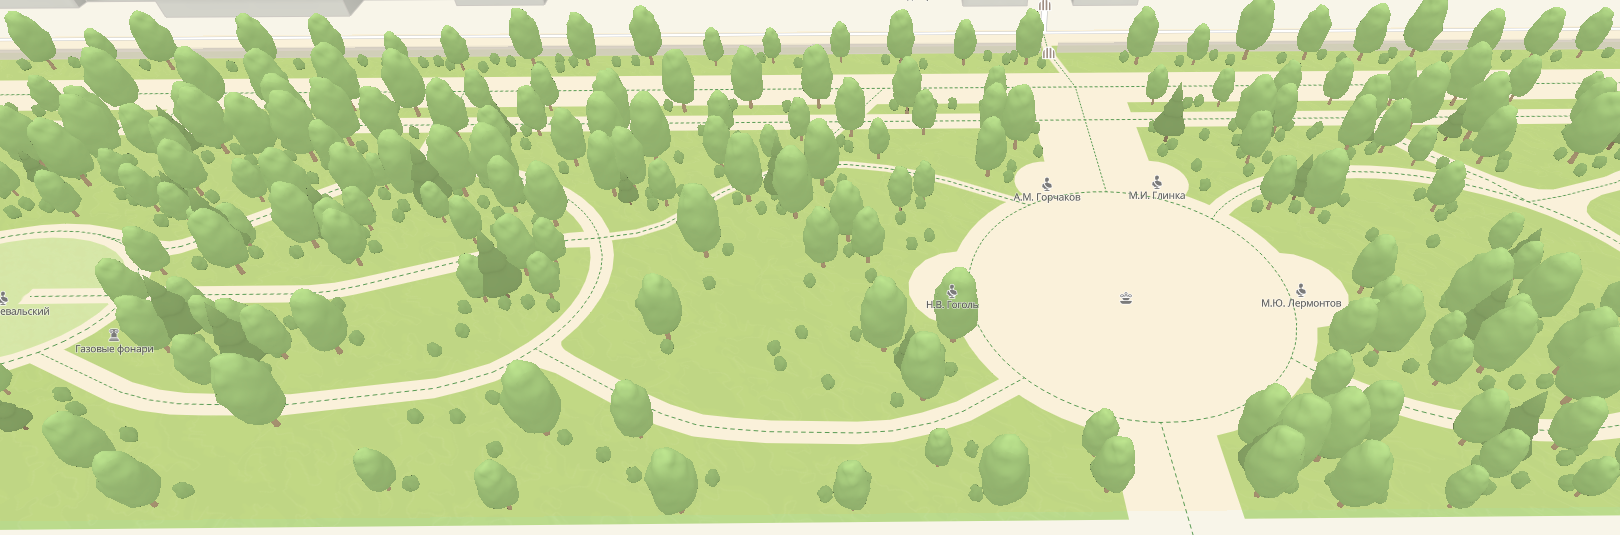
See the current view of a layer with deciduous trees:
Randomization
In the picture above, trees are angled and scaled identically. More diverse look of the trees should make the map view more natural. You can use random expressions to achieve it.
random expression
To enable randomization, add style expressions on the Style tab.
A random expression has two arguments that define the range of values to be generated randomly:
["random", 1, 5]
The result of a random expression is a floating-point number.
Scale randomization
-
Go to the Scale section and select Edit JSON.
-
Add the following expression:
["random", 0.3, 0.8]Scale randomization should be set in all three axes. Otherwise, a model may look stretched and distorted.
Rotation randomization
-
Go to the Rotation section and select Edit JSON.
-
Add the following expression:
["literal", [0, 0, ["random", 0, 180]]]In case of trees, the rotation should be randomized around the z-axis. Otherwise, trees will look twisted. In the example above, the rotation is defined for all axes: rotation around x- and y-axes is not done (0) but it is randomized around the z-axis in the range from 0 to 180 degrees.
Offset randomization
-
Go to the Offset section and select Edit JSON.
-
Add the following expression:
["literal", [["random", 0, 3], ["random", 0, 3], 0]]Offset should be randomized in x- and y-axes only. Otherwise, a model may look "hanging in the air". In the expression above, the offset is defined for all axes: the offset on x- and y-axes is defined randomly in the range from 0 to 3 units, the offset on z-axis is not done (0).
Final view
You can also check style layer settings in a prepared style. To access the settings, log into the Styles editor and select Create a copy.
<!DOCTYPE html>
<html lang="en">
    <head>
        <meta charset="UTF-8" />
        <meta name="viewport" content="width=device-width, initial-scale=1.0" />
        <title>2GIS Map API</title>
        <meta name="description" content="Quickstart with 2GIS Map API" />
        <style>
            html,
            body,
            #container {
                margin: 0;
                width: 100%;
                height: 100%;
                overflow: hidden;
            }
        </style>
    </head>
    <body>
        <div id="container"></div>
        <script src="https://mapgl.2gis.com/api/js/v1"></script>
        <script>
            const map = new mapgl.Map('container', {
                center: [37.628099, 55.751014],
                zoom: 18.5,
                rotation: 136,
                pitch: 45,
                key: 'Your API access key',
                style: 'df8c234a-6112-455e-86a6-dca1255e91aa'
            });
        </script>
    </body>
</html>