3D models
The map supports rendering of 3D models of the glTF/GLB format. These models allow you to improve the esthetics of the map view, highlight certain objects, and increase the level of details.
To add a model to the map:
- Review the model requirements and recommendations.
- Configure a style layer in the Style editor.
- Specify the model data.
You can also customize the display of 3D models depending on the graphics presets.
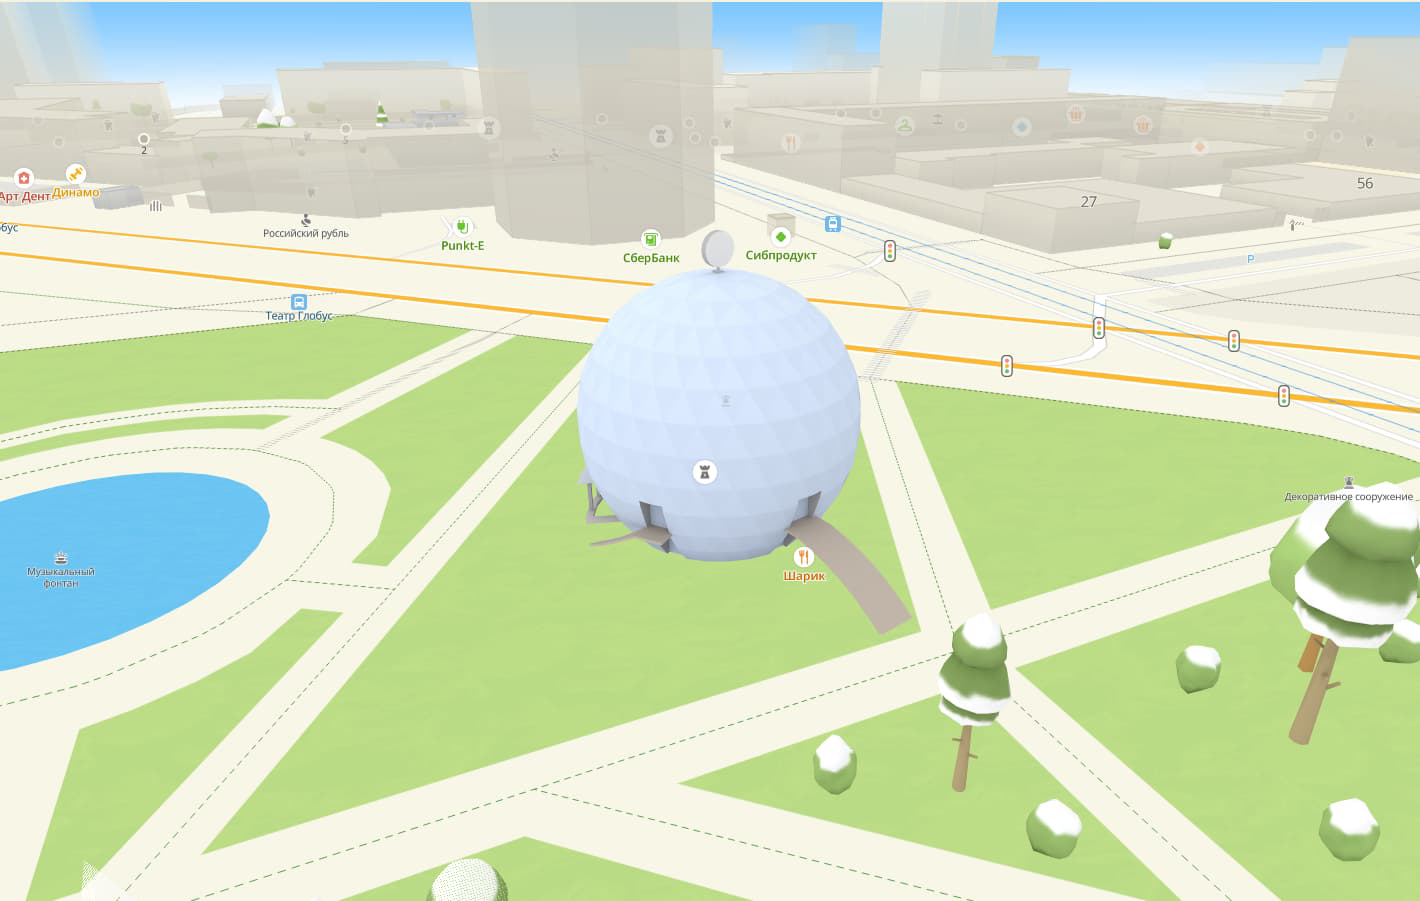
The example below describes how to stylize a building on the map by replacing it with a unique model.
Model requirements and recommendations
For optimal map performance and correct display of 3D models on the map, follow the requirements and recommendations.
Mandatory requirements:
-
Format: glTF/GLB (
.gltf,.glbfiles). -
Mesh: it is preferred that the model contains one mesh (a geometric object on the scene). Using models with multiple meshes slightly reduces map performance.
-
Texture:
- A mesh can have a texture or a fill with one color.
- The texture resolution must be a power of two (2, 4, 8, 16, 32, 64, 128, and 256).
- The supported image formats for textures are
.png,.jpg, and.bmp. - Texture compression and the texture properties
emissiveTextureandnormalTextureare not supported.
-
Instantiation: extensions for instantiation are not supported.
Usage and performance recommendations:
- Size: the optimal size for unique models is less than 20,000 vertices; for typical models (e.g., trees), it is from 200 to 2000 vertices.
- Texture: the optimal texture size for unique models is 256×256; for typical models, it is 64×64.
- Colors: if you do not customize your own map styles and only load models, it is recommended to match the texture colors of the models with the colors of the 2GIS map.
- Matrix animations: supported, but using them slightly reduces map performance.
- PBR lighting model: supported, but using them slightly reduces map performance.
- Local transformations: local transformations (translations, rotations, and scaling) are supported but slightly reduce map performance. It is recommended to use them only in rare cases. For optimal performance, models should not contain local transformations.
Configuring a style layer
-
Open the Style editor.
-
Open the required style.
-
Add a new layer with the 3D model layer type.
-
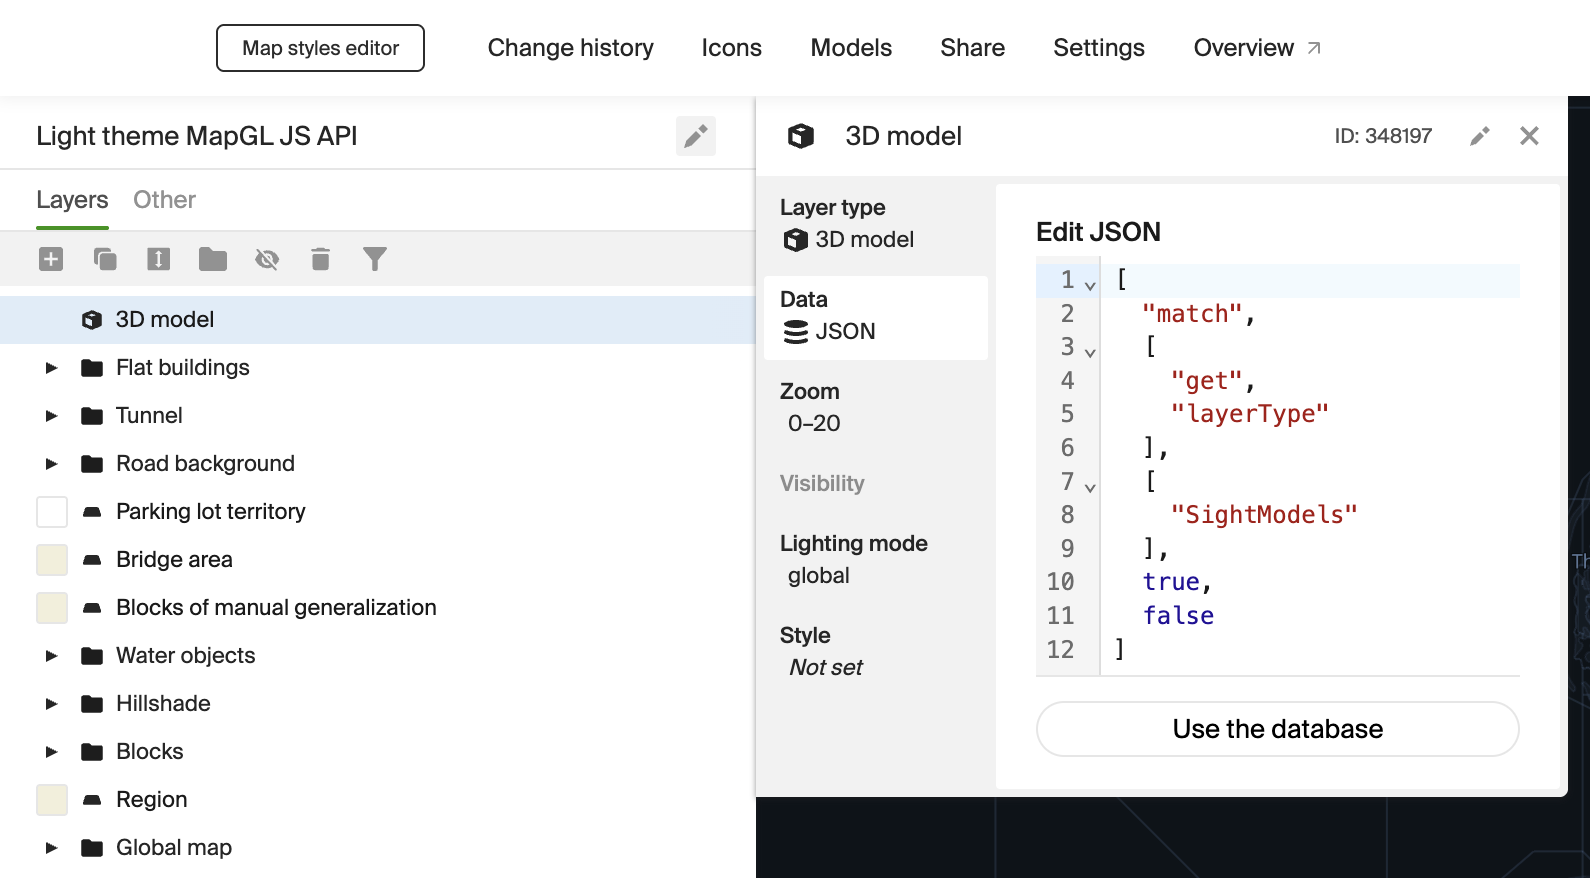
Go to the Data tab, scroll down, and select JSON - add manually:
-
Copy and paste the following code snippet:
["match", ["get", "layerType"], ["SightModels"], true, false] -
The URL and positioning settings of the model are defined in the model data. You need to link model settings to its attributes using
GETexpressions in the style layer. To do this, go to the Style tab and set the following parameters using JSON (click Edit JSON in the required fields):Parameter Value Model source ["get", "url"]Scale ["get", "scale"]Rotation ["get", "rotation"]Offset ["get", "translate"] -
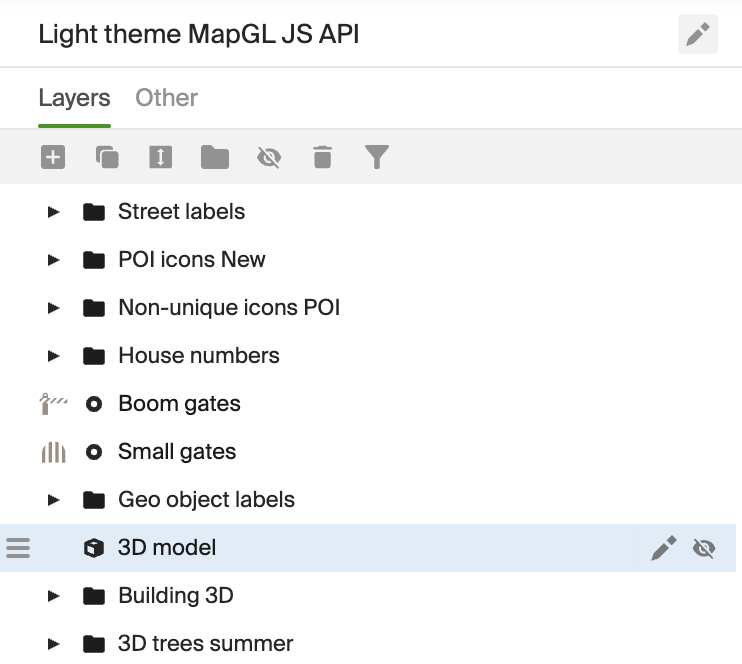
Place the style layer in the list after layers with POI (icons describing objects on the map) and before layers with 3D buildings. In this case, the model does not overlay captions and icons:
Configuring model data
-
Add the model data in a GeoJSON format:
{
    "type": "FeatureCollection",
    "features": [
        {
            "type": "Feature",
            "properties": {
                "url": "https://disk.2gis.com/digital-twin/models_s3/docs/spherecafe.glb",
                "layerType": "SightModels",
                "scale": [1, 1, 1],
                "rotation": [0, 0, 0],
                "translate": [0, 0, 0]
            },
            "geometry": {
                "type": "Point",
                "coordinates": [82.926685835, 55.02533639]
            }
        }
    ]
}
Specify the parameters:
-
"type": "Feature"- commonFeatureobject of GeoJSON. -
properties:url- URL to load a model."layerType": "SightModels"- enables the map to match a data object to a created style layer.scale- initial object scale setting.rotation- initial object rotation setting.translate- initial object offset setting.
You can edit positioning settings later, after checking the model position on the map.
-
geometry:"type": "Point"- point object.coordinates- object center coordinates. In this example, the object will be displayed in the82.926685835, 55.02533639point.
-
-
After the model data and the style layer are ready, you can check an intermediate result:
The model is displayed on the map but is shown incorrectly. To correct the display:
- Configure the model positioning: scale, rotation, and offset.
- Hide the 3D building on the map, which is located in the place of the model.
Configuring the model position
Correct the values of the scale, rotation, and translate object parameters. To correctly display the model in the example, you can specify the following values:
...

"scale": [0.96, 0.96, 0.96],
"rotation": [0, 0, 203],
"translate": [-2.7, 13, 0]

...
Specify the parameters:
scale- model scale. Set in relative units based on the initial model size. It is recommended to change the model scale on all three axes at once. Otherwise, a model will look stretched and distorted.rotation- model rotation. Set in degrees. It is recommended to set a model rotation around the z-axis. Rotation around other axes may lead to model distortion.translate- model offset. Set in meters relative to the initial model location. It is recommended to set a rotation only on the x-axis and the y-axis to prevent a model from "hanging in the air".
Instead of manually adjusting the model positioning settings, use the tool for positioning models on the map. You can position the model and copy the configuration values: for more details, see the Placing models on the map section.
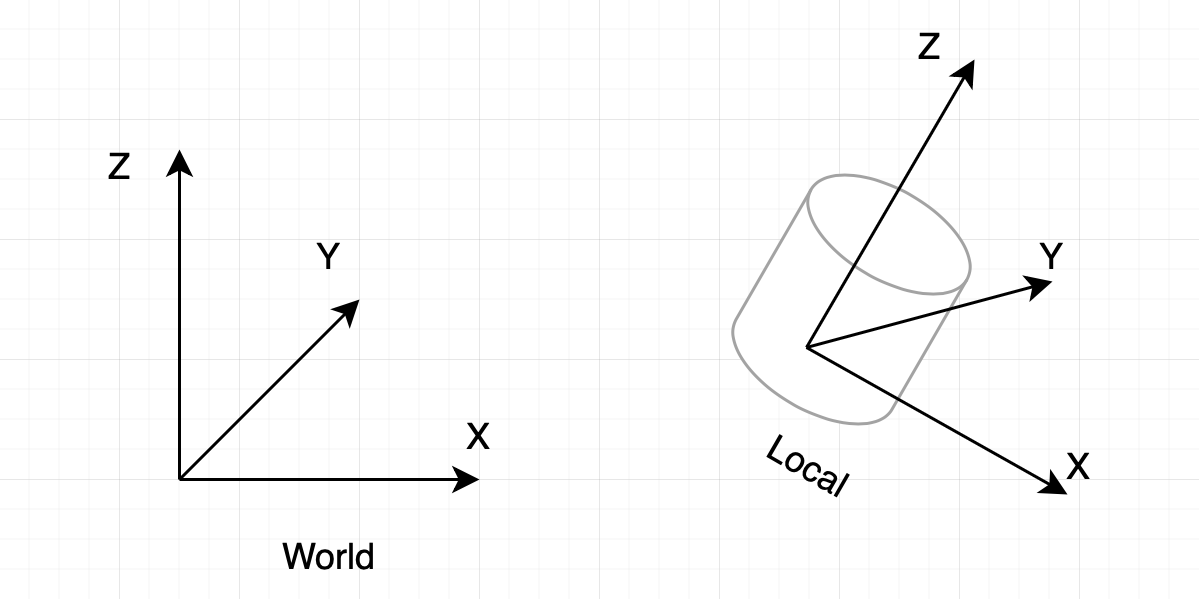
3D models support transformations in three-dimensional space defined by the x-, the y-, and the z-axes. Scale transformation is performed in the local coordinate system (Local in the scheme). Other transformations are performed in the World Coordinate System (World), where the x-axis faces east, the y-axis faces north, and the z-axis points upward.
Hiding overlaying objects
To hide an object on the map that overlays the model:
-
Get the object identifier:
-
To subscribe to the
clickevent on the map and make it return to the console, add the following snippet to your application source code:map.on('click', function (ev) {
console.log(ev);
}); -
Open the browser Developer Tools (press
F12) and click the object to be hidden. Copy the identifier from thetarget.idfield of the event, for example: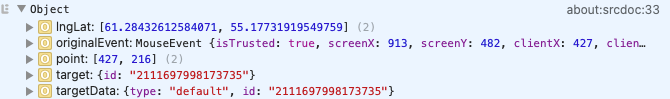
-
-
Pass the received object identifier to the
idsToHidefield of the GeoJSON data:{
"type": "FeatureCollection",
"features": [
{
"type": "Feature",
"properties": {
"idsToHide": ["141373143542097"],
...
},
...
}
]
} -
In the Style editor, go to the Style tab in the style layer and specify the following parameter using JSON (click Edit JSON in the Linked IDs field):
Parameter Value Linked IDs ["get", "idsToHide"]
Example of the result after adjusting the positioning settings:
If necessary, you can view the style layer settings in the prepared style. To access the settings, log in to the Style editor and click Create a copy.
Configuring graphics presets
By default, the display of 3D models is enabled in all graphics presets. With graphics presets, you can manage the display of built-in and your own 3D models that are configured in style layers with the 3D model (for example, layers with trees) and Building model types.
You cannot use graphics presets to manage the display of built-in buildings on the map, because they are set in layers with the Raised polygon type by default.
To configure the display of 3D models in different graphics presets:
-
Open the Style editor.
-
Open the required style.
-
Configure the display of 3D models depending on the graphics preset:
-
In the Other tab, select Graphics presets:
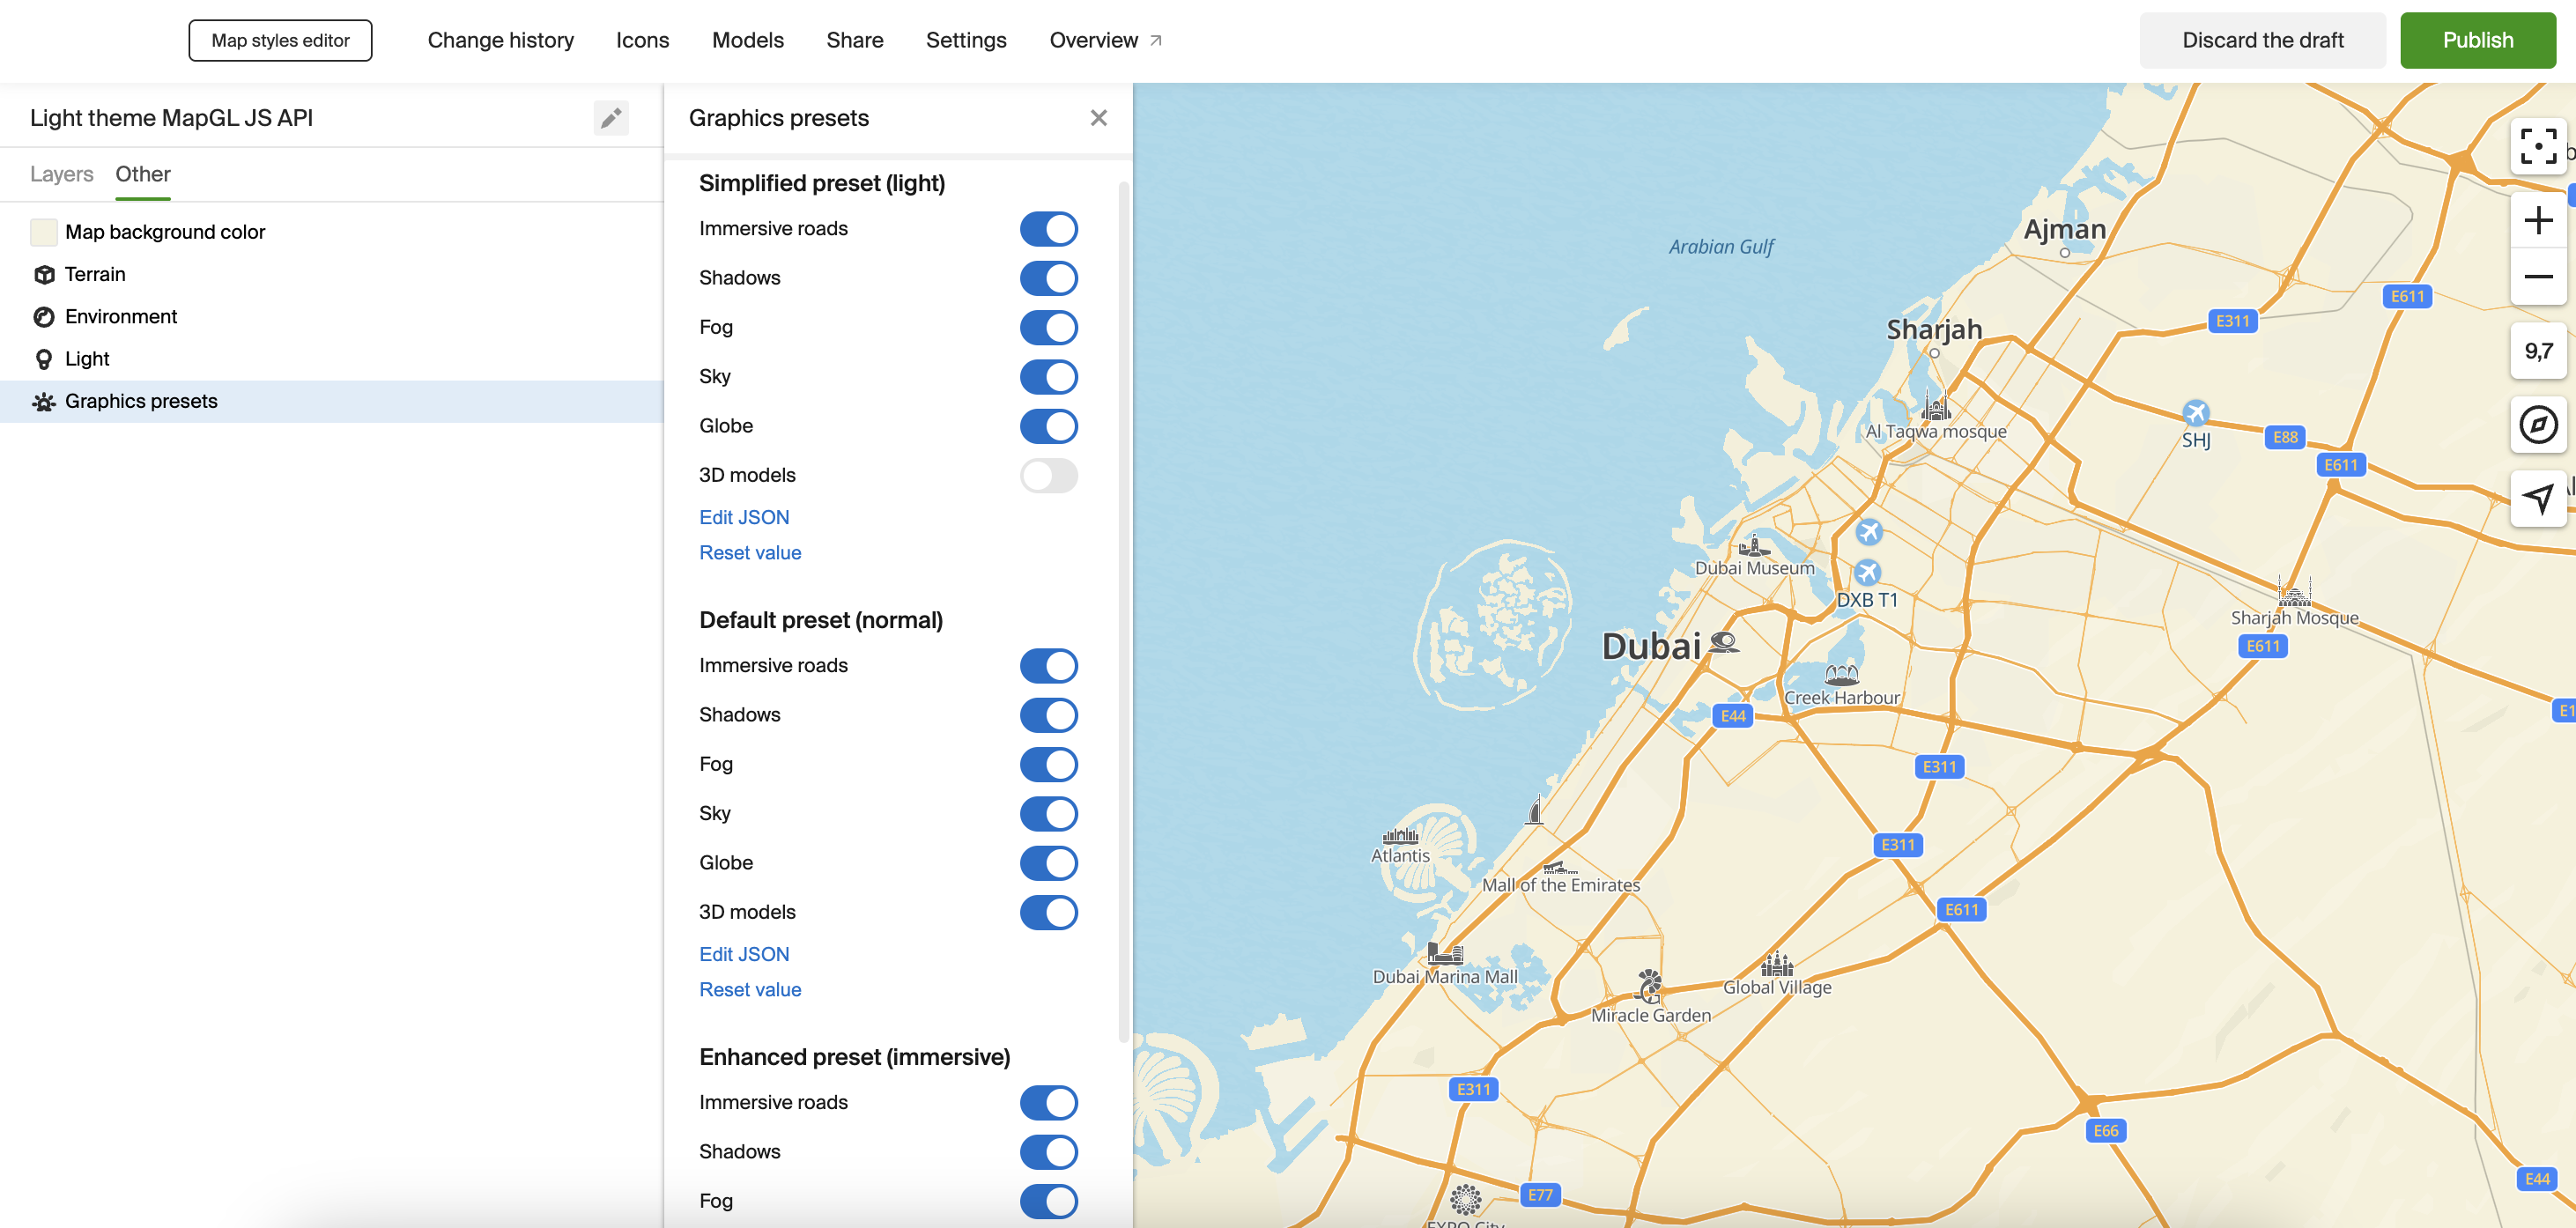
-
Use the 3D models toggles in the required presets.
-
For more information on how to set a graphics preset for the map and change the active preset while working with the map, see the Turning on and switching the preset instruction.
Besides graphics presets, you can set the display of 3D models by creating a global style variable.