Line caption
Using the GeoJSON data source and the Style editor, you can add your own caption to a line on the map.
To add a caption, add a data source and create a style layer with the Line caption type:
-
Add a data source using the GeoJsonSource class. As a
geometryin data, specify aLineStringobject with the line coordinates:const data = {
type: 'Feature',
properties: {
foo: 'bar',
text: 'Text over a line',
},
geometry: {
type: 'LineString',
coordinates: [
[37.598234, 55.758432],
[37.631876, 55.778654]
],
},
};
const source = new mapgl.GeoJsonSource(map, {
data,
});Specify parameters:
foo- unique line property. Use to associate a GeoJSON data source with the style layer in the Style editor where the caption settings are set.text- caption text above the line.coordinates- line coordinates.
-
Open the Style editor.
-
In the My styles block, open the style used for the map.
-
In the Layers section, click
 icon.
icon. -
Select the Line caption layer type.
-
Specify the required line caption settings: font, text color, and others.
-
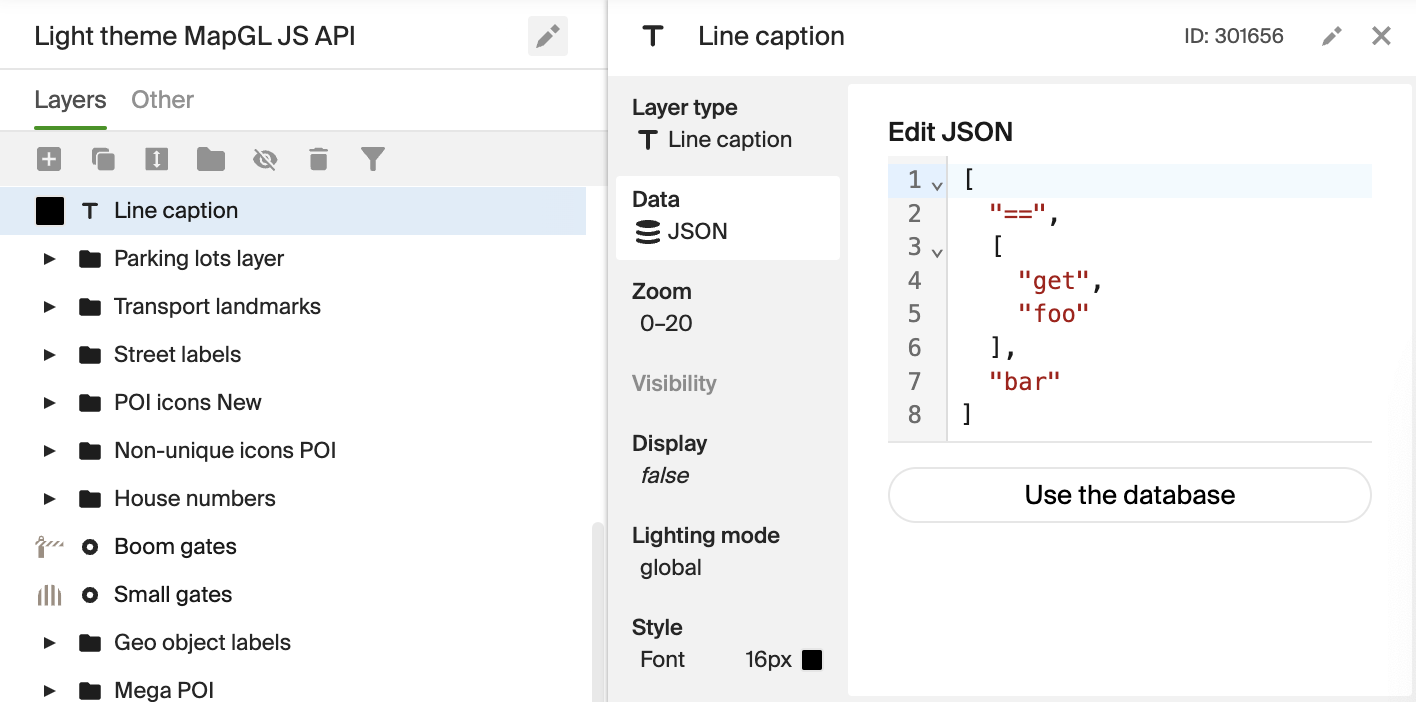
Associate the created GeoJSON data source with the layer. To do this, open the Data block, click JSON - add manually, and specify the unique line property
foothat you specified in the line data:[
"==",
[
"get",
"foo"
],
"bar"
]
-
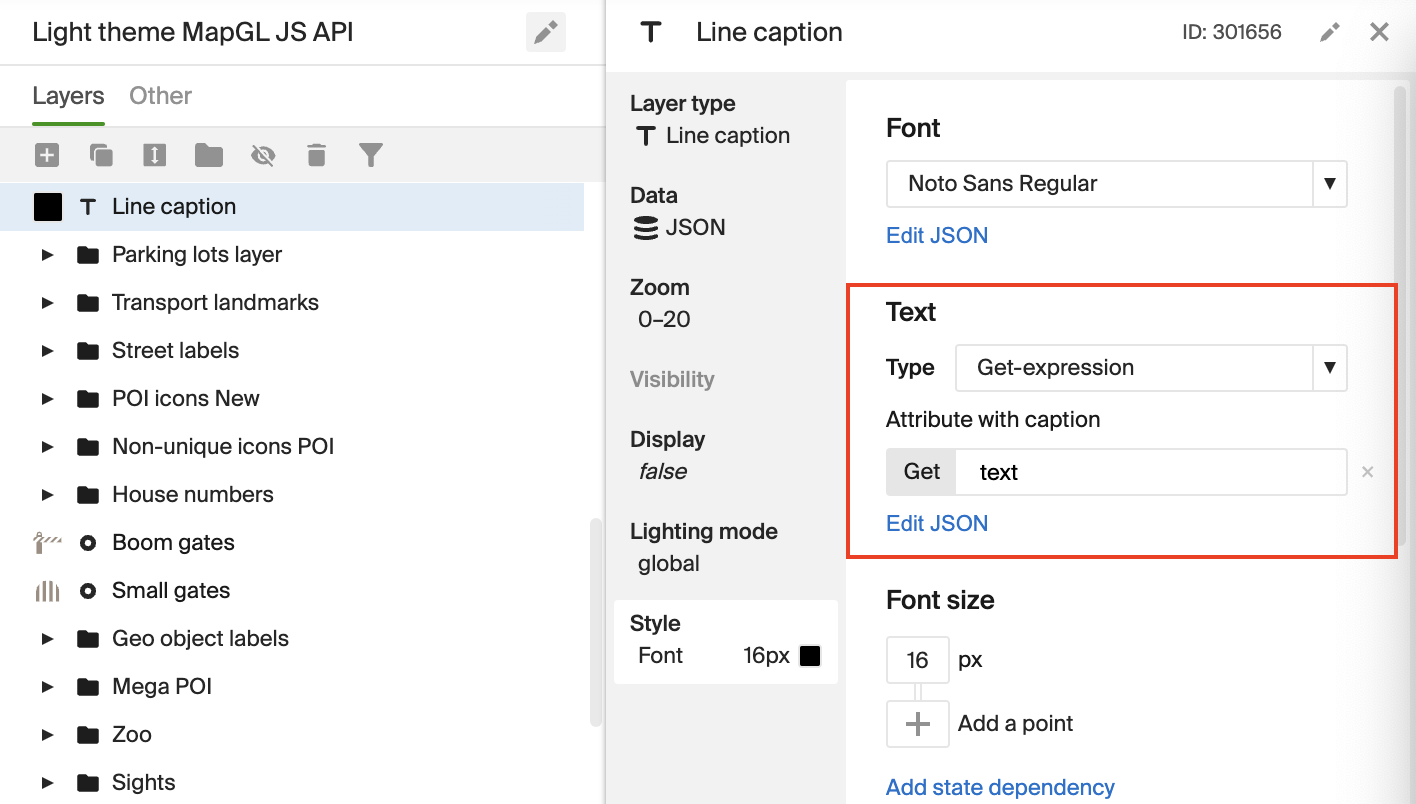
Associate the
textattribute from the GeoJSON data source with the layer. To do this, open the Style block and specify in the Text field:- Type: Get-expression
- Attribute with caption:
text
-
To prevent map captions from overlapping the line caption, add it to a separate labeling group:
-
Click Settings in the top menu and click Open labeling groups.
-
Create a new group, for example,
line. Add this group and the default group (default) to the Labeling group overlap field: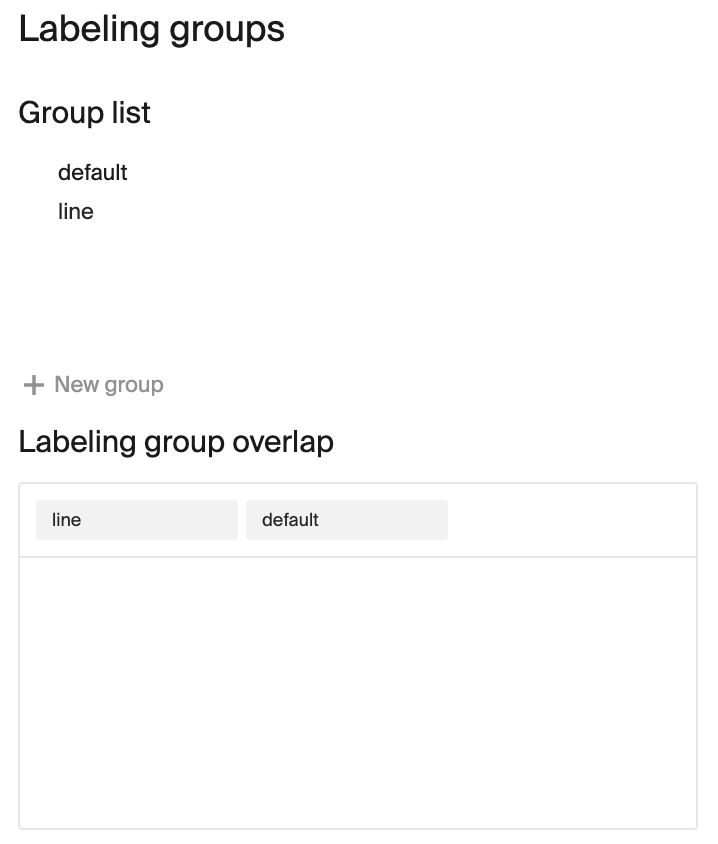
-
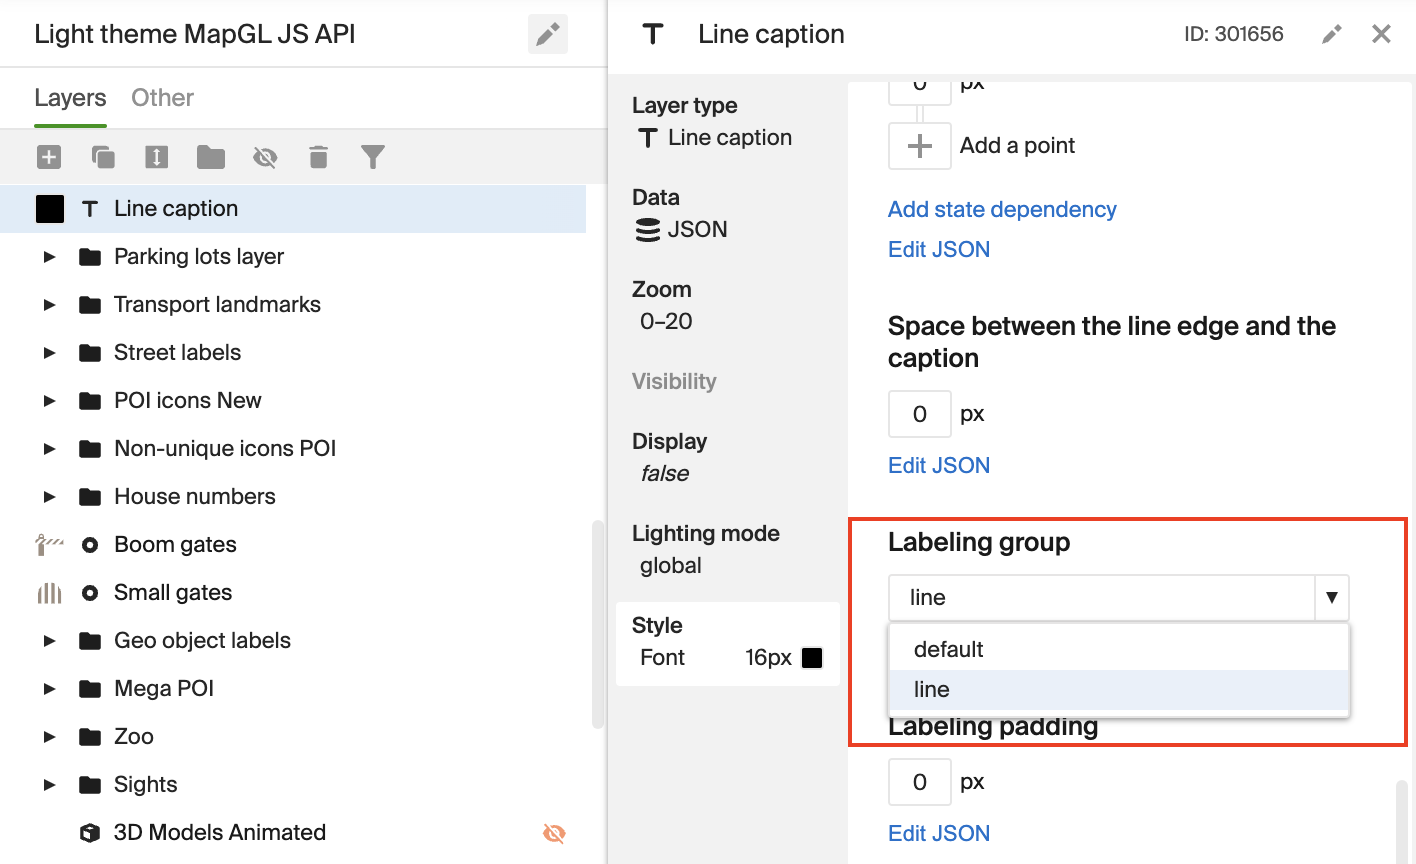
Go to the layer settings. Open the Style block and select the created labeling group in the Labeling group field:
-
Data that you add to the map via GeoJSON does not appear in the Style editor. To check how the caption appears on the map, after creating and customizing the line layer, publish the style and view the changes in an online editor such as CodePen.