Data aggregation
Aggregation is the transformation of multiple data values into a single resulting value using functions. Two types of aggregated values are available:
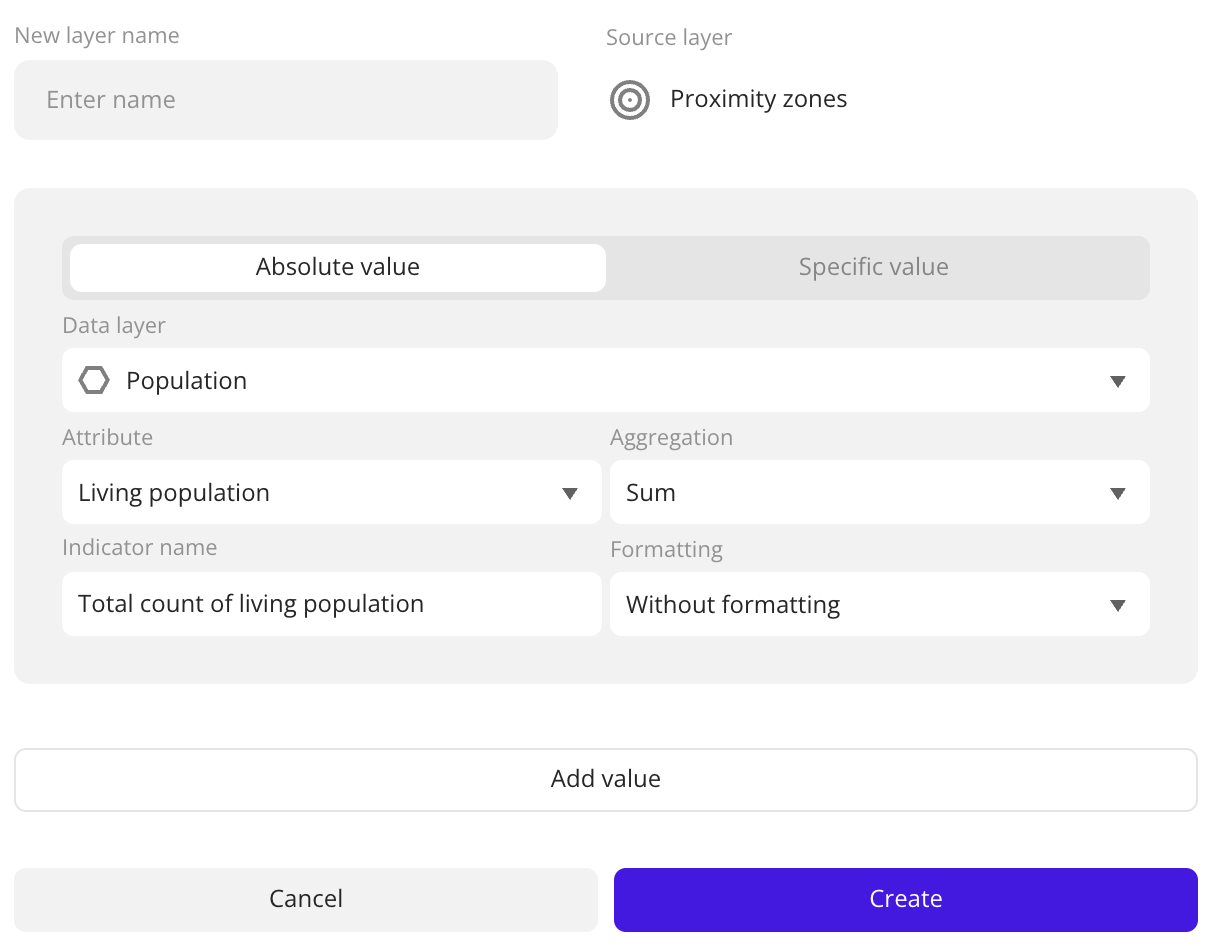
- Absolute value: sum, average, minimum value, maximum value, and others. Usage example: calculate the total count of residents or the average rating of competitors within a polygon or a 5-minute proximity zone.
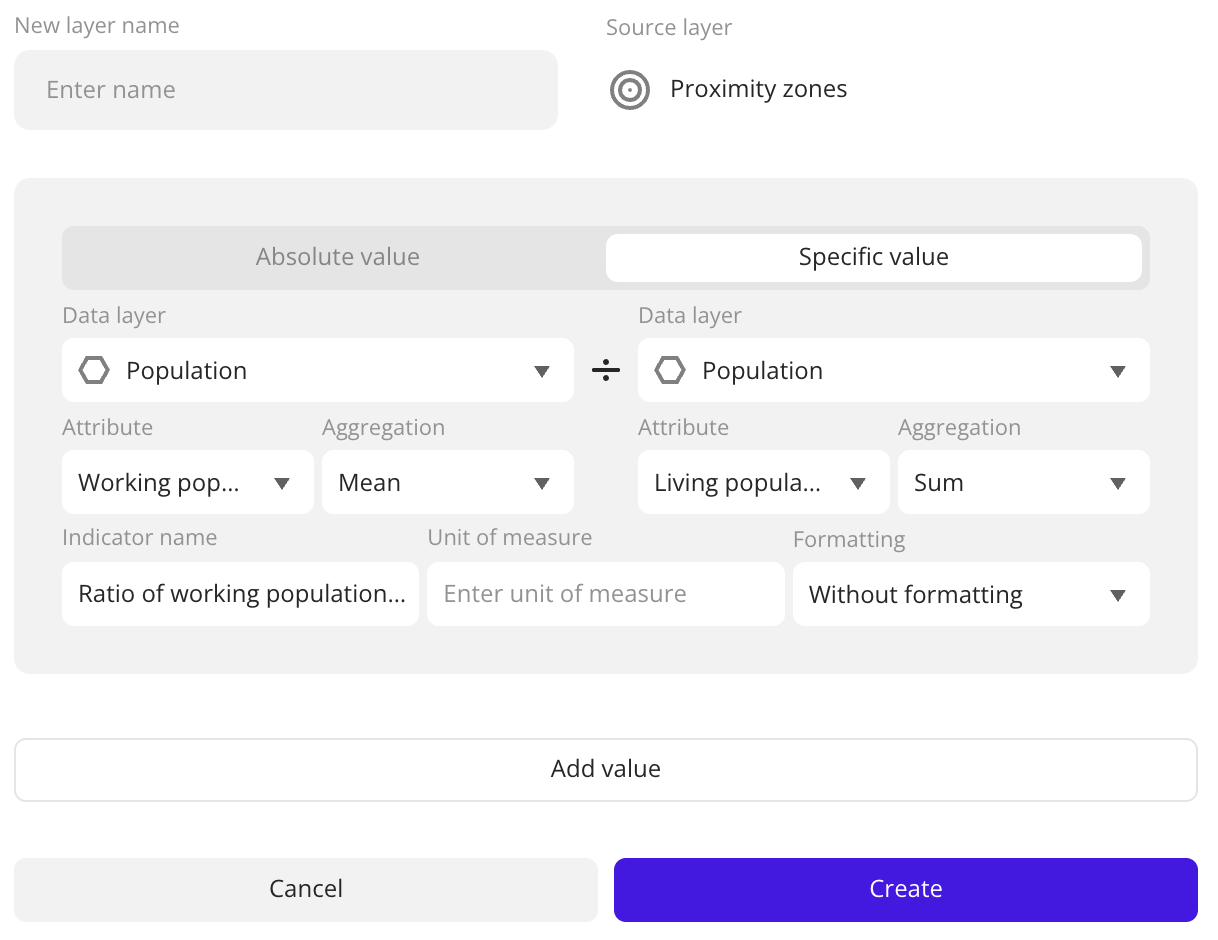
- Specific value: ratio of two absolute values. Usage example: calculate the ratio of working population to living population.
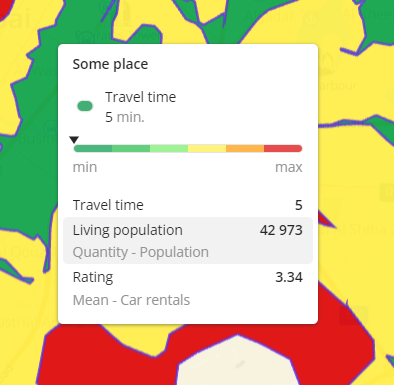
When you aggregate data, a new layer with the Polygon visualization method is created. When you calculate the absolute value, the layer contains the aggregation attribute values calculated using the selected aggregation function for each area object. When you calculate the specific value, the layer contains the ratio of the values of two aggregation attributes. To view the resulting values in the tooltip, hover over an area object (polygon or proximity zone):
Creating a layer with aggregated data
-
Create a layer with data you want to aggregate.
For example, if you want to aggregate data about residents, create a layer from the Population dataset.
-
Create a layer with area objects: with the Polygon or Proximity zones visualization method.
Both layers (with data and with area objects) must be within one dashboard scene.
-
Go to the Dashboards tab and open the dashboard.
-
Open a scene using the arrows
 and
and  . If there is only one scene in the dashboard, it opens automatically.
 -
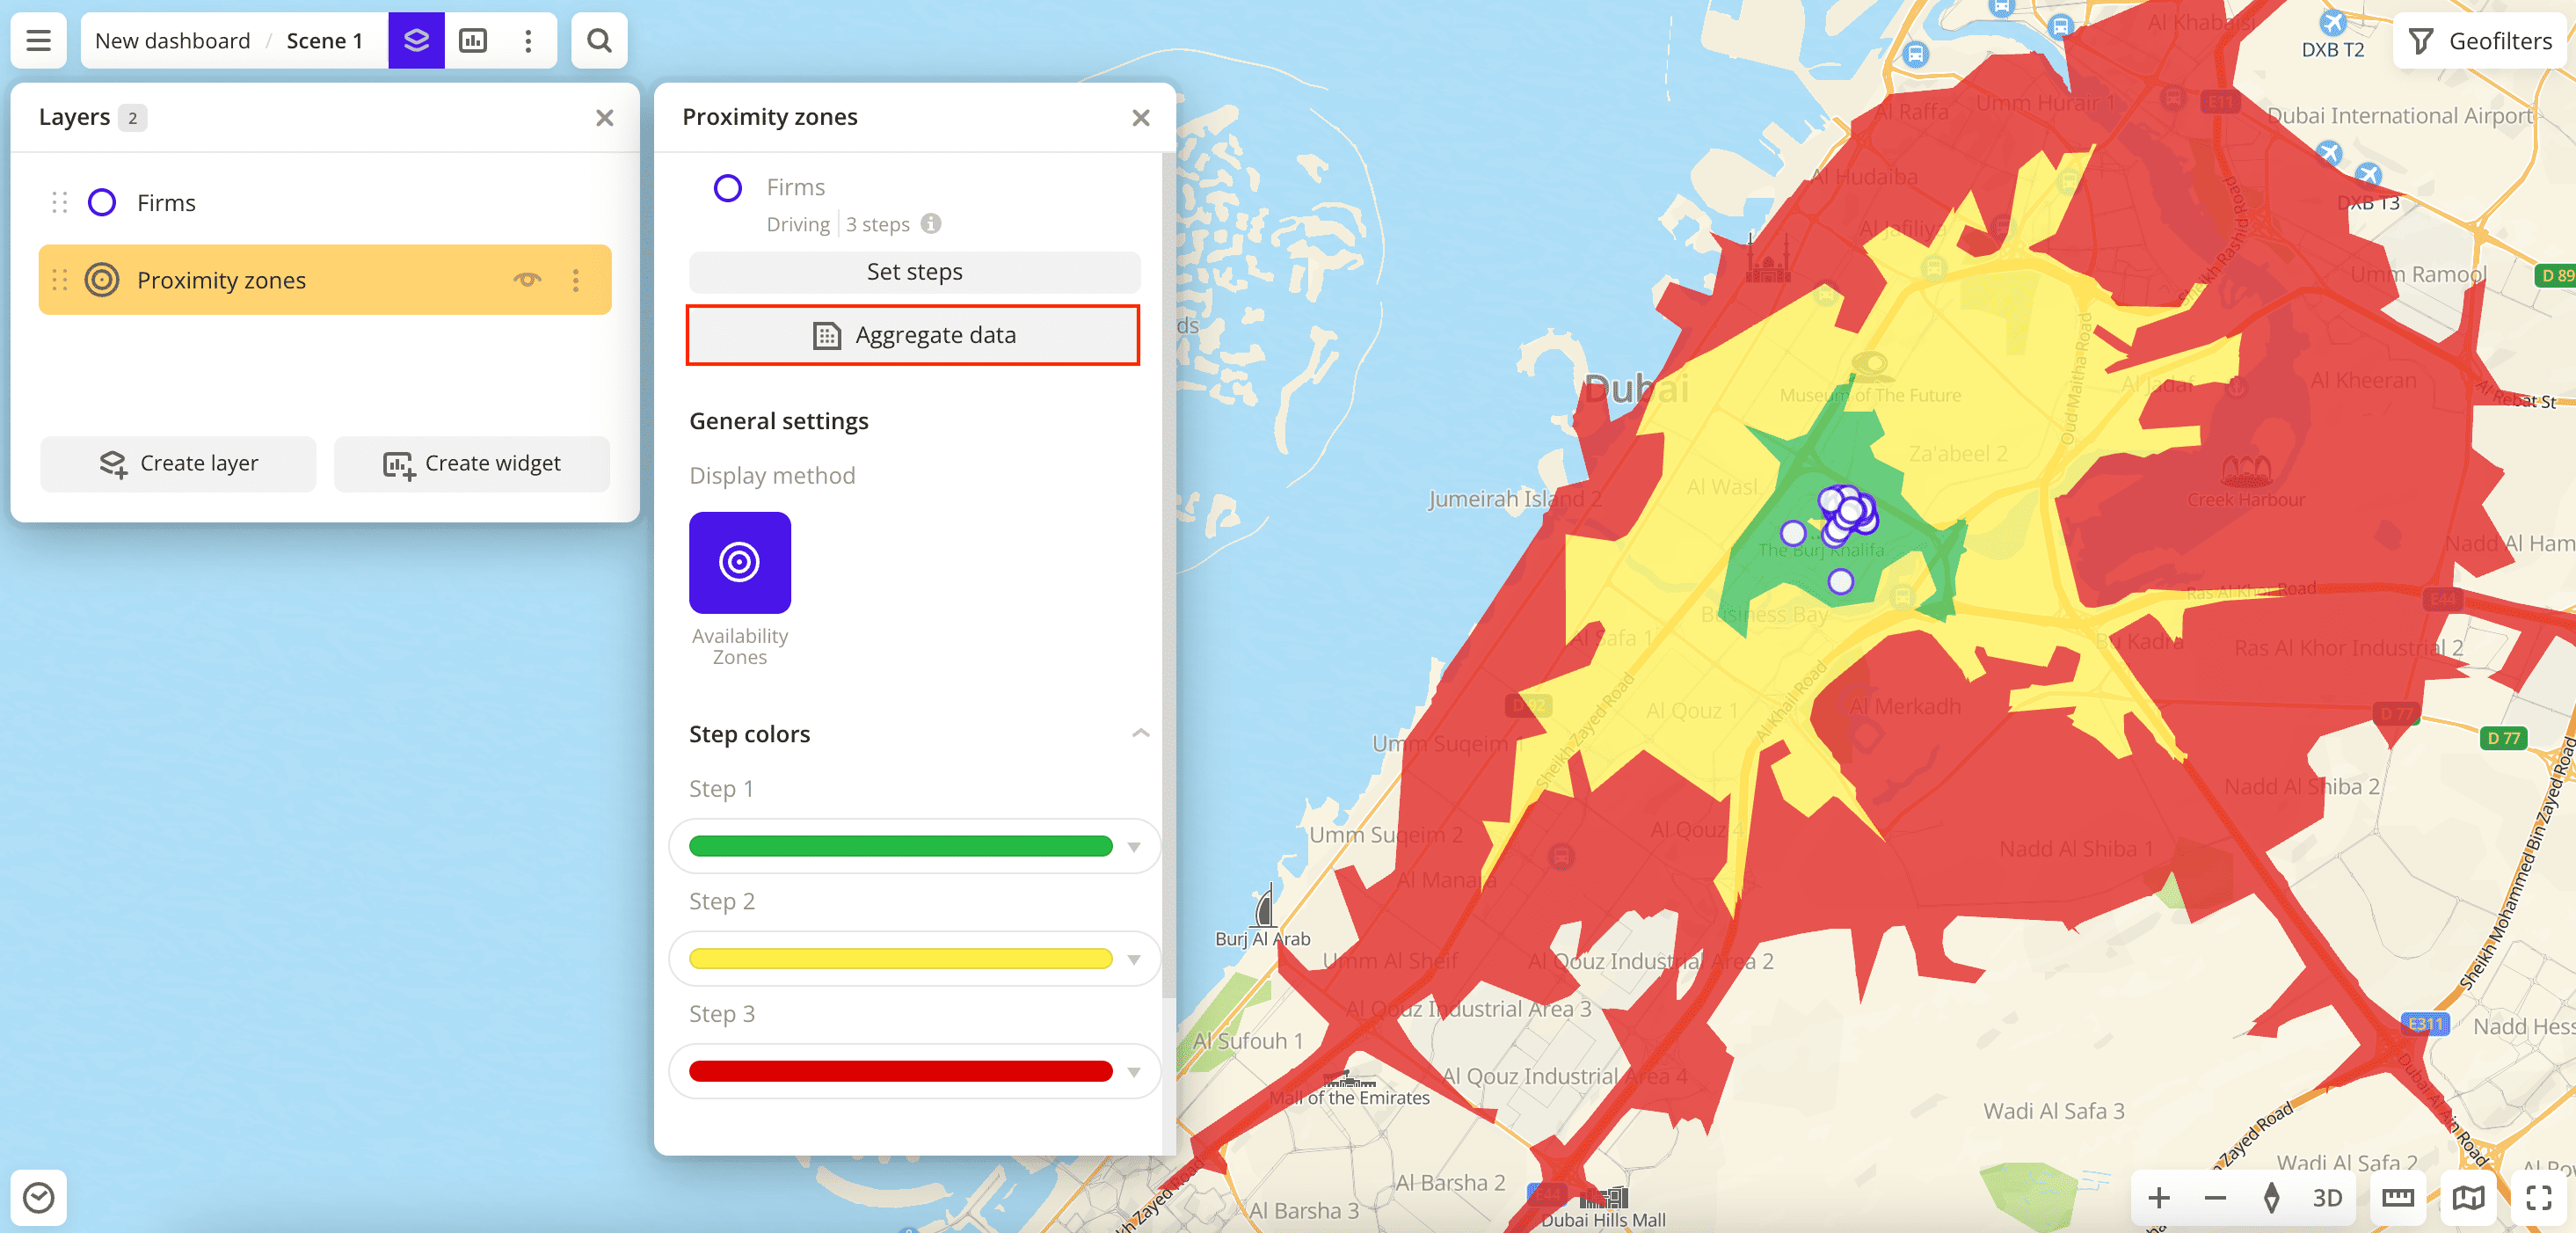
In the top menu of the dashboard, click
 icon and select the layer with area objects.
 -
Click Aggregate data.
-
Specify aggregation parameters.
-
To add another aggregation attribute, click Add value. You can add up to 20 attributes in a single layer.
-
Click Create.
A new layer is created and automatically added to the selected dashboard scene. If necessary, you can configure visualization for the layer.
Parameters
| Parameter | Description |
|---|---|
| New layer name | Name of the new layer with aggregated data. |
| Source layer | Layer with area objects. |
| Value type | Type of aggregated value:
|
| Data layer | Data layer that contains an aggregation attribute. To calculate the specific value, you can select different layers. |
| Attribute | Attribute used to aggregate data and calculate the values. |
| Aggregation | Function used to calculate aggregation attribute values:
|
| Indicator name | Name of the aggregation attribute displayed in the polygon tooltip and in the card when you click the polygon on the map. Changing the indicator name does not rename the attribute in the dataset. |
| Unit of measure (for specific values) | Unit of measurement of the aggregation attribute. Displayed in the polygon tooltip after the attribute value. |
| Formatting | Format of the aggregation attribute value displayed in the tooltip. Available formats:
|
What's next?
- Getting started.
- Get to know how to work with Data.
- Get to know how to build Proximity zones.
- Learn more about Layers, Dashboards, Scenes, and Widgets.
- Get to know more about other Data visualization methods.
- Learn about ready-made Analytics scenarios.