Overview
In the 2GIS Pro service, you can work with sets of prepared built-in data and your own data: uploaded as a file and uploaded via API.
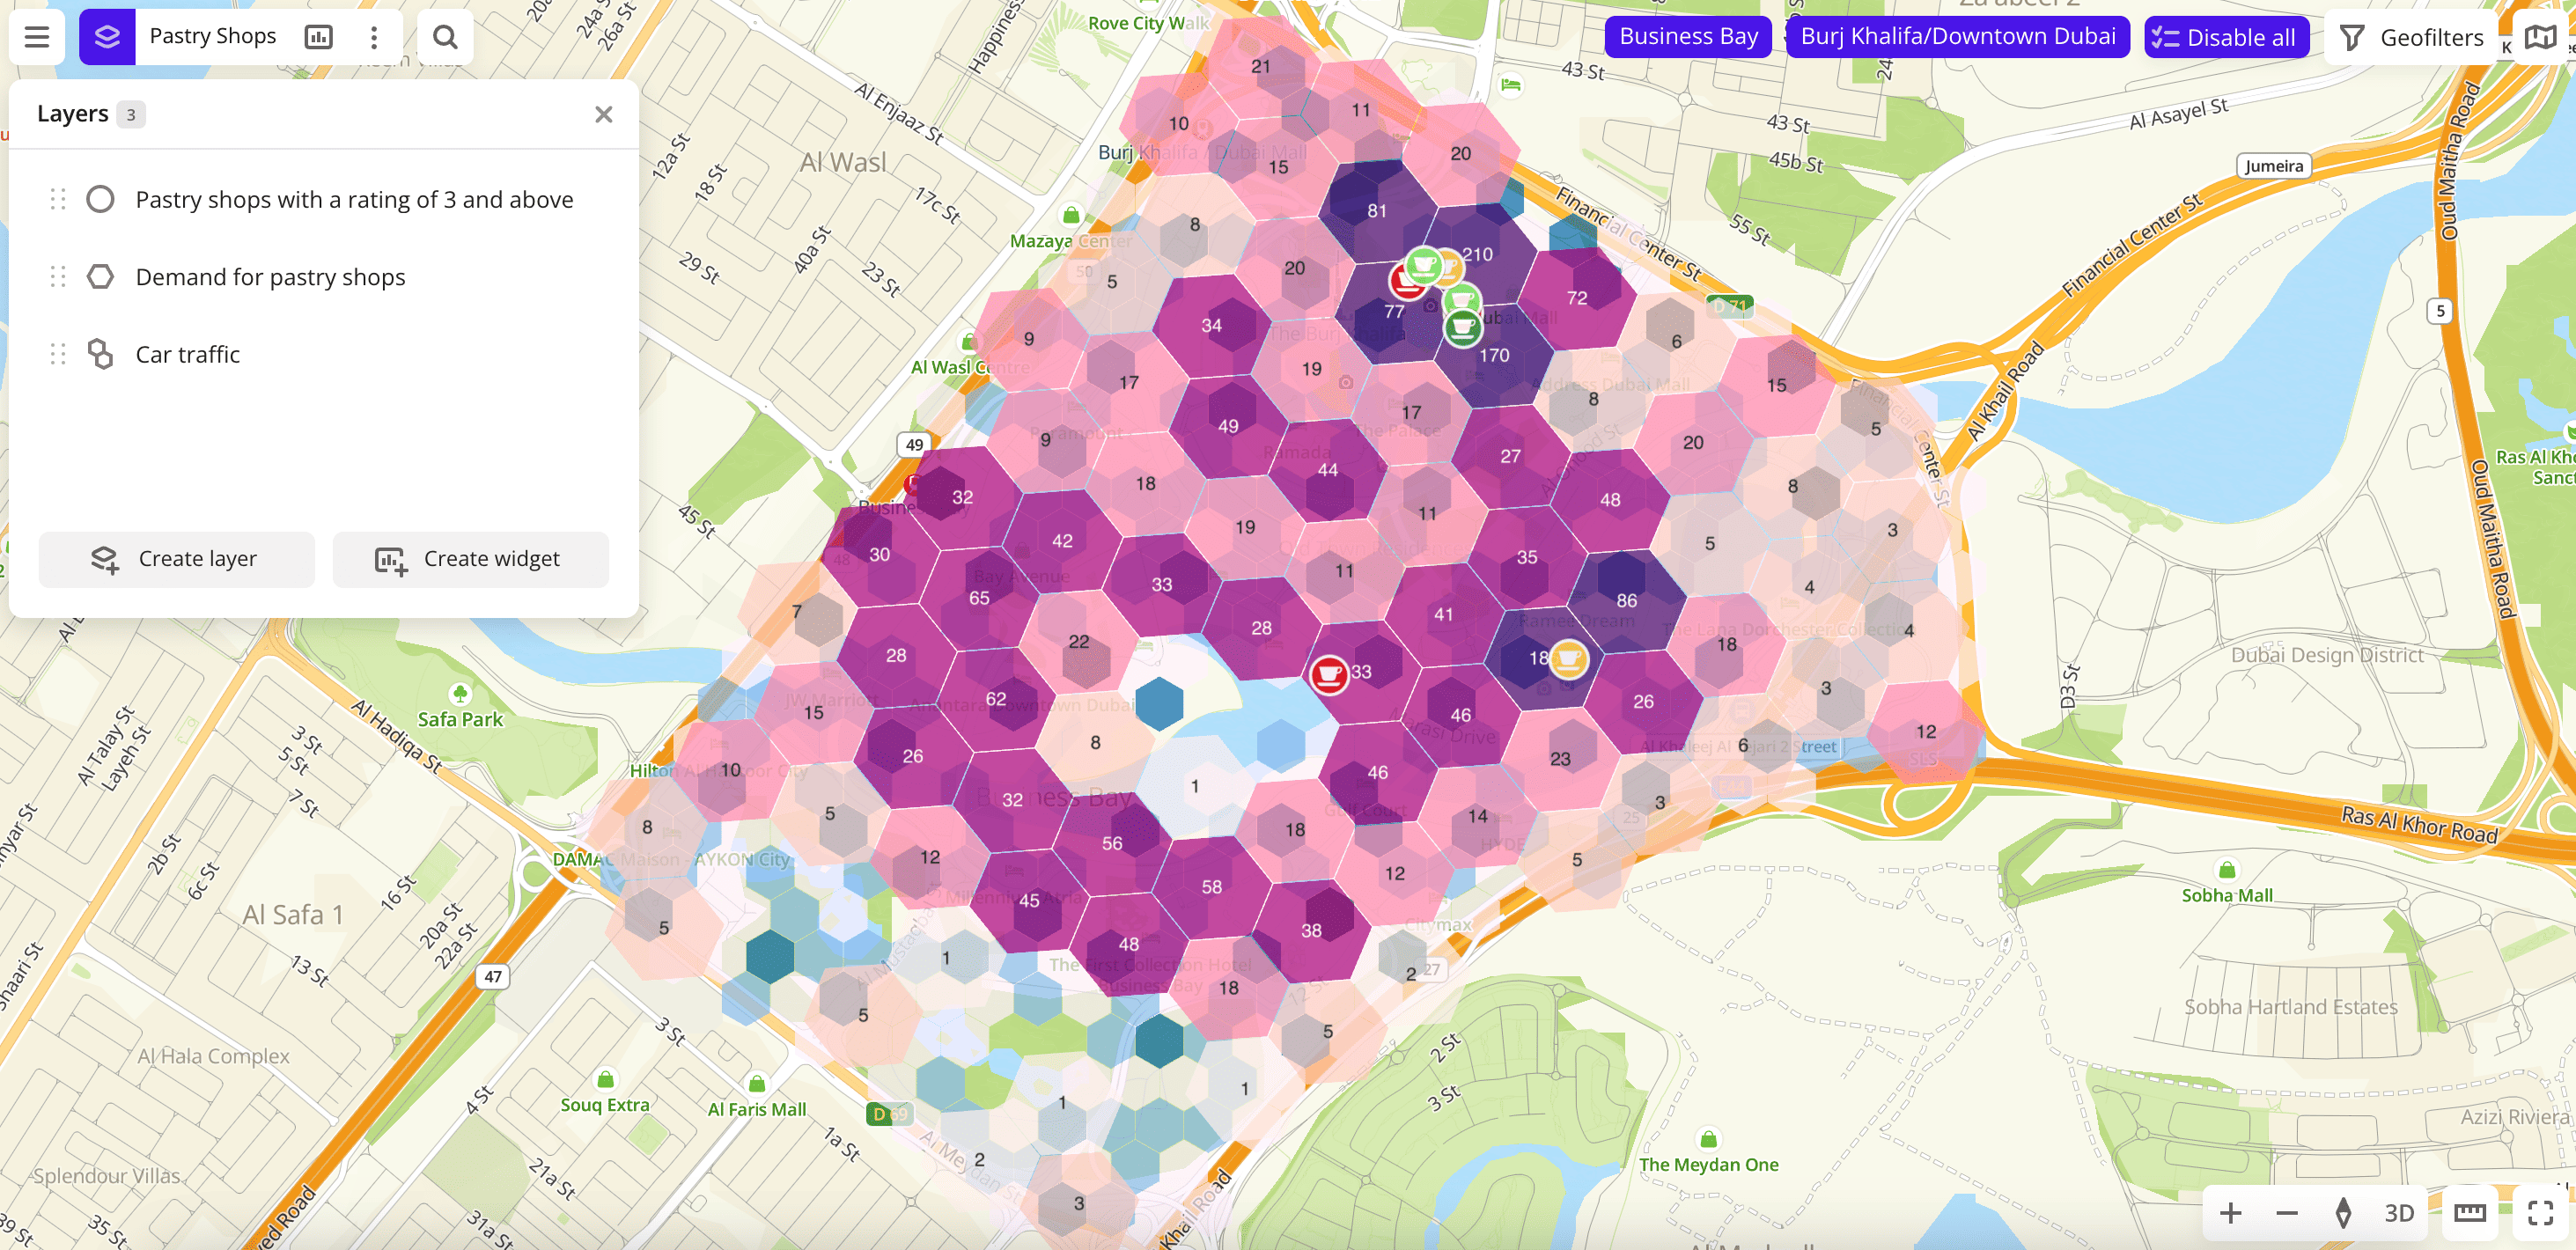
Built-in and uploaded datasets are available on the Main and Data tabs.
Built-in 2GIS data
Available datasets based on 2GIS data:
- Age-sex composition of the population
- Audience activity
- Buildings
- Car traffic: aggregated and detailed
- Commercial real estate
- Demand
- Dynamics of organizations
- Firms
- Location attractiveness
- Parkings
- Pedestrian traffic
- Population
- Population well-being
- Public transport stops
- Residential real estate
- Terminals and ATMs
- Territorial division
- Tourist potential
- Urban environment
Available territories
Built-in data is available for the following countries (there may be exceptions for certain datasets):
- Azerbaijan
- Armenia
- Belarus
- Georgia
- Kazakhstan
- Kyrgyzstan
- Russia
- Uzbekistan
The data may not be available throughout the entire country, but only in populated areas where 2GIS is present. To check data availability, use geofilters or contact technical support.
Usage scenarios
To solve analytical problems, you can create different data samples from each dataset. This can be useful when you need to retain only particular data in the dataset for your operations.
A sample contains data from the dataset filtered by territories and other parameters. You can create layers based on samples for data visualization.
Base scenario for working with data
-
Select a built-in dataset or upload your own data.
-
Filter the data by territories by specifying geofilters. Using geofilters is mandatory for creating a data sample and a layer.
As geofilters, you can use standard territories, custom uploaded territories, and also build polygons, proximity zones, and circles on the map. For more information, see the Geofilters section.
-
Filter the data by other available parameters, depending on the dataset.
-
Save the resulting data sample by creating a layer based on it for further data visualization and widget creation.
For more information, see the Getting started section.
Modifying data sample
After creating a layer, you can modify the data sample:
- Apply geofilters (filters by territories) to the source data.
- Apply filters by parameters to the source data.
- Edit filtering results manually by removing certain objects.
All layers and widgets created from this data sample automatically reflect the changes. Any changes to the sample do not delete the data in the dataset.
For more information, see the Modifying data sample instruction.
Filtering when working with a dashboard
When working with a dashboard, you can apply additional filtering to the data sample. To display only part of the data on dashboard scenes, you can filter data from the sample:
- by territories: through geofilters
- by data attributes: through charts in widgets and through the Slice Filter widget
- by date and time: through the Timeline widget
The original data sample remains unchanged.
For more details, see the Filtering data on a scene instruction.
Getting started
-
Go to the Main or Data tab.
-
Select the required category of the built-in data or the uploaded dataset.
You can use the search to specify the output of data. Search results may include information about organizations and data from other categories.
-
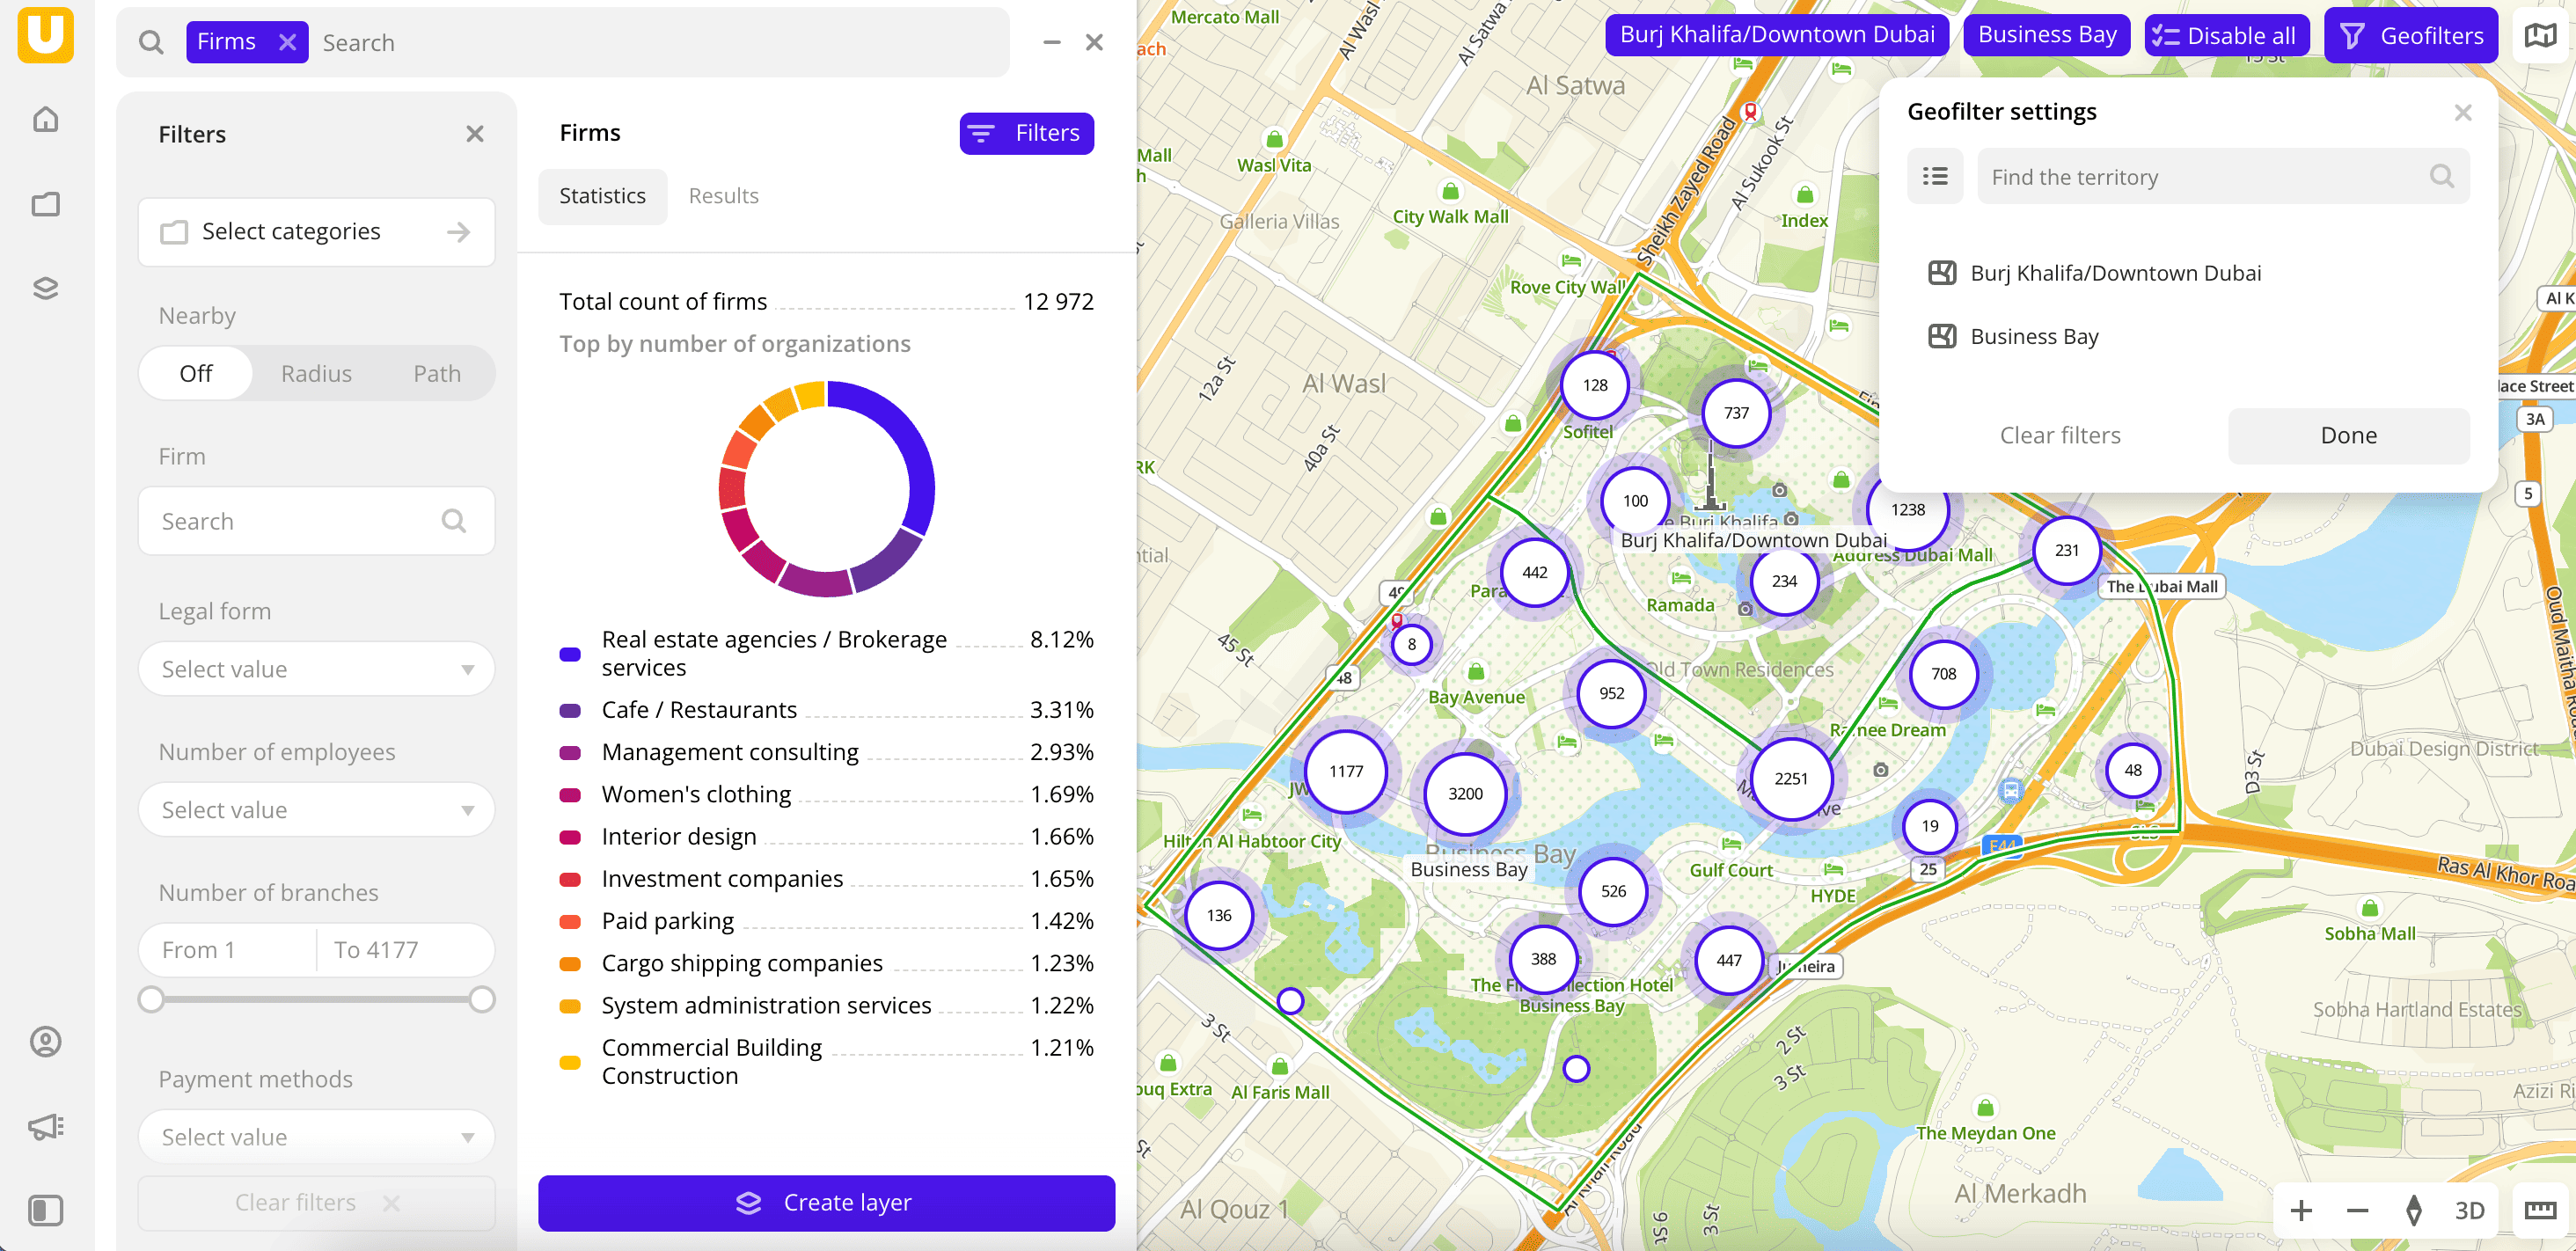
In the Geofilter settings dialog, select up to 50 territories for which the data sample is created. You can use standard and custom territories and also build polygons, proximity zones, and circles on the map. For more information, see the Geofilters section. After you select the territories, click Done.
-
If you selected the Pedestrian traffic built-in dataset or uploaded data that contains geometries of the line or polygon type, you can select the data display method at the top of the Filters tab:
- Points: display as centroid points (the centers of the object geometries).
- Geometries: display as real data geometries (lines or polygons).
In other datasets, only the Points display method is available.
-
On the Filters tab, set the remaining filters if necessary. Available filters depend on the source data. See a list of filters for built-in data in the description of each dataset, e.g., Firms.
The data is displayed on the map. Filtering results are also displayed next to the Filters tab.
To save this data sample and customize its visualization (e.g., as a heatmap), click Create layer.
Geofilters
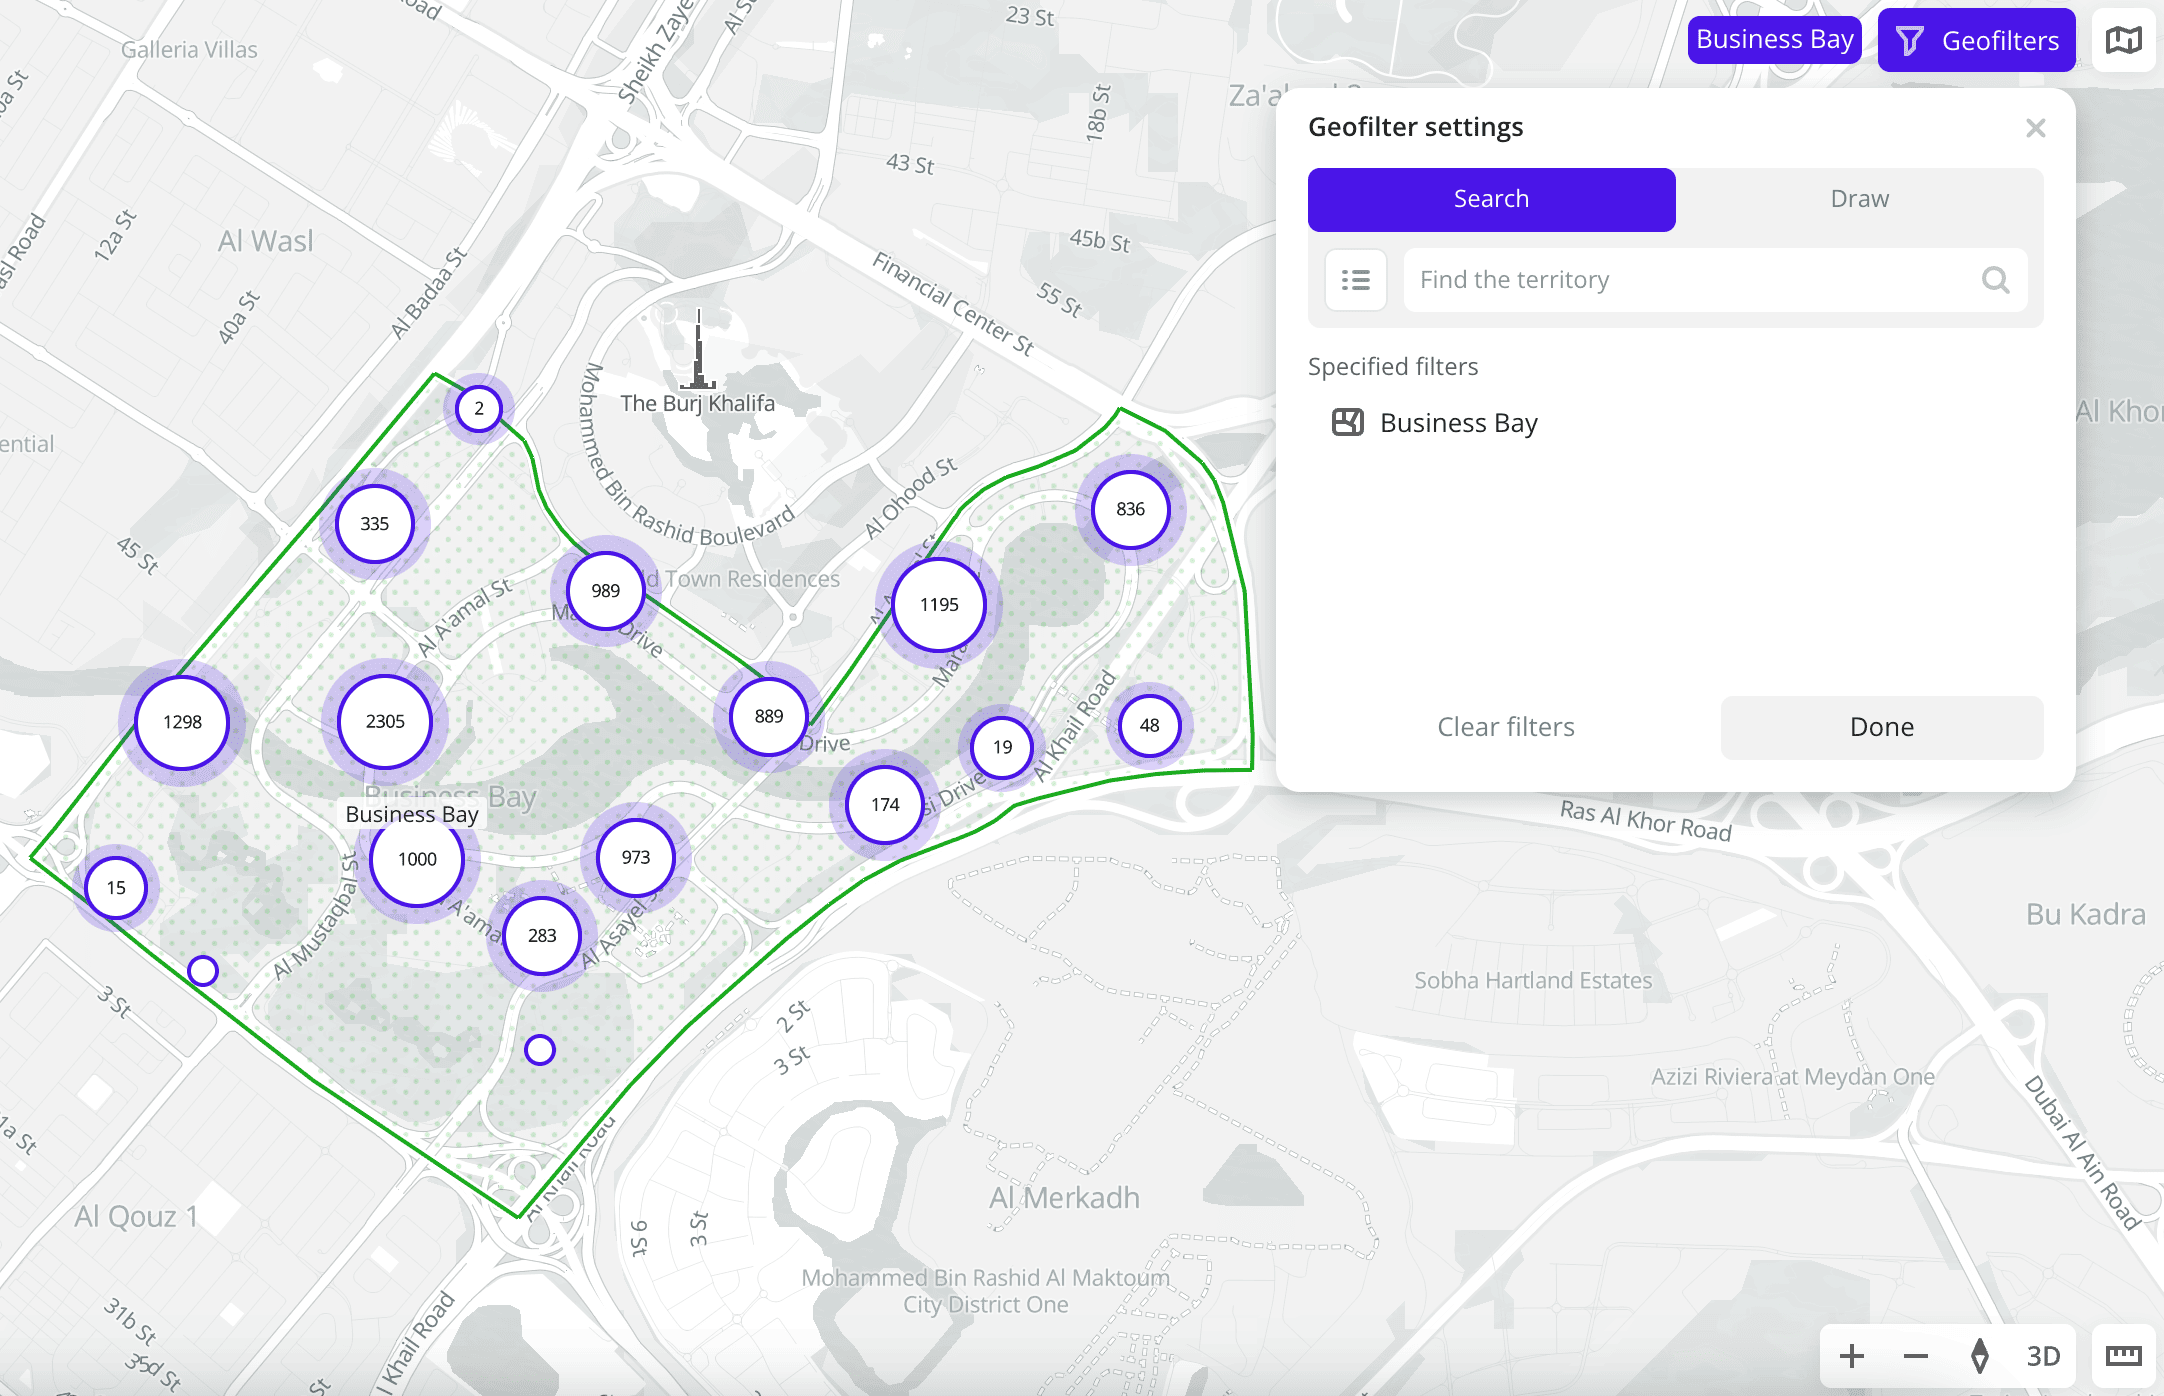
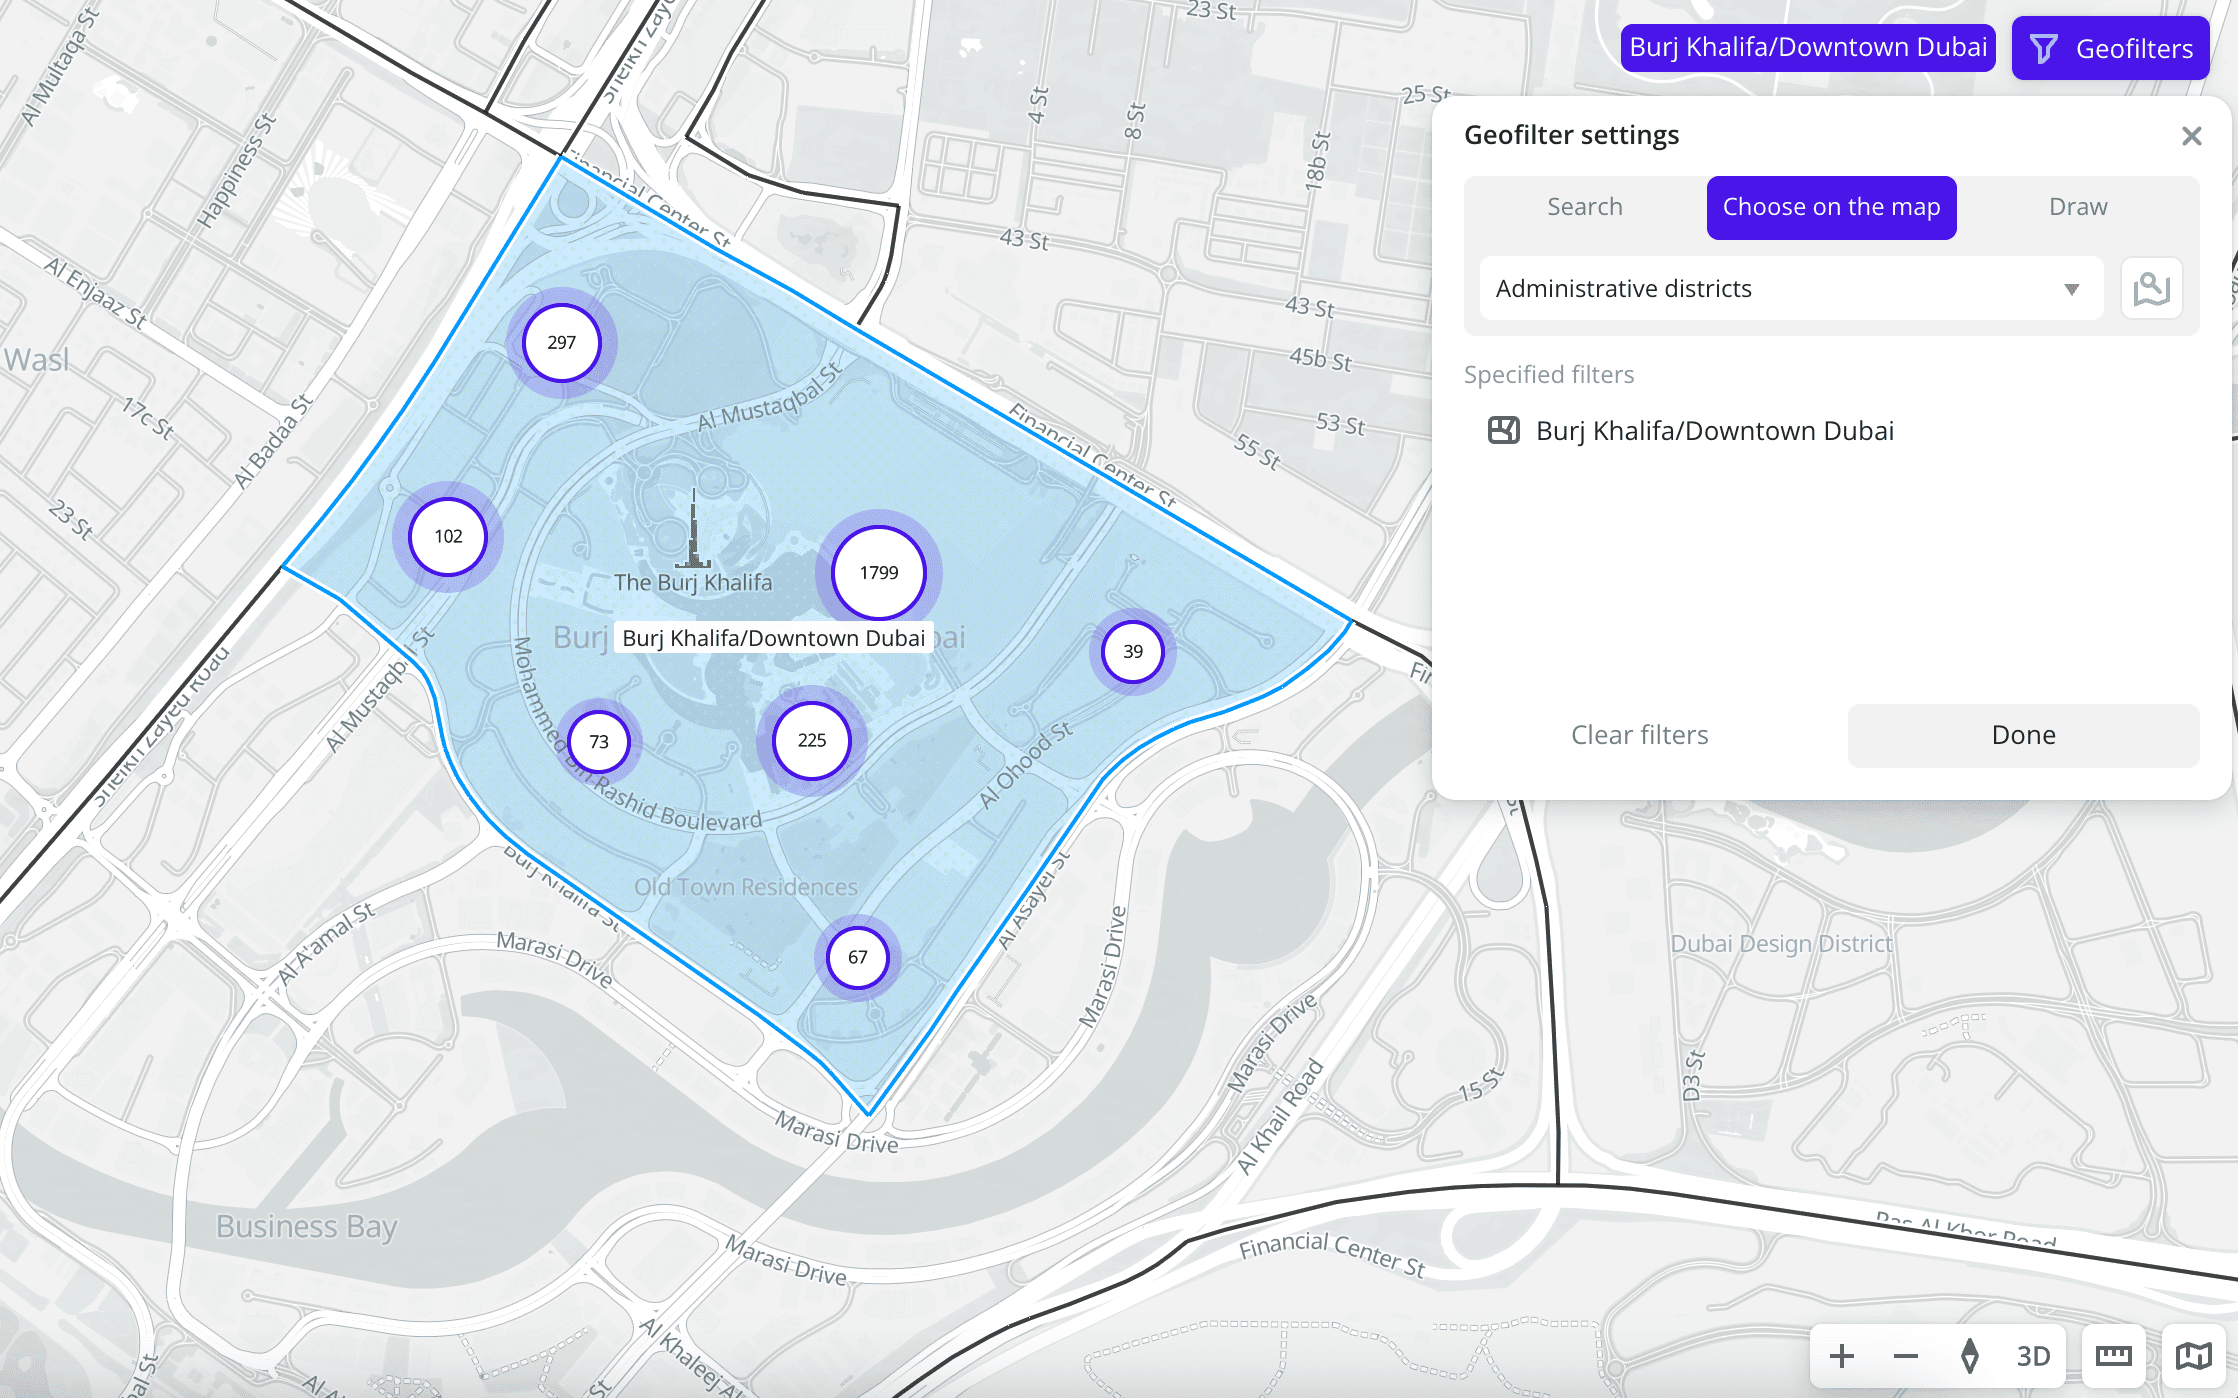
To create data samples, you can filter data by territories using different types of geofilters in the Geofilter settings dialog. For each sample, you can select up to 50 territories.
If you use the demo tariff plan, you can select no more than three geofilters within one dashboard scene.
Geofilter types
-
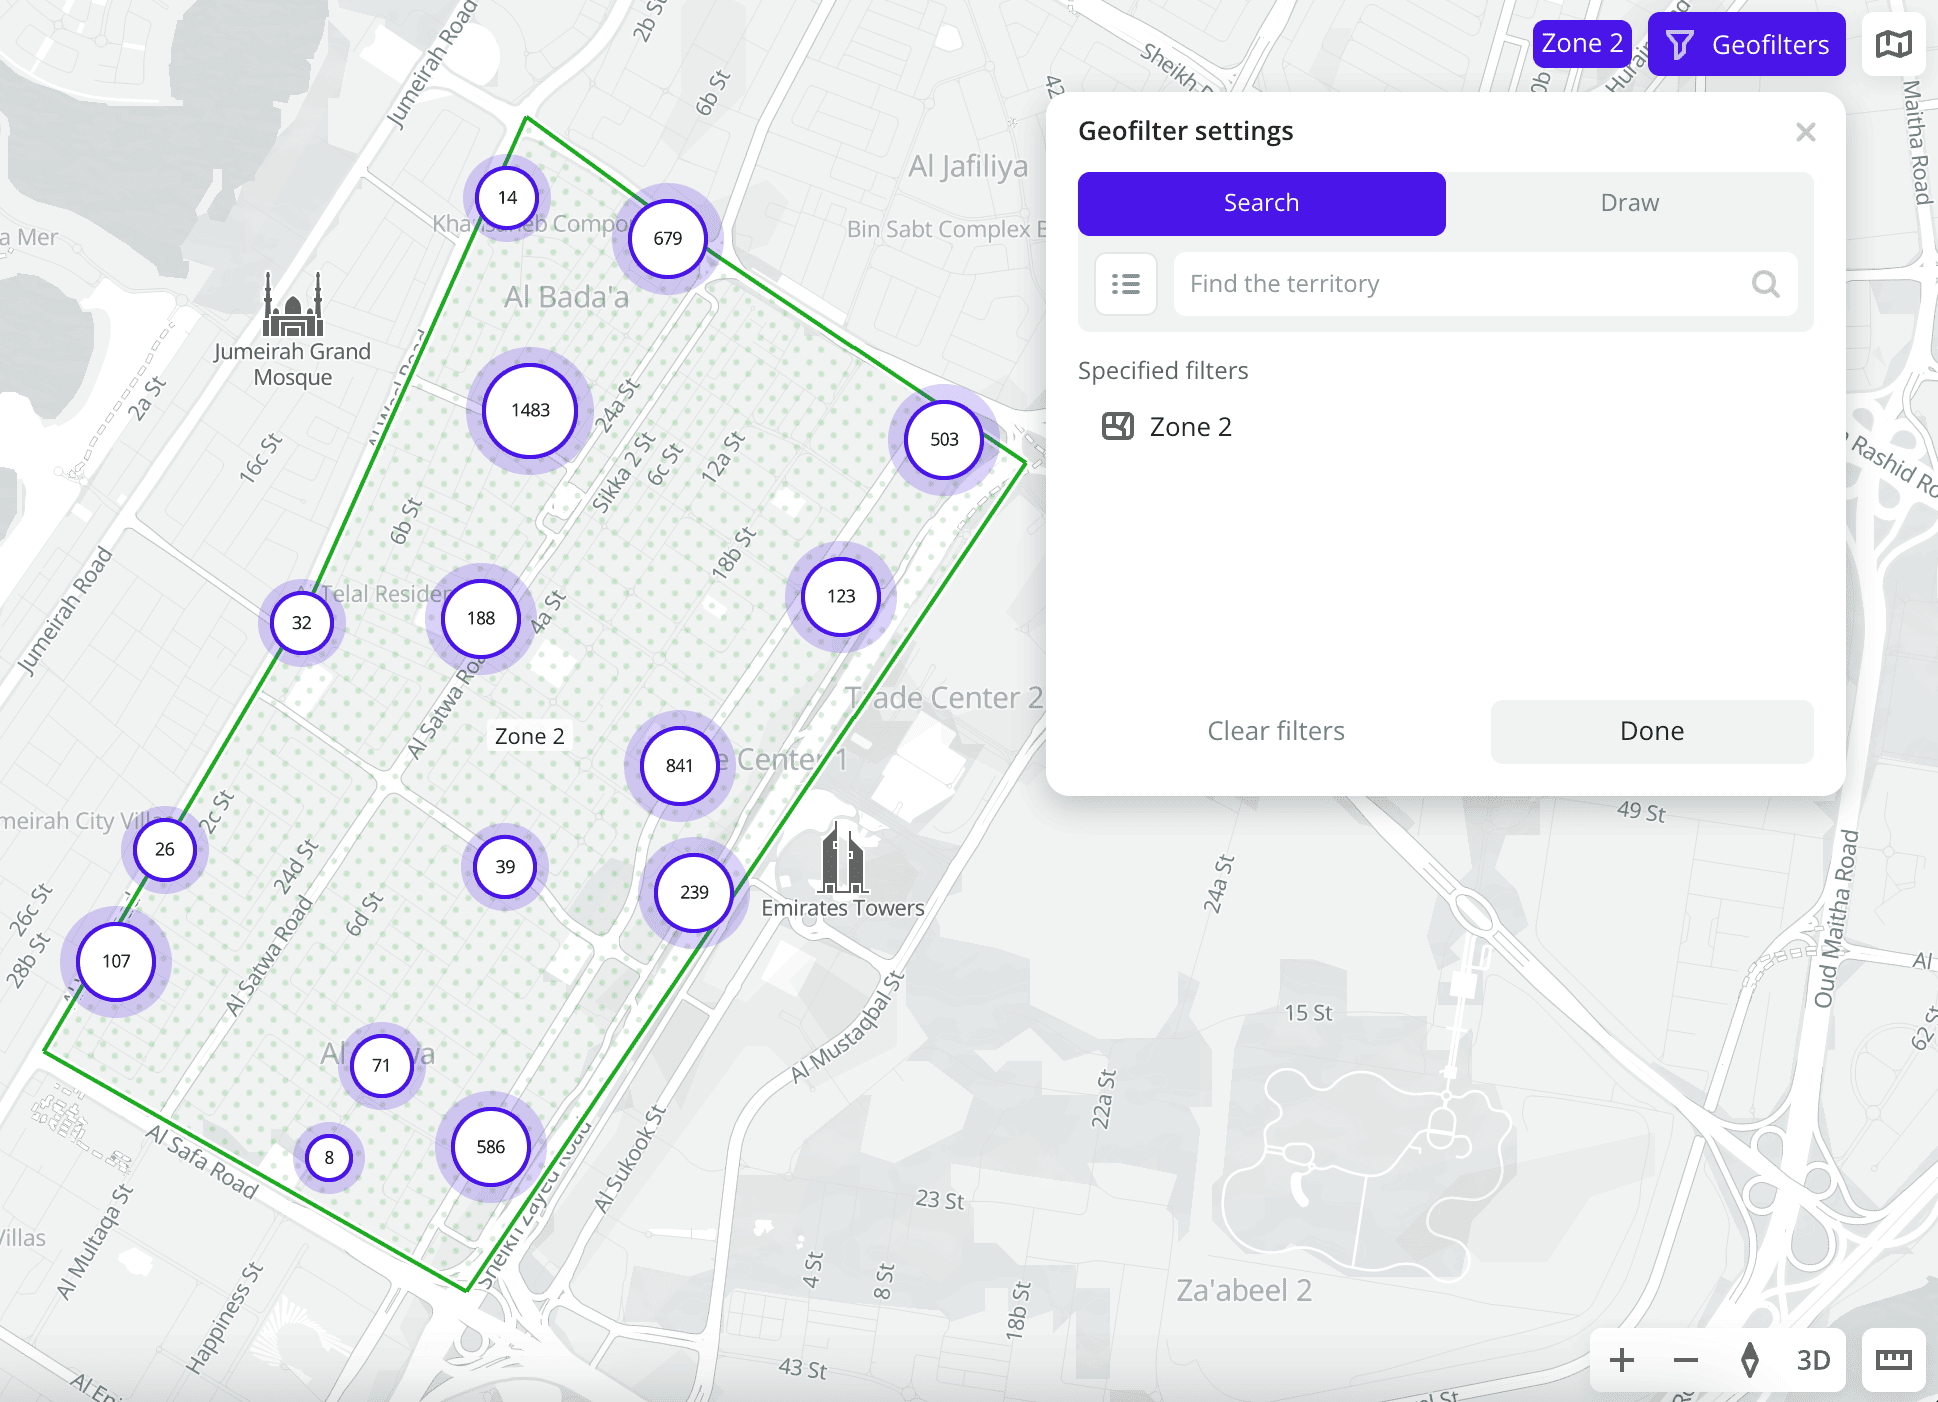
Standard territories: regions, districts, settlements, and others. By default, territories within the current map viewport are suggested for selection. Depending on the tariff, some territories may not be available. You can either use the search by standard territories or select them on the map by clicking them.
To find standard territories, go to the Search tab and use the search by names. You can specify search filters (for example, search only for regions). An example of creating a geofilter by a standard territory via search:
To select a territory on the map, go to the Choose on the map tab, specify the division of territories on the map (for example, show only administrative districts), and click on the territory. An example of creating a geofilter by a standard territory via clicking the map:
-
Custom territories: first upload your own dataset with polygons and create a territory filter. To select your own territory, go to the Search tab and use the search by the territory names that you specified in
propertieswhen uploading the dataset: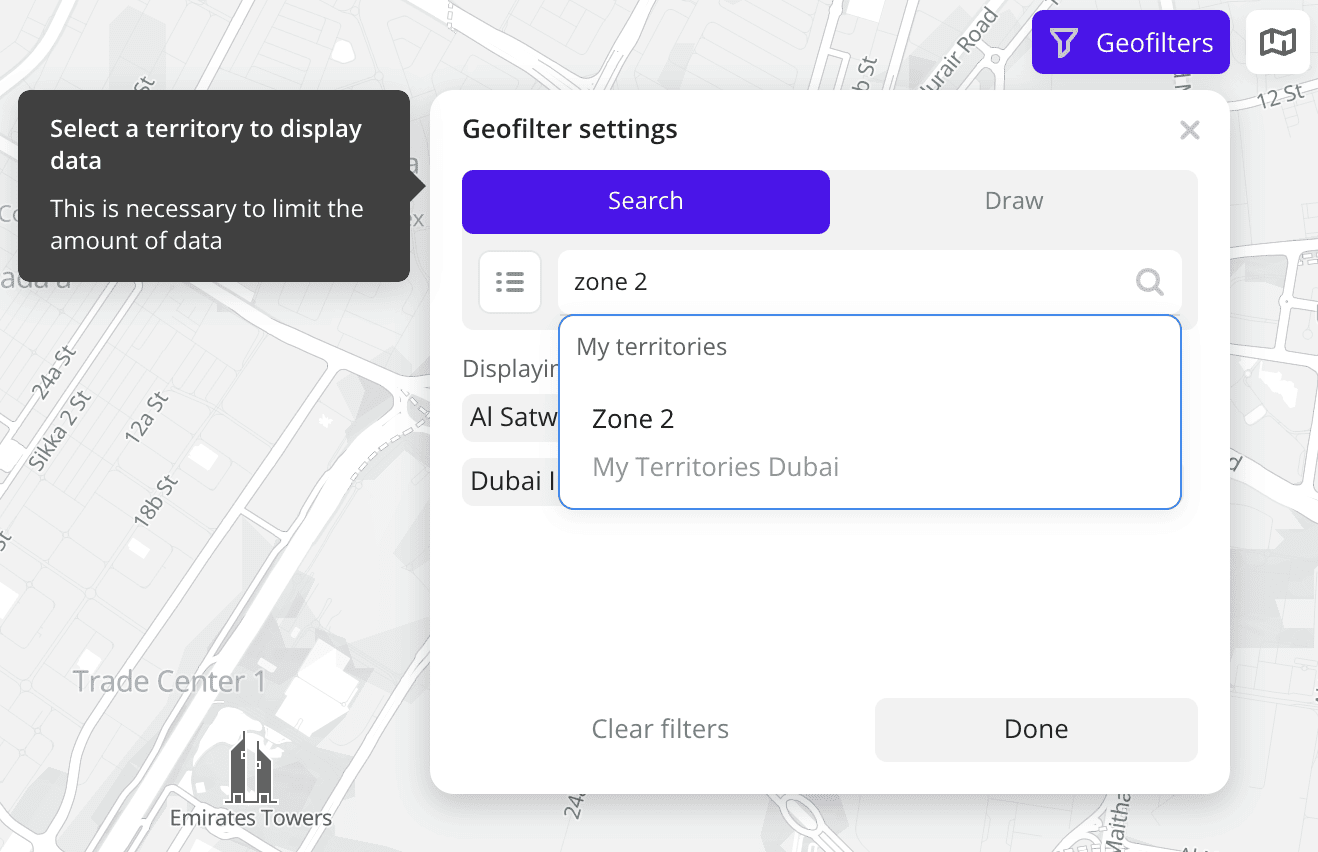
An example of creating a geofilter by a custom territory:
-
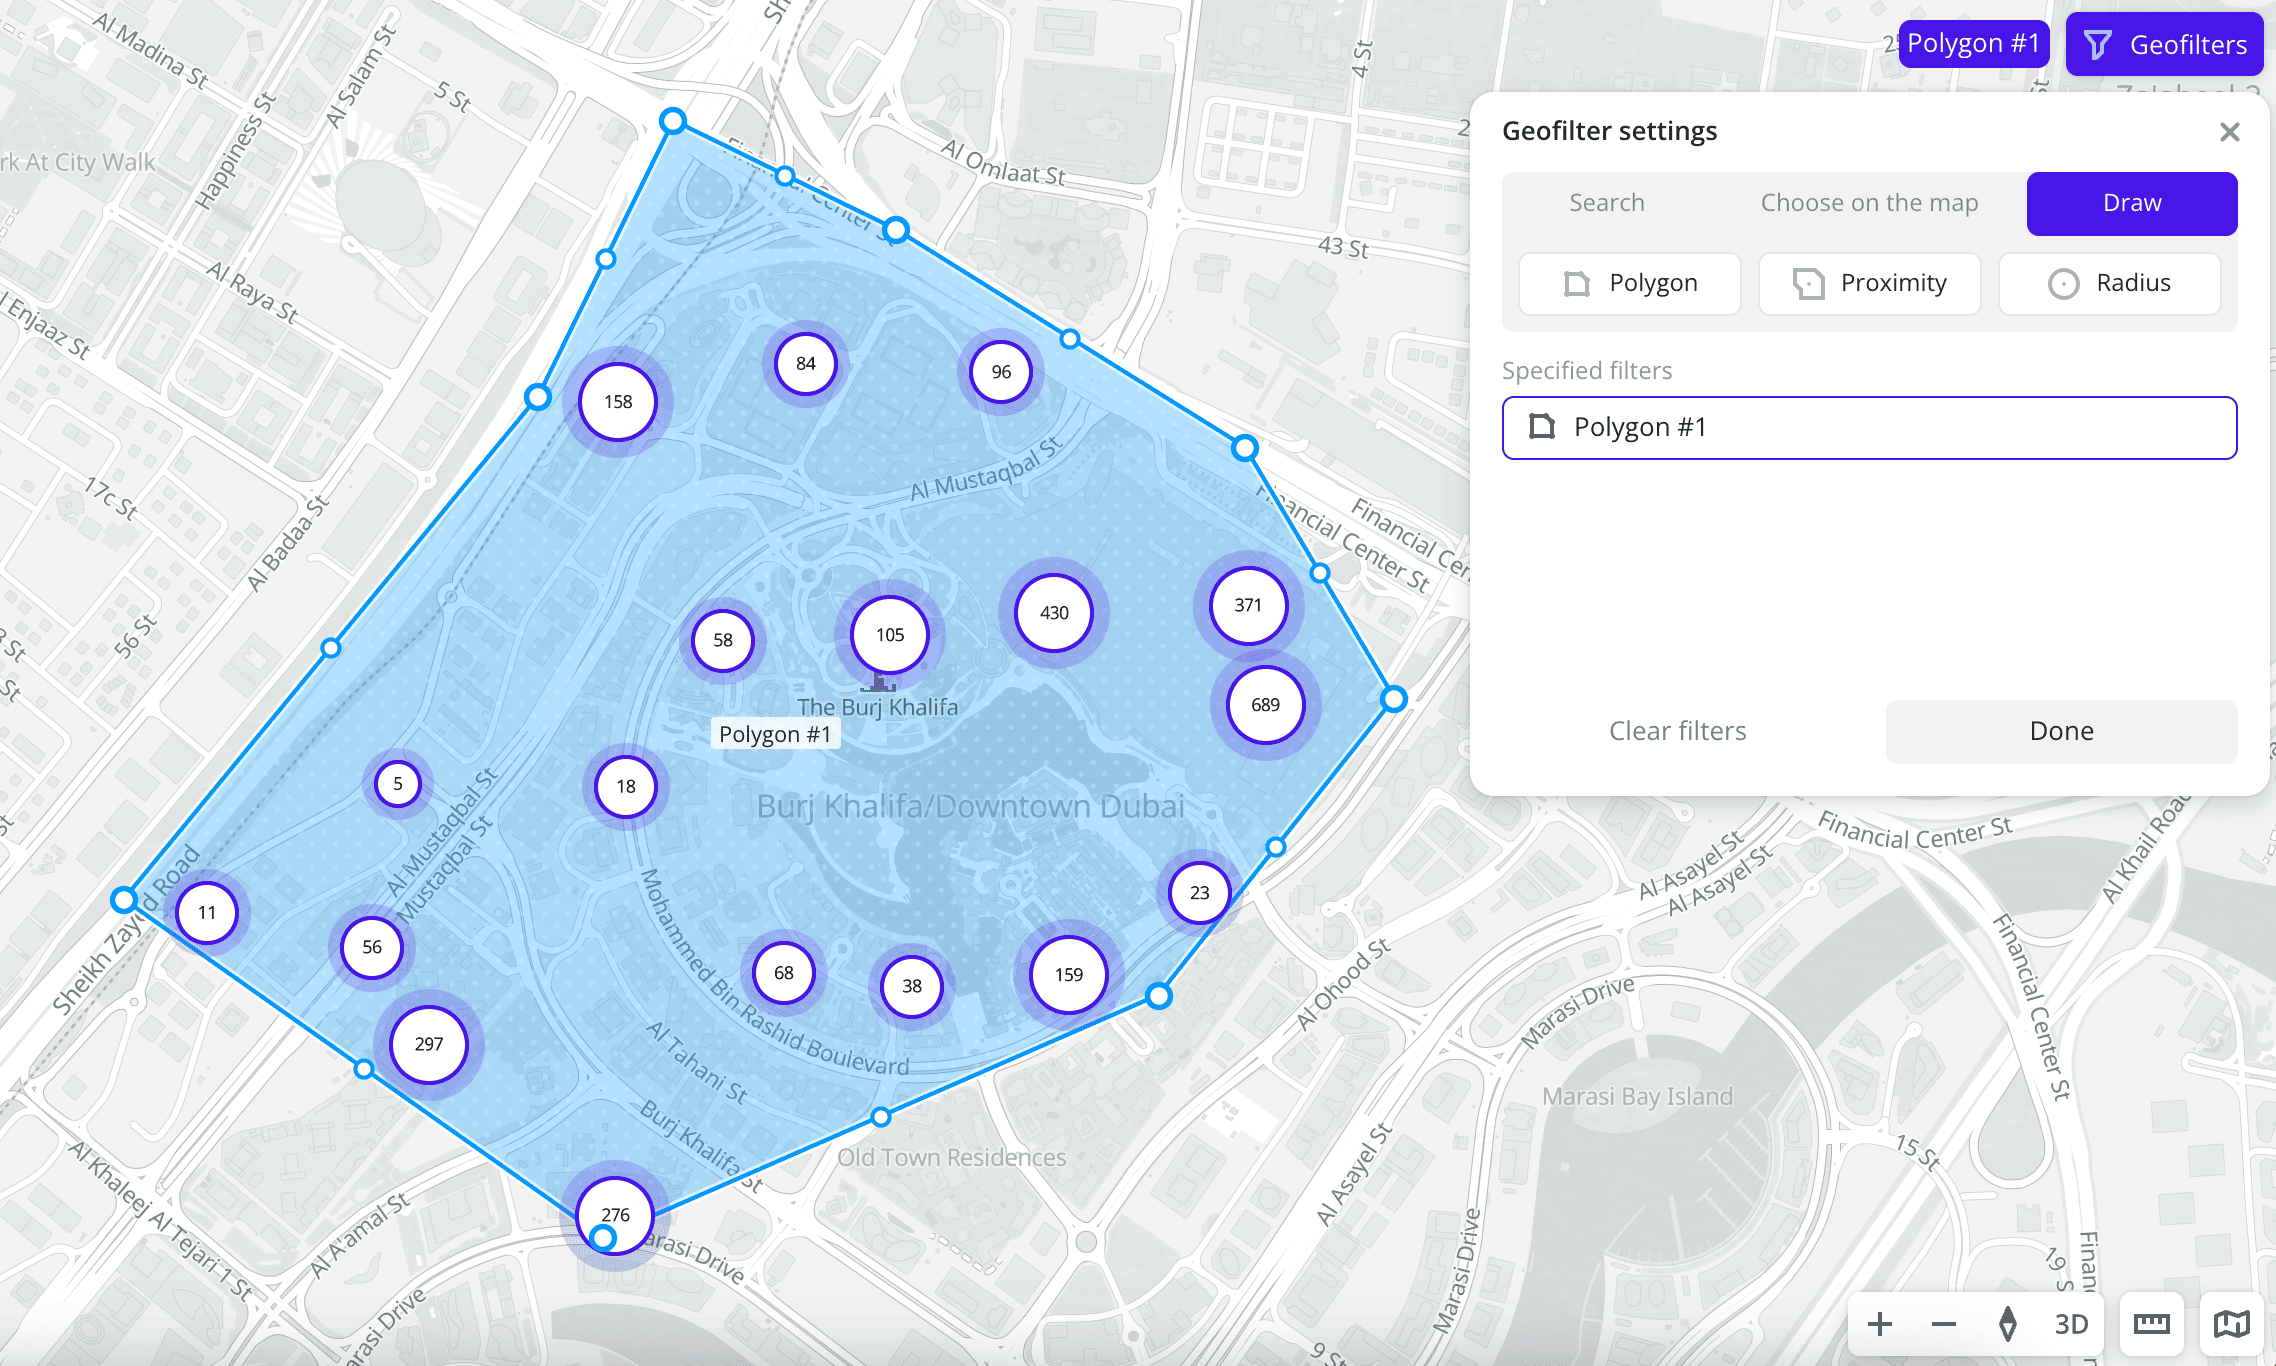
Polygons: arbitrary areas on the map. To build a polygon, go to the Draw tab and click Polygon. Place at least three points on the map. The points are connected automatically, and the polygon lines must not intersect. To close the polygon, connect the starting and ending points. To move a point, click and drag it to the required place on the map.
An example of creating a geofilter by a polygon:
-
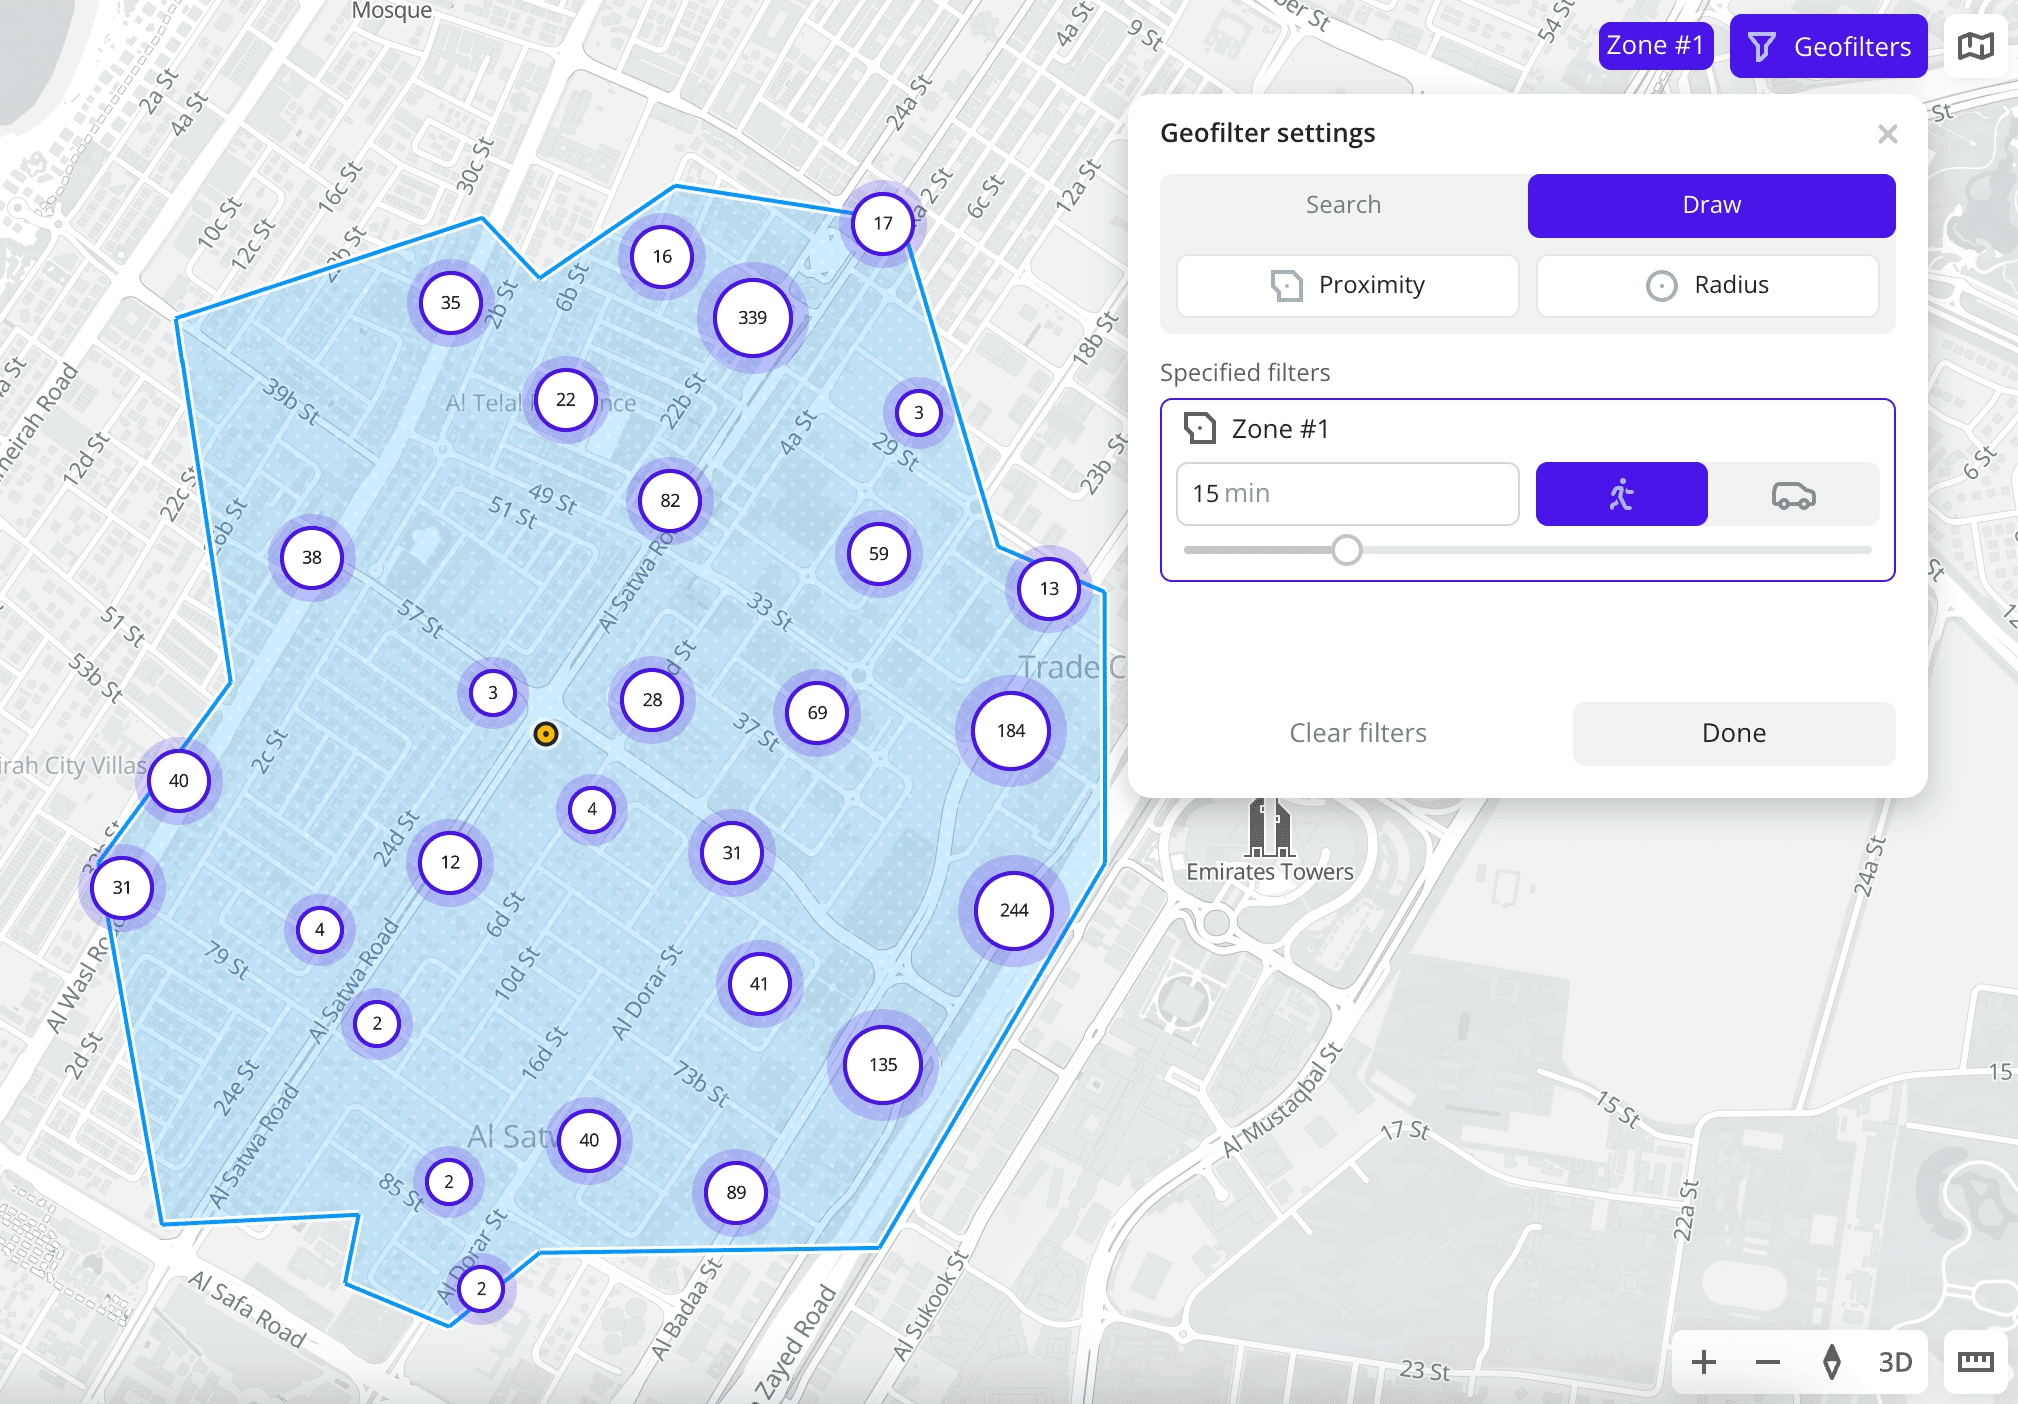
Proximity zones: areas on the map with the boundaries that can be reached on foot or by car within a certain period. To build a proximity zone, go to the Draw tab and click Proximity. Click a point on the map to build the area around it, specify the method of transportation, and the time from
1to60minutes.An example of creating a geofilter by a proximity zone:
-
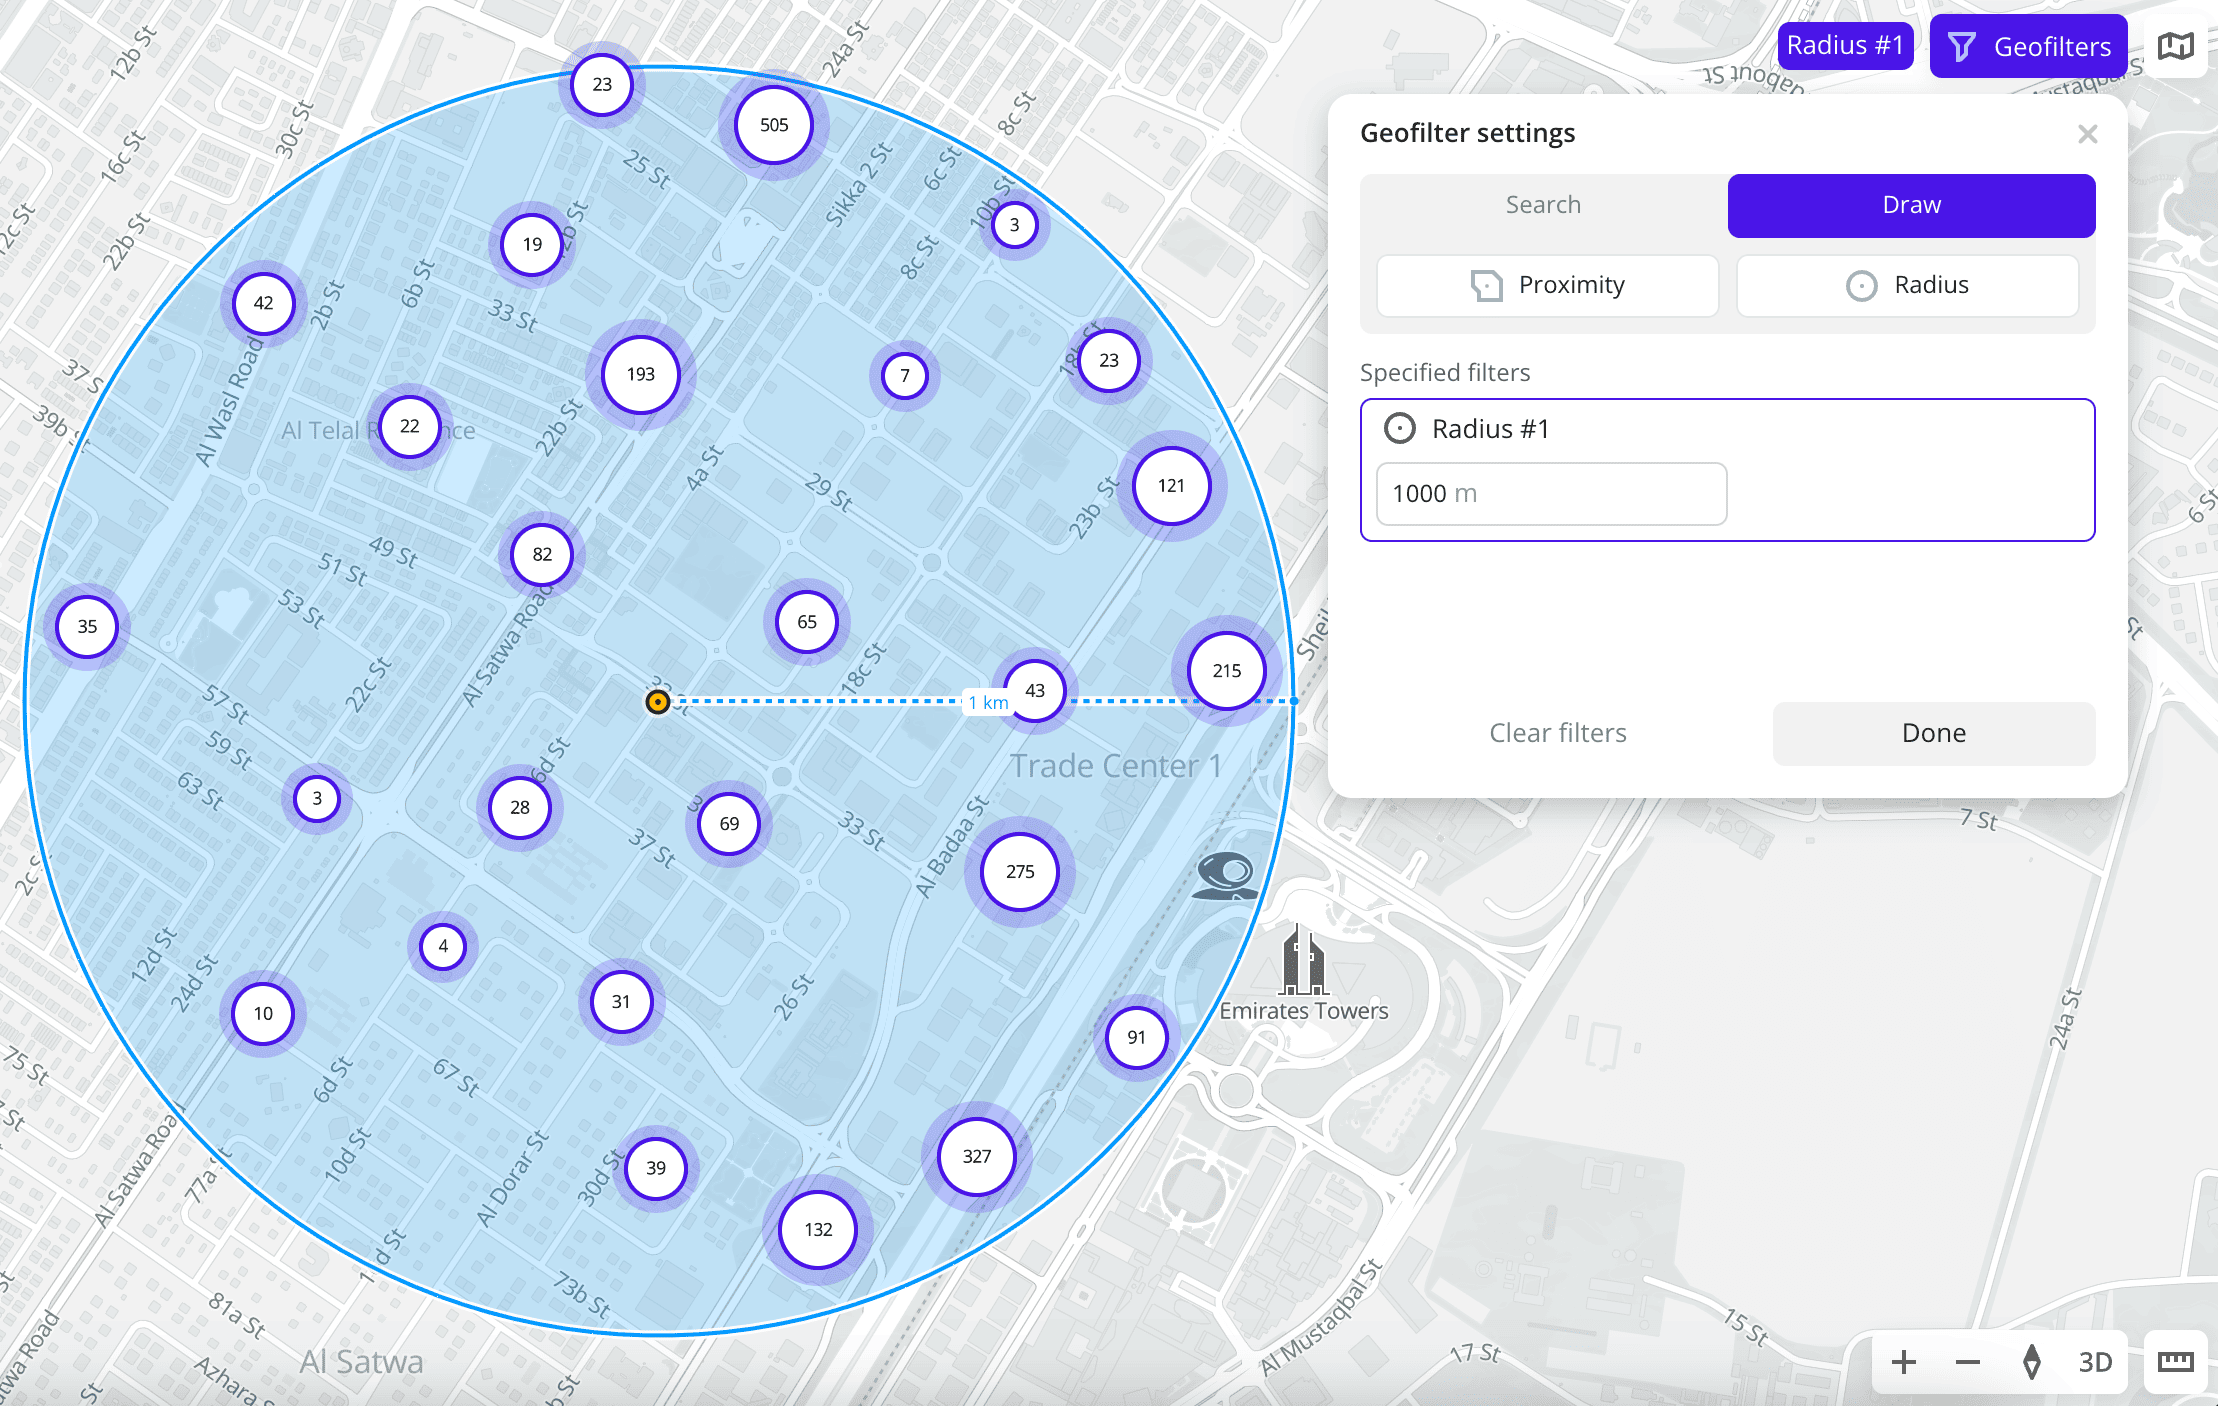
Circles: circles on the map. To draw a circle, go to the Draw tab and click Radius. Click a point on the map to draw the circle around it, and specify a radius from
10to100,000meters.An example of creating a geofilter by a circle:
Operations with geofilters
Displaying borders and names
To display the borders and names of territories on the dashboard scene:
-
Go to the Dashboards tab and open the dashboard.
-
Open a scene using the arrows
 and
and  . If there is only one scene in the dashboard, it opens automatically.
 -
Click Geofilters.
-
In the Geofilter settings dialog, select Always show borders and names:
Renaming a geofilter
- Click Geofilters.
- In the Geofilter settings dialog, double-click the geofilter.
- Enter a new geofilter name and press Enter.
Hiding and showing a geofilter
-
Click Geofilters.
-
In the Geofilter settings dialog, hide or show the geofilter:
- To hide a geofilter, click
 icon next to its name.
 - To show a geofilter, click
 icon next to its name.
- To hide a geofilter, click
If you modify a data sample, hiding the geofilter excludes data from this territory in the sample. This does not remove the geofilter, and you can include the data in the sample later.
If you filter data on a scene using geofilters and hide the geofilter, the data sample does not change, but scenes display data only for the selected territories.
Pinning a geofilter
To use a geofilter by default when creating all new dashboard layers, when creating a layer in an existing dashboard, you can pin the geofilter:
- Click Geofilters.
- In the Geofilter settings dialog, click
 icon next to its name.
 - To unpin a geofilter, click icon again.
Deleting a geofilter
-
Click Geofilters.
-
In the Geofilter settings dialog, delete the geofilter:
- To delete one geofilter, click
 icon next to its name.
 - To delete all geofilters, click Clear filters.
- To delete one geofilter, click
What's next?
- Getting started.
- Get to know how to work with Data visualization.
- Learn more about Layers, Dashboards, Scenes, and Widgets.
- Learn about ready-made Analytics scenarios.