Pedestrian traffic
The documentation provides a description with examples of the interface in Russian.
The Pedestrian traffic dataset provides information about pedestrian traffic on the streets of major cities. The average number of pedestrians per street network edge is calculated for a time period: a day, a typical hour, and an hour within a time interval (morning, afternoon, evening, night).
A previous version of the Pedestrian traffic (detailed) dataset is also available, which contains traffic data for weekdays and weekends.
Usage scenarios
The Pedestrian traffic dataset helps to solve the problems:
- Evaluating a location for business. It allows you to assess the intensity of pedestrian flow near a particular point, compare multiple locations, and determine where the probability of customer inflow is higher.
- Selecting and justifying advertising placement. It helps you to find high-traffic areas, compare potential placement points, and justify the choice of advertising surfaces in terms of audience reach.
- Urban environment and infrastructure analysis. It allows you to identify overloaded and underloaded areas, analyze flow distribution, and make decisions on pedestrian infrastructure development.
How is the data collected?
Pedestrian traffic is calculated based on a model of typical movements of city residents: from home to work, shops, services, and other daily destinations. The modeling takes into account:
- road and sidewalk map
- number of people living and working in buildings
- differences in behavior of different age groups
Pedestrian traffic intensity calculations are based on a complex mathematical model that takes into account multiple factors and data sources. The algorithm for calculating in simplified form consists of the following steps:
- Grouping the population by age: children, adults, elderly.
- Identifying points that residents most often walk to at different times of day.
- Building pedestrian proximity zones around buildings.
- Building routes from buildings to destination points.
- Counting the number of people on each street segment.
Data update and history
- Update frequency: data is updated as needed, for example, when significant changes occur in the city.
- History: historical data is not available.
Available territories
Data is available for the following countries and cities:
- Kazakhstan: Aktobe, Aktau, Atyrau, Karaganda, Kokshetau, Kostanay, Kyzylorda, Pavlodar, Petropavlovsk, Taldykorgan, Taraz, Uralsk, Ust-Kamenogorsk, Shymkent.
- Kyrgyzstan: Bishkek.
- Russia: cities with a population of more than 500,000, as well as some smaller cities.
- Uzbekistan: Tashkent.
Available territories are gradually expanding. To check data availability, use geofilters or contact technical support.
Data availability
-
Cloud-based (2GIS Pro service):
- Demo tariff plan: data is not available. To start working with the data, change the tariff plan and request access to the dataset.
- Other tariff plans: data is available upon request.
-
On-Premise (installation of the service in a private environment): data is not available.
Getting started
- Go to the Main or Data tab.
- Select the Pedestrian traffic dataset.
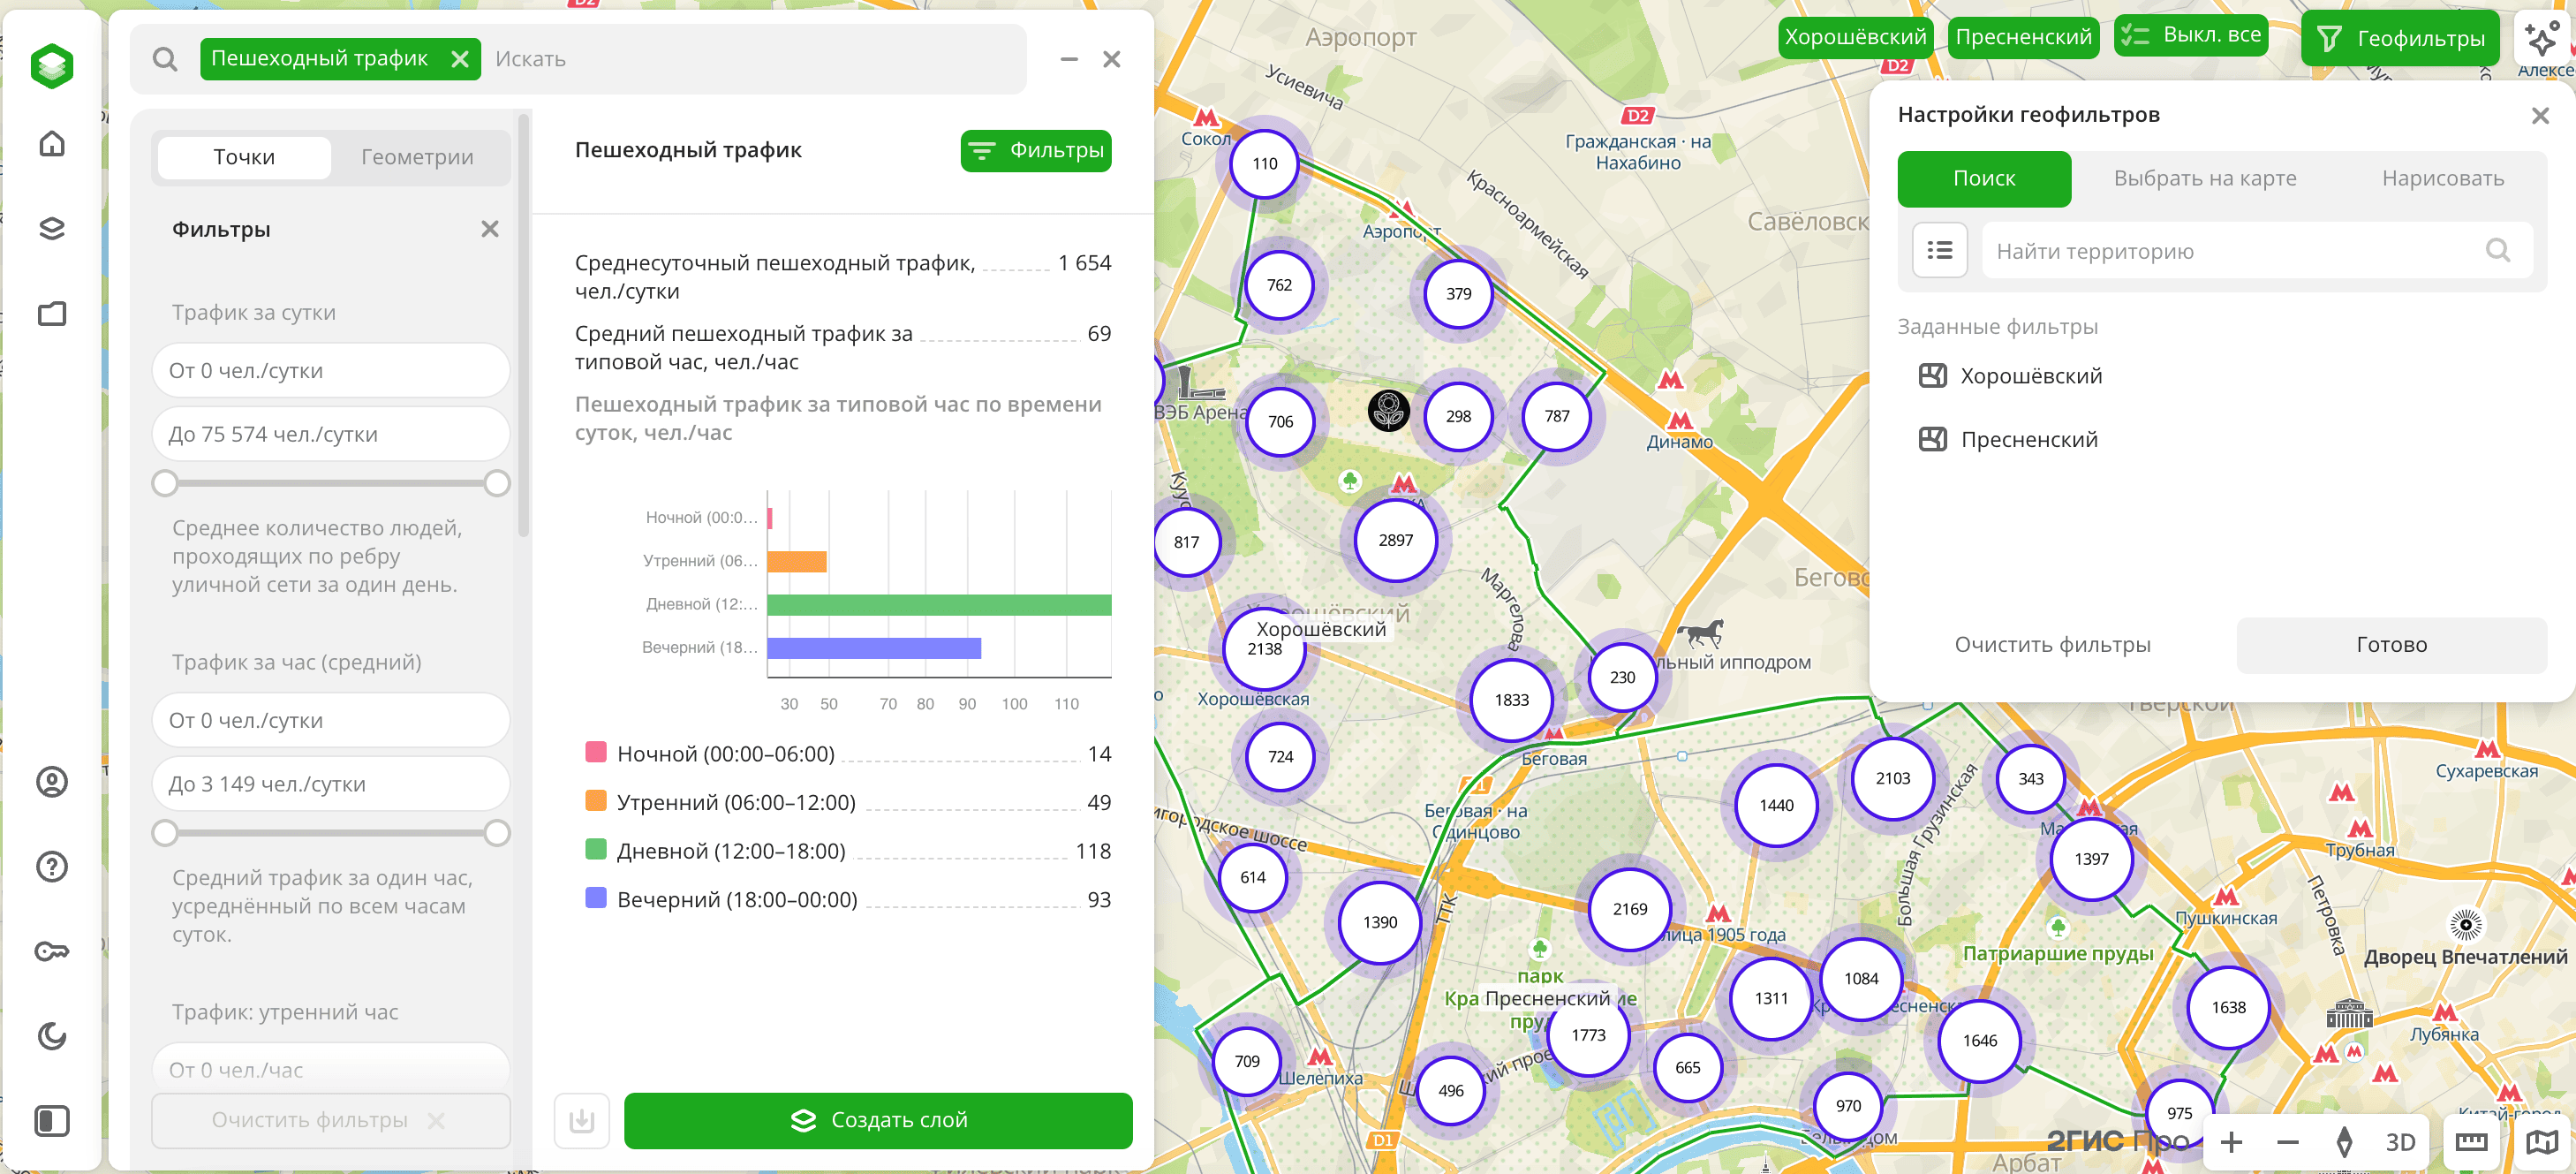
- In the Geofilter settings dialog, select up to 50 territories for which the data sample is created. You can use standard and custom territories and also build polygons, proximity zones, and circles on the map. For more information, see the Geofilters section. After you select the territories, click Done.
- On the Filters tab, set the remaining filters if necessary.
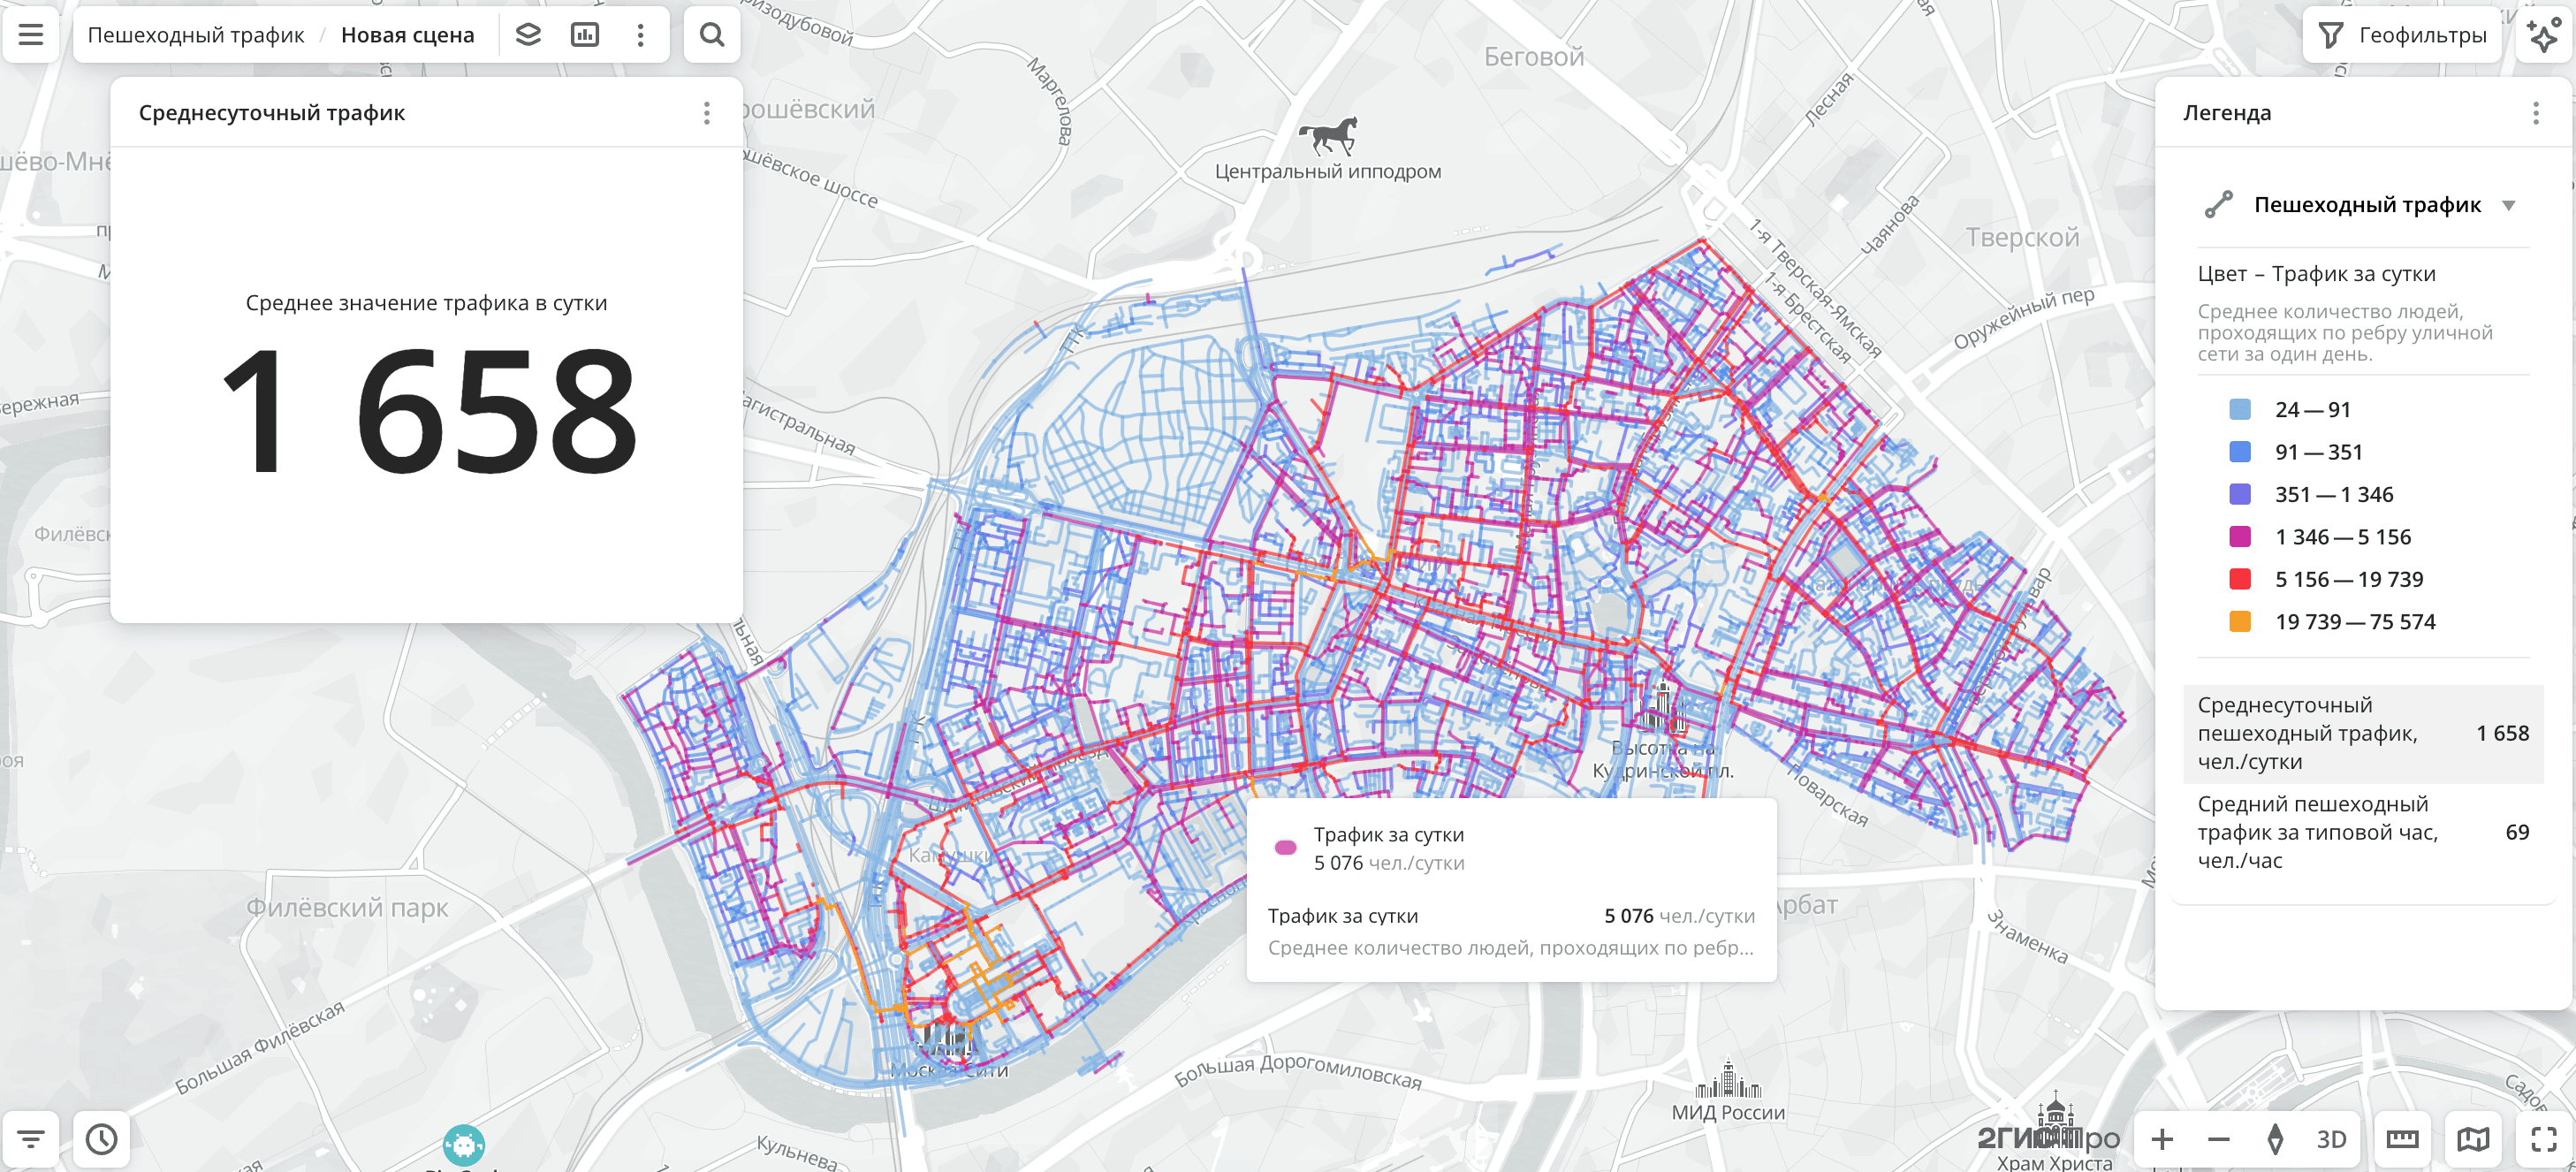
The data is displayed on the map as lines or centroid points: the centers of the object geometries. Available in the filtering results:
-
Average daily pedestrian traffic (number of people per day).
-
Average pedestrian traffic per typical hour (number of people per hour).
-
Chart with pedestrian traffic distribution per typical hour within a time interval. The following time-of-day intervals are used:
Morning interval(06:00–12:00)Afternoon interval(12:00–18:00)Evening interval(18:00–00:00)Night interval(00:00–06:00)
Data for the previous dataset version
For the Pedestrian traffic (detailed) dataset, the following filtering results are available:
- Chart with pedestrian traffic distribution on one edge depending on the day of the week: weekdays or weekends (number of people per day).
- Chart with pedestrian traffic distribution on one edge per one hour depending on the day of the week: hourly traffic on a weekday and on a weekend.
To save the data sample, click Create layer and customize data visualization.
Filters
For the Pedestrian traffic dataset, the following filters are available:
- Daily traffic: average number of people passing through a street network edge per day.
- Hourly traffic (average): average traffic per hour, averaged across all hours of the day.
- Traffic: morning hour: average number of people per hour passing through the edge during a typical morning interval hour (06:00–12:00).
- Traffic: afternoon hour: average number of people per hour passing through the edge during a typical afternoon interval hour (12:00–18:00).
- Traffic: evening hour: average number of people per hour passing through the edge during a typical evening interval hour (18:00–00:00).
- Traffic: night hour: average number of people per hour passing through the edge during a typical night interval hour (00:00–06:00).
Filters for the previous dataset version
For the Pedestrian traffic (detailed) dataset, the following filters are available:
- Weekday traffic: number of pedestrians on a typical weekday.
- Weekend traffic: number of pedestrians on a typical weekend day.
- Weekday hourly traffic: number of pedestrians per hour on a typical weekday.
- Weekend hourly traffic: number of pedestrians per hour on a typical weekend day.
To reset the parameter filter, click ![]() icon next to the filter name. To reset all parameter filters, click Reset filters at the bottom of the tab.
icon next to the filter name. To reset all parameter filters, click Reset filters at the bottom of the tab.
To hide the filter by territory, in the Geofilter settings dialog, click ![]() icon next to the geofilter name. To delete the geofilter, click
icon next to the geofilter name. To delete the geofilter, click ![]() icon next to its name. To delete all geofilters, click Clear filters.
icon next to its name. To delete all geofilters, click Clear filters.
Data visualization
Only the Line visualization method is available for the dataset since traffic information is linked to road segments.
After creating the layer, configure a basic data visualization:
-
In the Type of scale field, select Logarithmic:
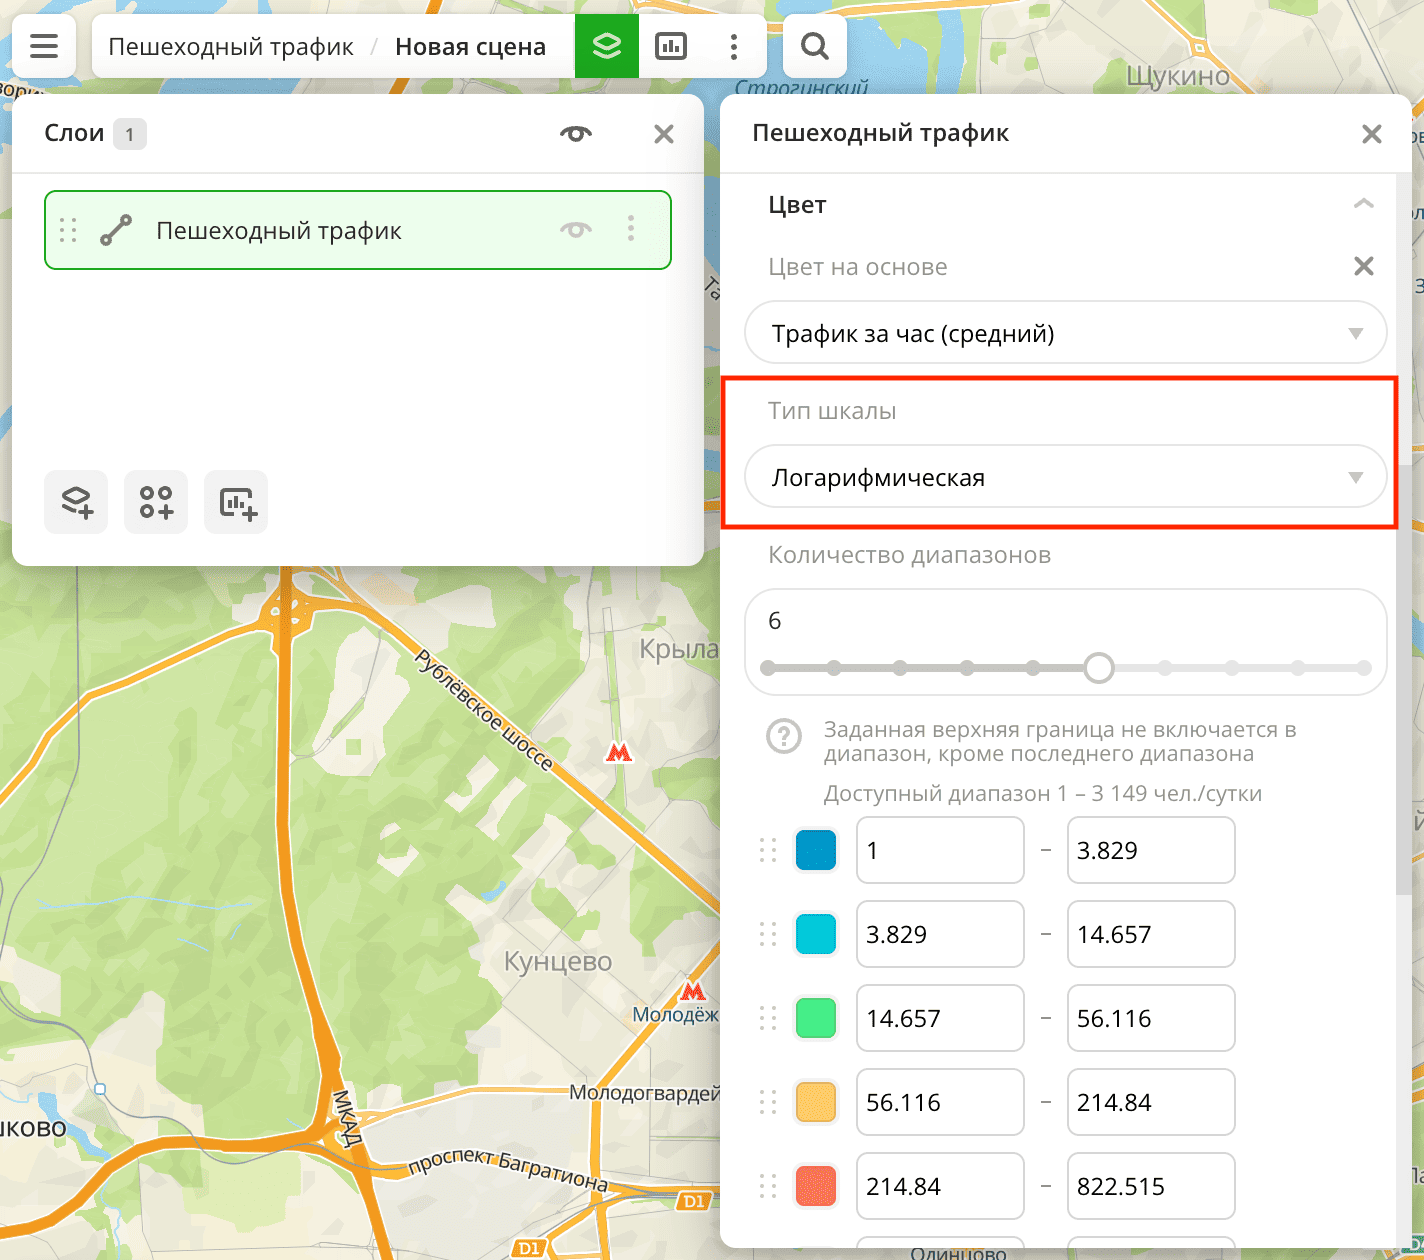
-
To analyze the road network, change the color of the lines on the map depending on traffic. In the Color basis field, select the
Daily trafficattribute and specify the color palette: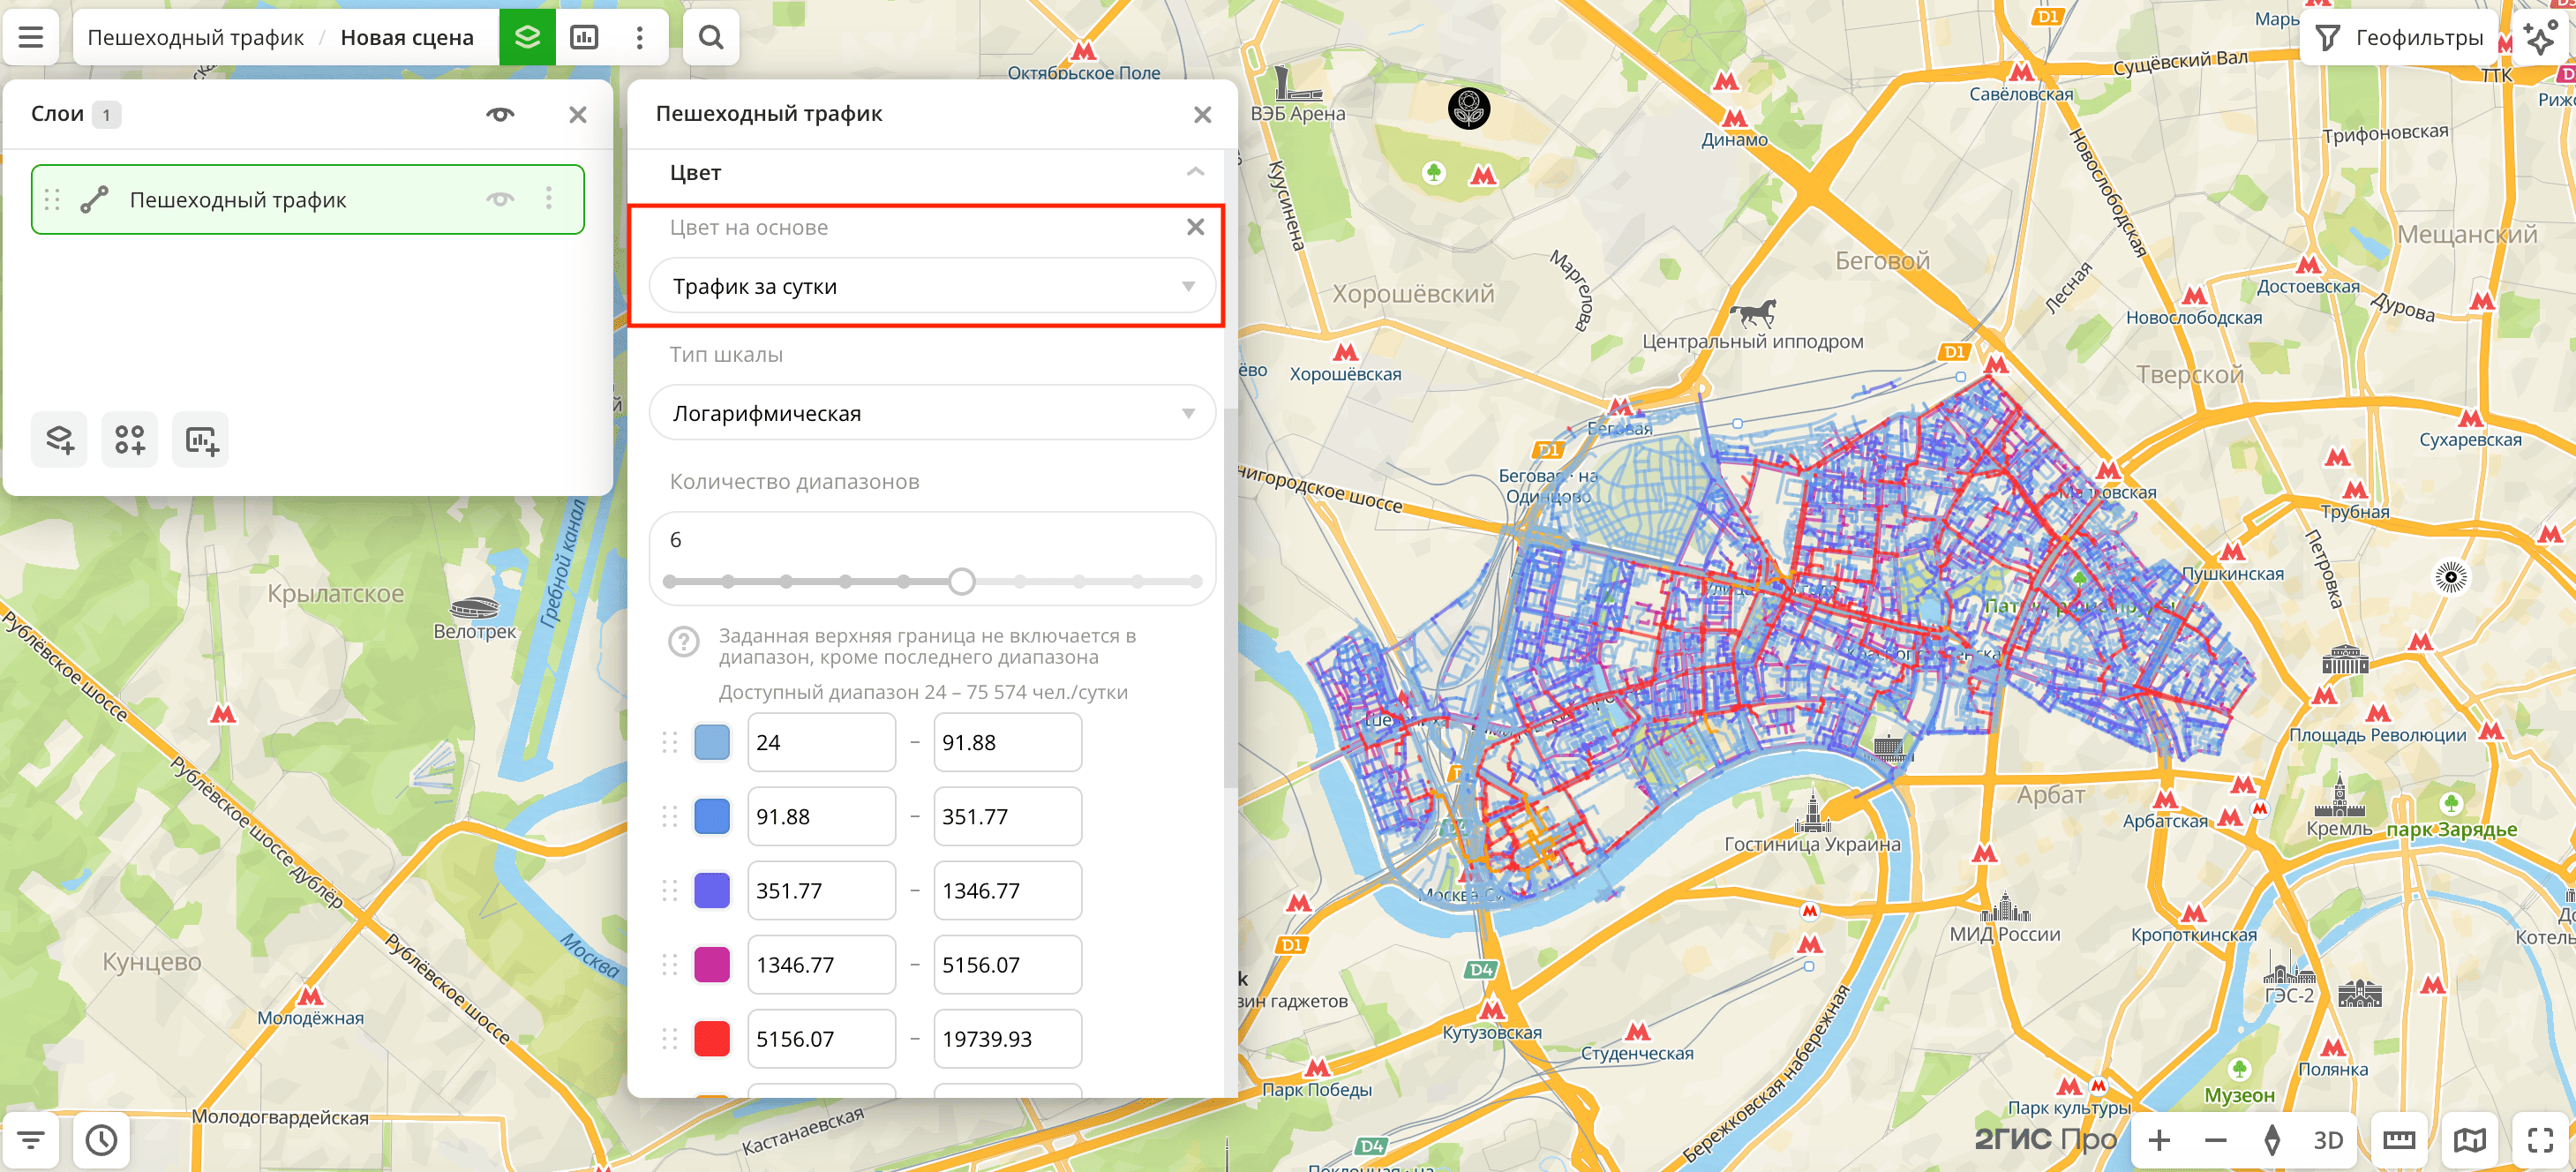
Data purchasing
You can purchase data separately as an export in the following formats:
- Table formats:
.csv.txt.json
- Formats for storing geographic data:
.shp(Shape).gpkg(GeoPackage).geojson(GeoJSON)
For more information about the price, available territories, and how to purchase data, fill out the form on urbi.ae.
What's next?
- Getting started.
- Get to know more about other Data categories.
- Get to know how to work with Data visualization.
- Learn more about Layers, Dashboards, Scenes, and Widgets.
- Learn about ready-made Analytics scenarios.