Location attractiveness
The documentation provides a description with examples of the interface in Russian.
The Location attractiveness dataset provides a potential score of locations for opening businesses from different categories, based on a machine learning model. The model analyzes 2GIS data: population, traffic, infrastructure, competitive environment, and historical performance of places.
The score is calculated separately for a particular organization category and city, on a scale from 1 to 10:
10- the best locations in the city (top 10%)1- the least promising, risky locations
The score is not an actual performance indicator, does not consider individual business characteristics (brand, format, etc.), and is not a substitute for detailed data analysis. It is recommended to use it with other datasets: Detailed car traffic, Population, and others.
Usage scenarios
The Location attractiveness dataset helps to solve the problems:
- Choosing a location to open a business. It allows you to quickly identify where to open a café, restaurant, store, or service without manually analyzing multiple data sources.
- Comparing multiple locations. It simplifies comparison of several places to determine which has higher potential.
- Searching for suitable zones in a city. It shows areas with the highest concentration of promising locations for a specific organization category.
- Preliminary market assessment. It helps to evaluate how well a city or district suits a selected business type.
How is the data collected?
The attractiveness score is calculated using a machine learning model based on 2GIS data.
The calculation algorithm consists of the following steps:
-
Creating a spatial grid. The city is divided into H3 cells with a
9resolution. An attractiveness potential is calculated for each cell. The approximate size of each cell is 0.1 km². -
Determining a target metric. The model uses the historical performance of places as a metric: their rating and number of reviews.
-
Collecting features. The model analyzes each H3 cell by features that affect location attractiveness:
- count of living and working population
- 2GIS user activity
- number and rating of competitors
- business activity of the area
- transport accessibility: metro and bus stops
- availability of parking
- types of development: residential, offices, retail, and others
-
Training the model. The model is trained on historical data by cities and organization categories, and identifies patterns characteristic of successful locations.
-
Calculating and normalizing a score. A relative score (percentile) is calculated for each organization category and city. It helps to compare locations within the same city correctly.
Data update and history
- Update frequency: data is updated once every three months.
- History: historical data is not available.
Available territories
Data is available only for some cities in Russia.
Availability depends on the presence of a model and data for the organization category. To check data availability, use geofilters or contact technical support.
Data availability
-
Cloud-based (2GIS Pro service):
- Demo tariff plan: data is not available. To start working with the data, change the tariff plan and request access to the dataset.
- Other tariff plans: data is available upon request.
-
On-Premise (installation of the service in a private environment): data is not available.
Getting started
- Go to the Main or Data tab.
- Select the Location attractiveness dataset.
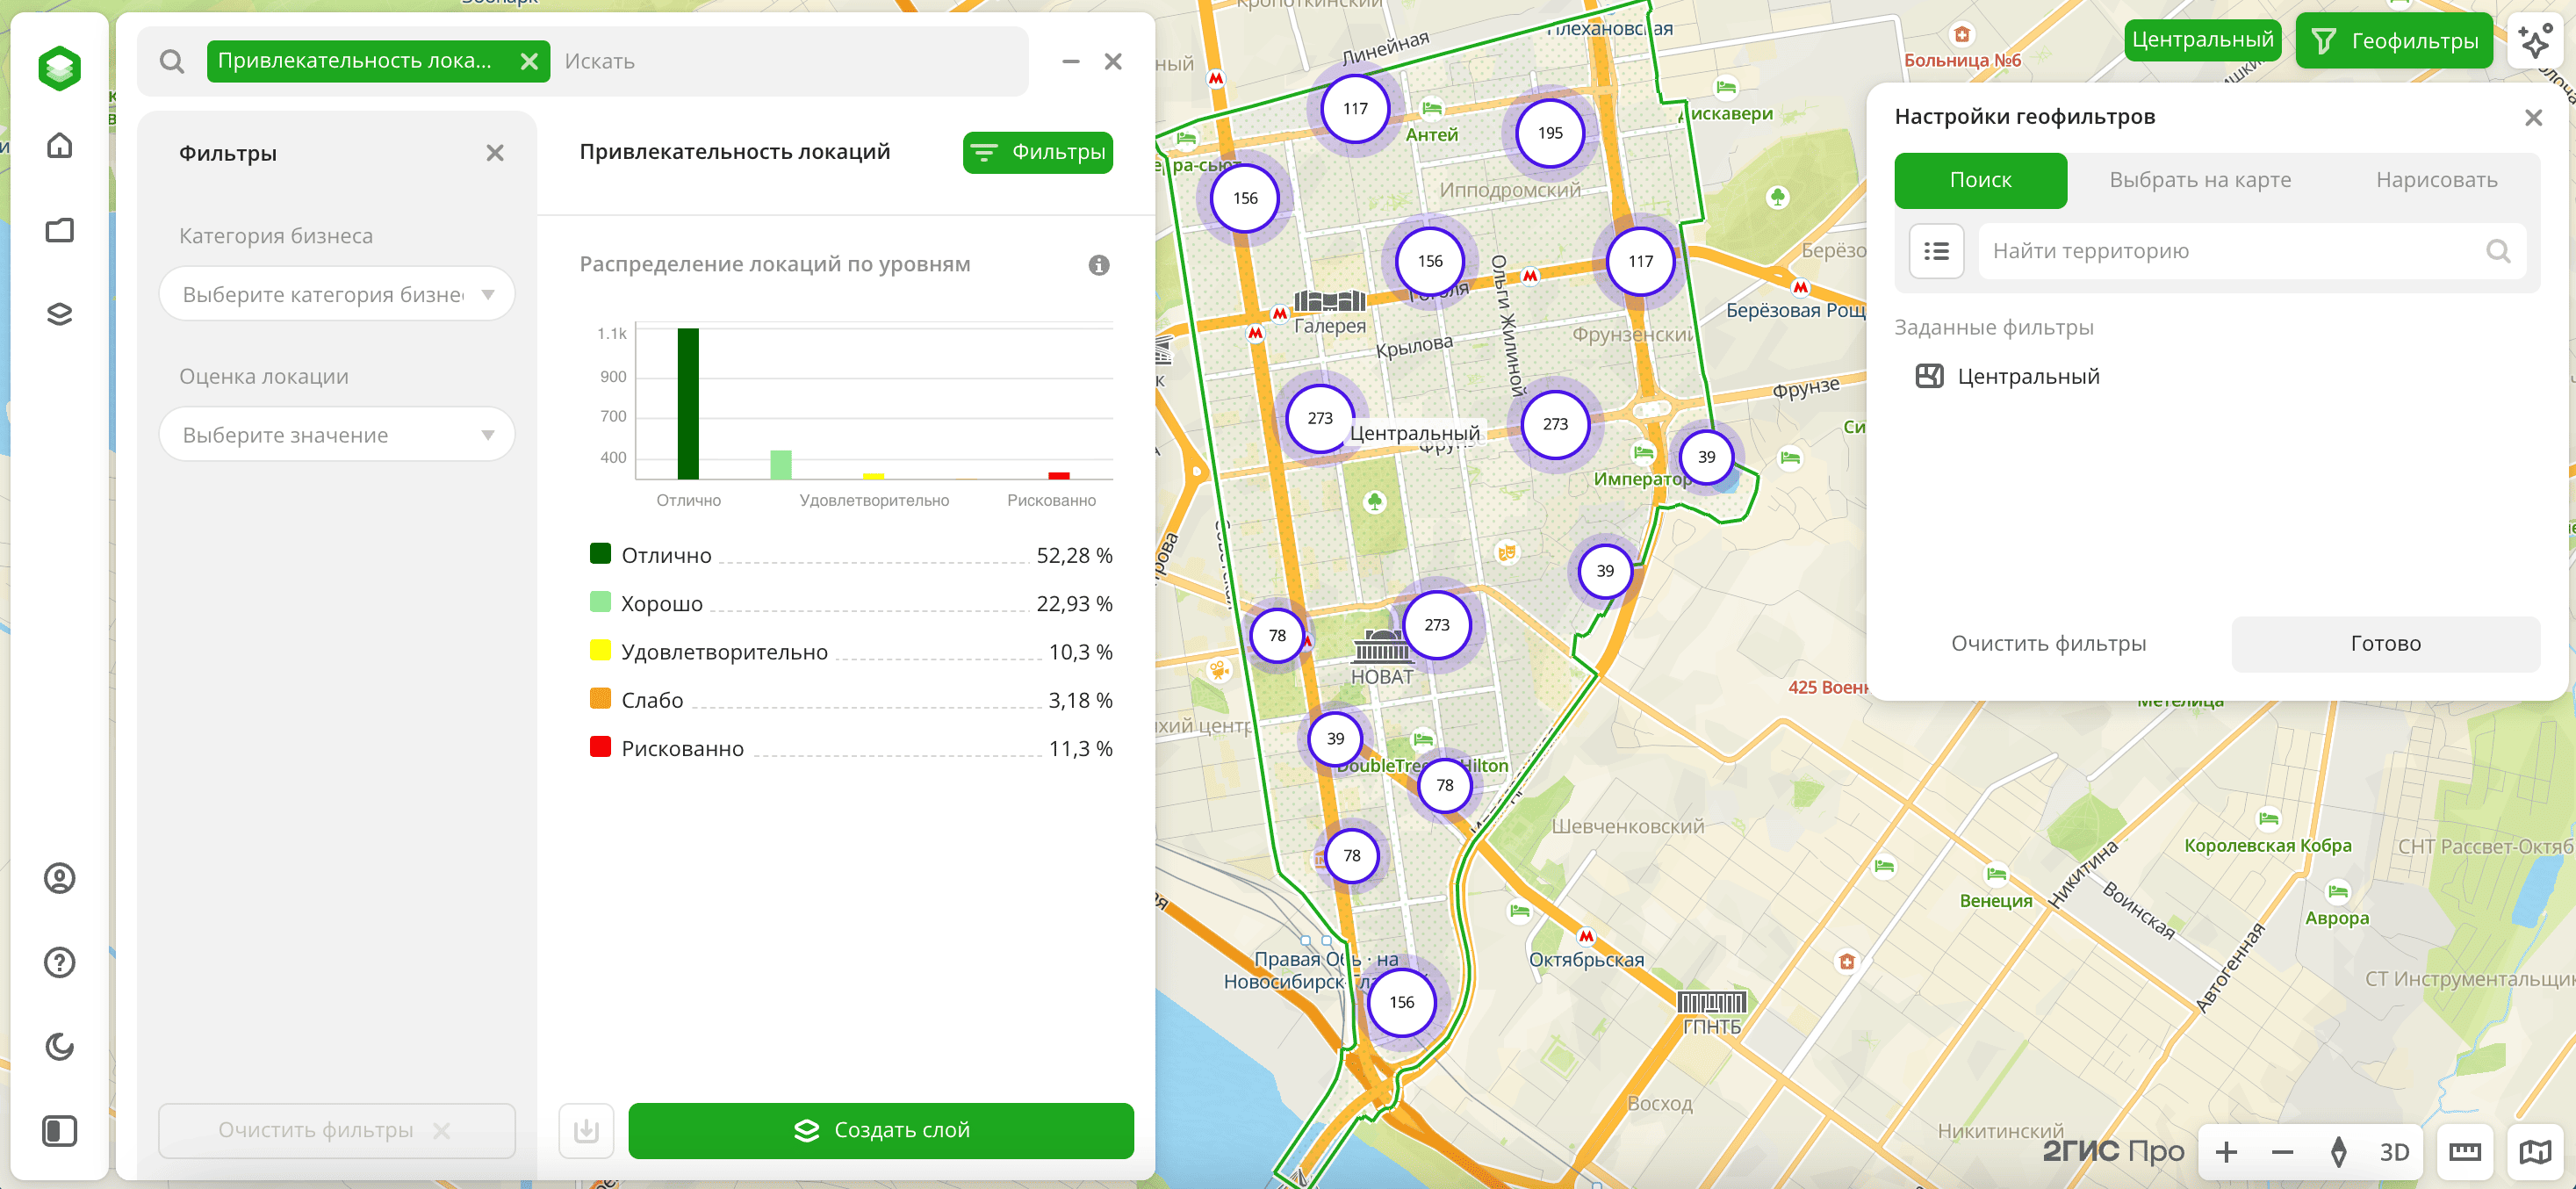
- In the Geofilter settings dialog, select up to 50 territories for which the data sample is created. You can use standard and custom territories and also build polygons, proximity zones, and circles on the map. For more information, see the Geofilters section. After you select the territories, click Done.
- On the Filters tab, select the basic filter for data analysis: Business category. To view the score for organizations in a particular category, select one category (e.g., Fast food).
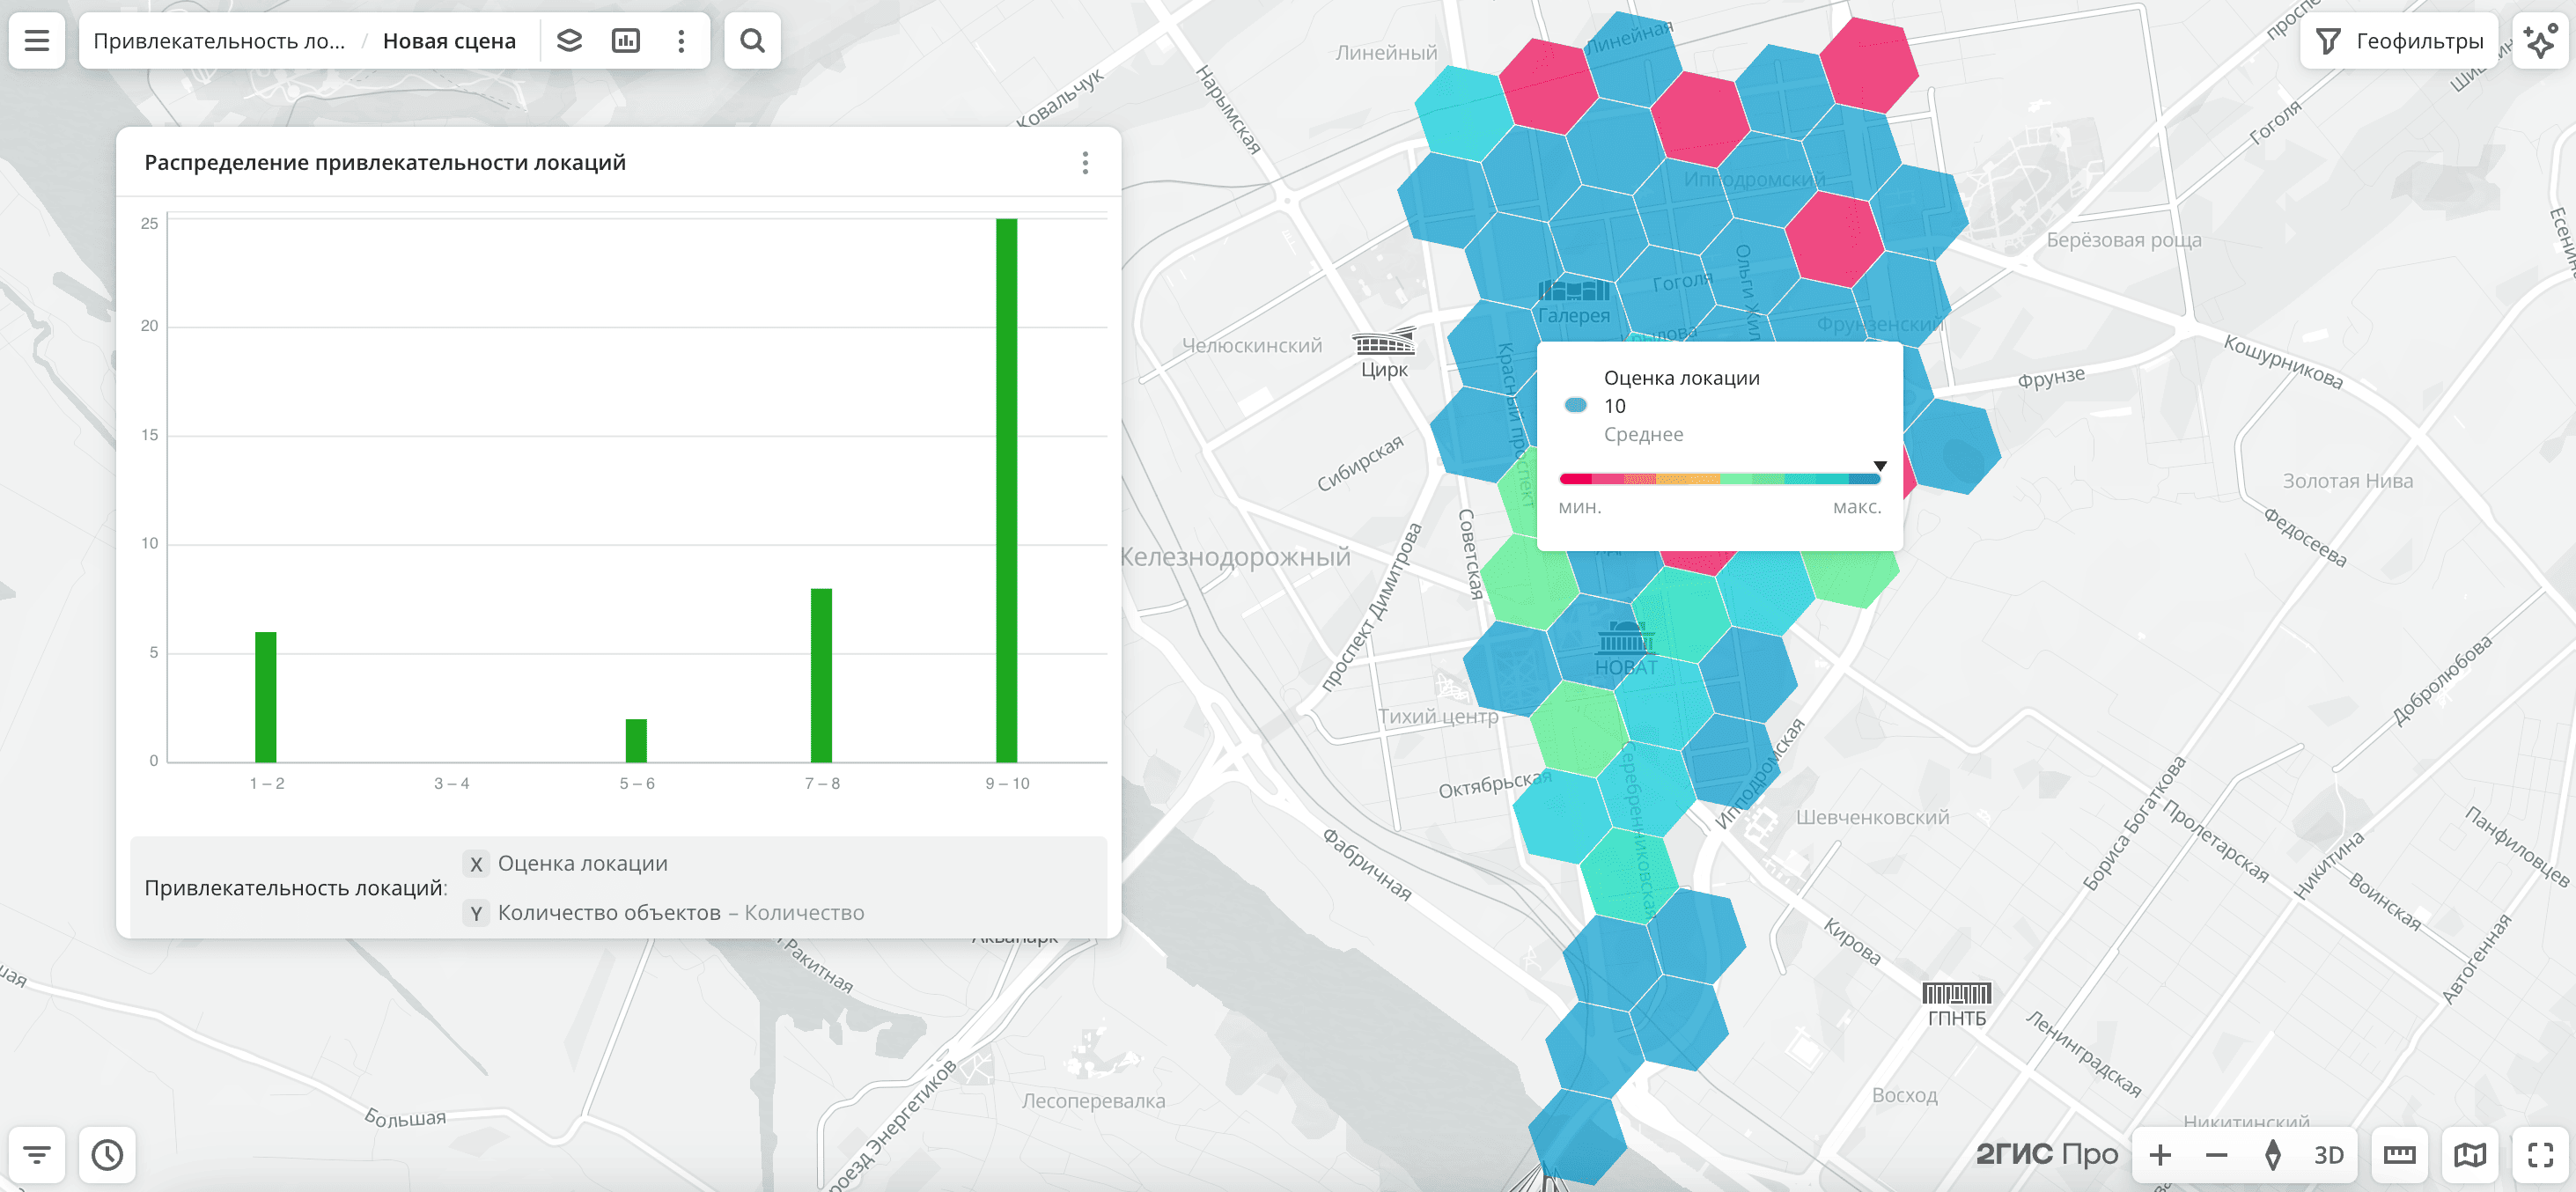
The data is displayed on the map as H3 cells (hexagons) with the resolution level 9. The filtering results include a chart with the distribution of locations by attractiveness level within a single organization category. Levels are calculated based on the location score (from 1 to 10) for a particular category and city.
To save the data sample, click Create layer and customize data visualization.
Filters
For the Location attractiveness dataset, the following filters are available:
- Business category: categories of organizations in the directory. You can select only one category (e.g., Fast food).
- Location score: attractiveness level of a location within an organization category. Available values: from 1 to 10, where 1 is a low attractiveness level and 10 is high.
To reset the parameter filter, click ![]() icon next to the filter name. To reset all parameter filters, click Reset filters at the bottom of the tab.
icon next to the filter name. To reset all parameter filters, click Reset filters at the bottom of the tab.
To hide the filter by territory, in the Geofilter settings dialog, click ![]() icon next to the geofilter name. To delete the geofilter, click
icon next to the geofilter name. To delete the geofilter, click ![]() icon next to its name. To delete all geofilters, click Clear filters.
icon next to its name. To delete all geofilters, click Clear filters.
Data visualization
Only the H3 visualization method is available for the dataset.
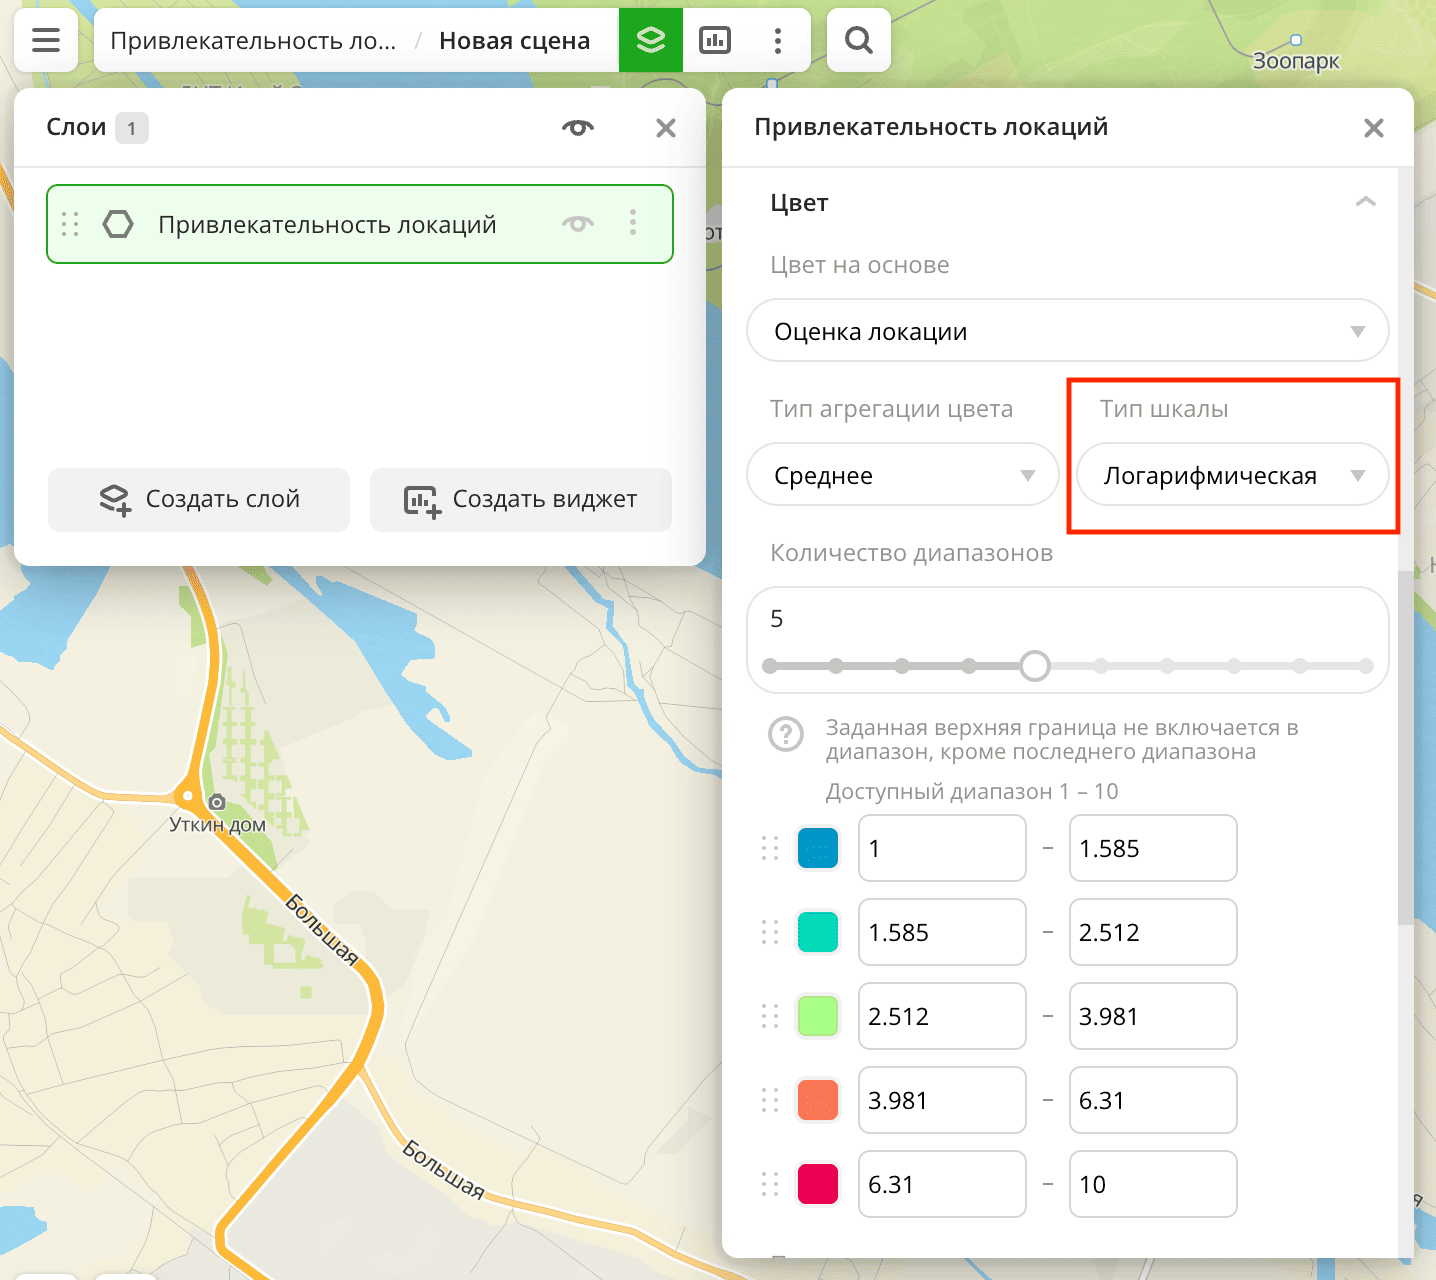
After creating the layer, configure a basic data visualization:
-
In the Type of scale field, select Logarithmic:
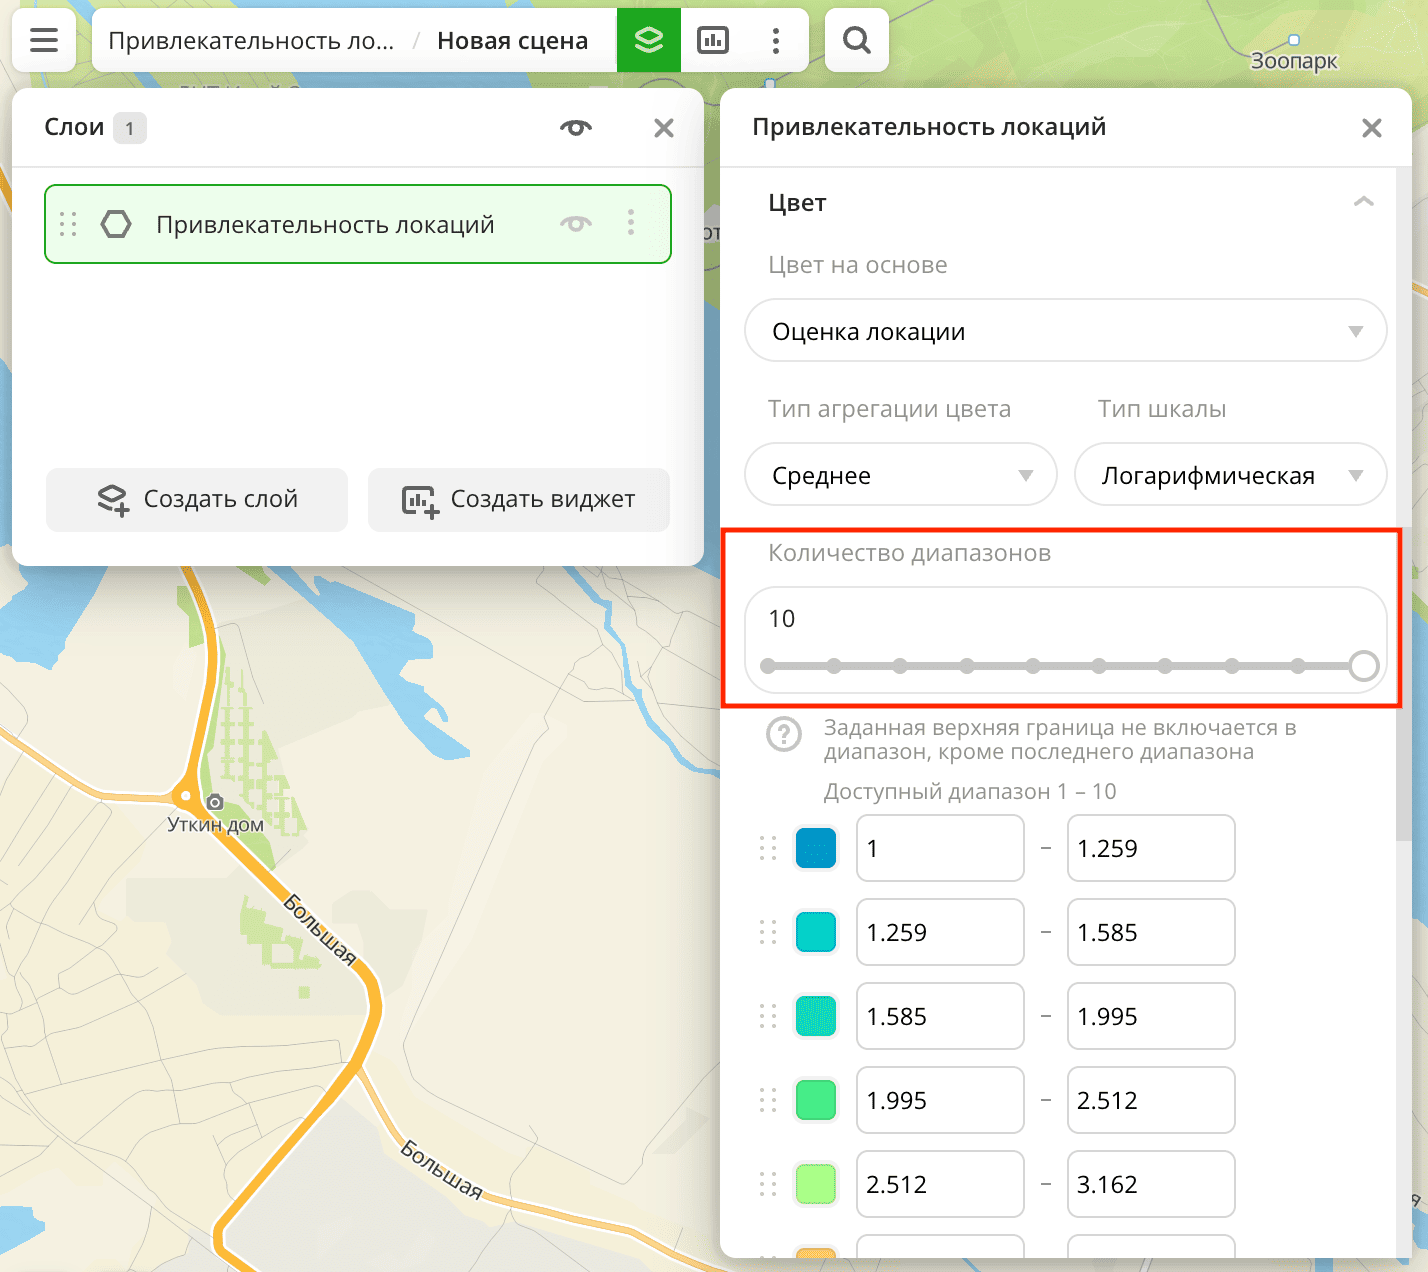
-
In the Number of ranges field, select 10:
Data purchasing
You can purchase data separately as an export in the following formats:
- Table formats:
.csv.txt.json
- Formats for storing geographic data:
.shp(Shape).gpkg(GeoPackage).geojson(GeoJSON)
For more information about the price, available territories, and how to purchase data, fill out the form on urbi.ae.
What's next?
- Getting started.
- Get to know more about other Data categories.
- Get to know how to work with Data visualization.
- Learn more about Layers, Dashboards, Scenes, and Widgets.
- Learn about ready-made Analytics scenarios.