Uploading data files
You can upload your own geodata to 2GIS Pro service.
You can upload data for any territory, but a detailed map is only available for countries with built-in data: see the list of countries.
If you use the demo tariff plan, you cannot upload data files.
To upload a file with a dataset and work with it:
- Prepare a data file.
- Upload the data to the service.
- Create a filter by territory from polygons (optional).
- Create a layer with a data sample.
After uploading the data, you can update the data in the dataset.
If you uploaded a dataset with point objects, you can manually add new points to the dataset and edit or delete existing ones. For more information, see the Changing a dataset with points section.
1. Prepare a data file
General requirements
- Formats:
.csv,.csv.gz.geojson,.geojson.gz.shp(you also need to upload the.shxand.dbffiles).shp.zip(an archive must contain the.shp,.shx,.dbf, and.prjfiles).kml.kmz.xlsx(you can only upload the first sheet of the file).gpkg
- Size: depends on your tariff plan
- Encoding: UTF-8
- Coordinate System: WGS84(4326)
Geometry
-
Available geometry types:
- Point
- LineString
- Polygon (can be used to create new territory filters)
- MultiPoint
- MultiLineString
- MultiPolygon
FeatureCollection and GeometryCollection are not supported. The file must contain only one geometry type.
-
Data in
.csvand.csv.gzformats must contain at least one column with geometry. Data in.geojsonand.geojson.gzformats must contain at least one field with geometry. Supported geometry formats:- WKT (Well-Known Text)
- Latitude and longitude as floating-point numbers (only for point objects)
Dates and time
Supported formats:
-
Date only (UTC±00:00 is applied by default):
YYYY-MM-DD(2023-10-05)DD/MM/YYYY(05/10/2023)DD.MM.YYYY(05.10.2023)DD Mon YYYY(05 Oct 2023)
-
Date and time (UTC±00:00 is applied by default):
YYYY-MM-DD HH:MM(2023-10-05 14:30)YYYY-MM-DD HH:MM:SS(2023-10-05 14:30:00)DD/MM/YYYY HH:MM(05/10/2023 14:30)DD/MM/YYYY HH:MM:SS(05/10/2023 14:30:00)DD.MM.YYYY HH:MM(05.10.2023 14:30)DD.MM.YYYY HH:MM:SS(05.10.2023 14:30:00)
-
Date and time with a timezone:
YYYY-MM-DDTHH:MM:SS±HH:MM(2023-10-05T14:30:00+03:00)YYYY-MM-DDTHH:MM:SSZ(2023-10-05T11:30:00Z)YYYY-MM-DD HH:MM:SSZ(2023-10-05 11:30:00Z)YYYY-MM-DDTHH:MM:SS.sss±HH:MM(2023-10-05T14:30:00.000+03:00)Ddd, DD Mon YYYY HH:MM:SS TIMEZONE(Thu, 05 Oct 2023 13:30:00 GMT)
Data
- Any additional columns with information about objects are allowed.
- Additional columns can be used as filters. The maximum number of filters is 40.
- The maximum number of unique values in a filter is 30.
- When configuring field aliases, you can use digits, letters, space, characters
.,_,$, and round brackets(). Do not use commas.
You can prepare data in any GIS software, with programming languages, or in Excel (point objects only).
File example
example.csv
"Plot number","Type","Construction status","Planned category type","Sector TPSS number","ADM competitors (5 min)","ADM Density competitors","Urbi competitors (5 min)","Urbi Density competitors","Population count","Population density","geometry","Area (m2)"
"37","Residential","constructed","residential","SW14","0","0.0","0","0.0","24","0.0114907756079154","MULTIPOLYGON (((54.5533360489372 24.4070865895649, 54.5537666032566 24.407208446631405, 54.553899603709 24.406814267612795, 54.55346912918721 24.406692421312805, 54.5533360489372 24.4070865895649)))","2090.1"
"60","Residential","constructed","residential","SE42","0","0.0","0","0.0","59","0.0143151993294631","MULTIPOLYGON (((54.5950160683146 24.4368505784661, 54.5956536269804 24.437030010752995, 54.595830181732204 24.436504162972696, 54.5951926253267 24.436324731604895, 54.5950160683146 24.4368505784661)))","4124.2"
2. Upload the data
-
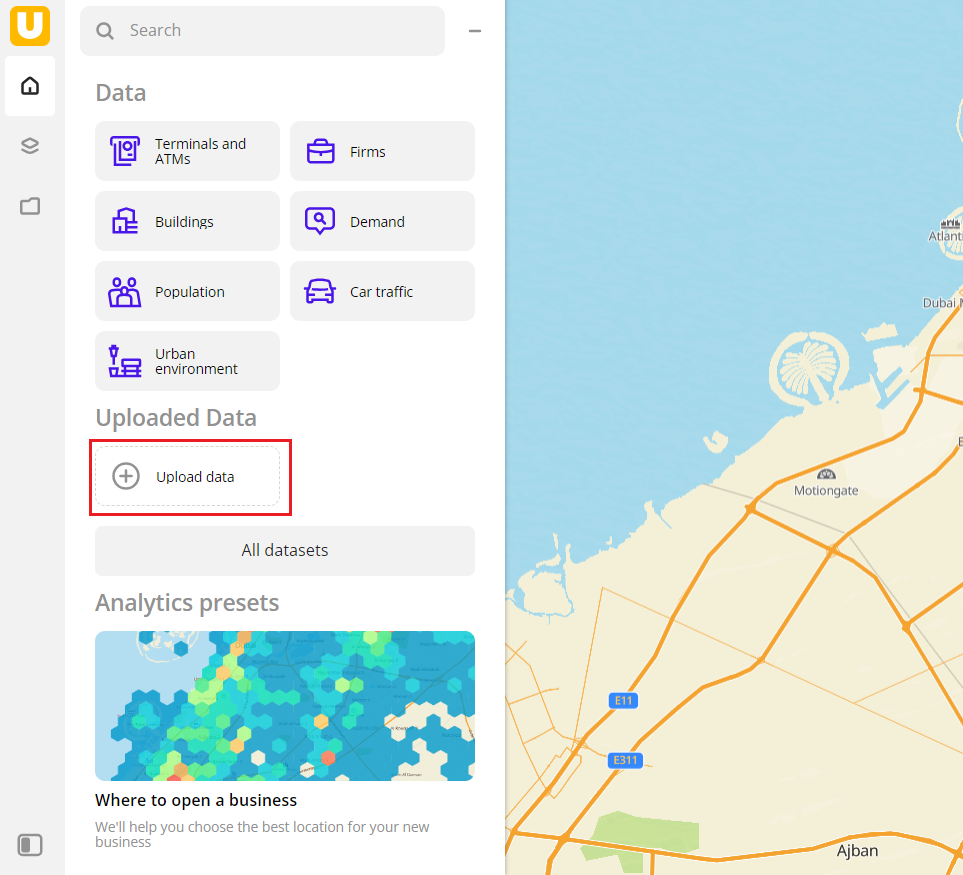
Go to the Main or Data tab.
-
Click Upload data.
-
Drag a file to the upload area or click Select a file on a computer.
-
Click Upload.
-
Enter a dataset name. The maximum number of characters is 50. The name can contain letters, numbers, spaces, and special characters.
-
Select a group to add a dataset.
-
(Optional) Enter a dataset description.
-
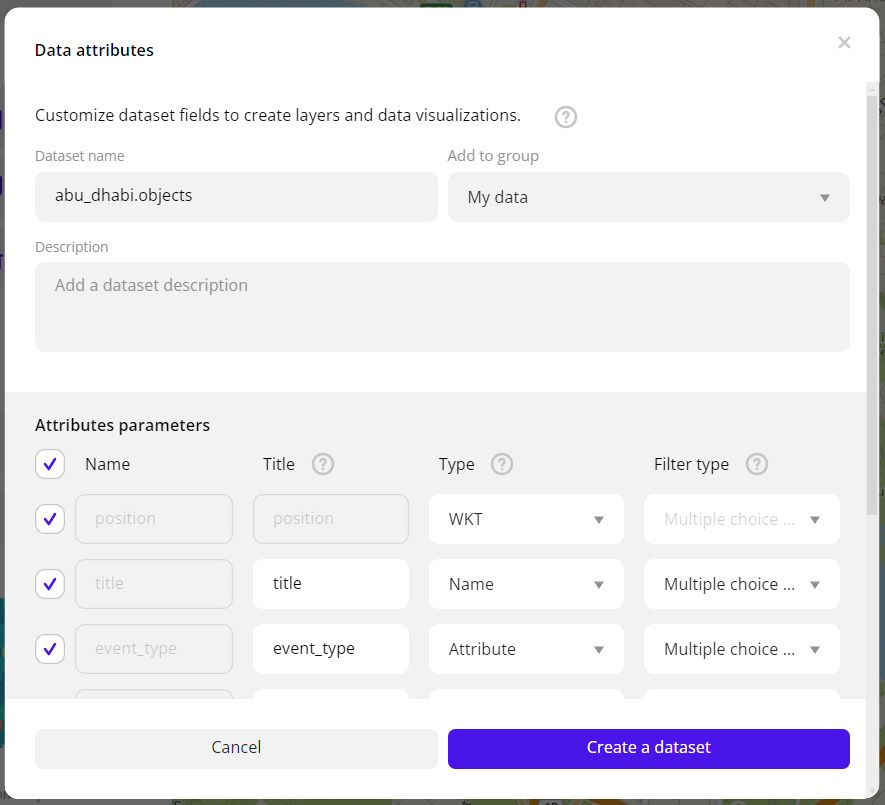
The service automatically generates an attribute structure for the dataset. To include the attribute in the resulting dataset, select its checkbox and change the attribute parameters if necessary.
-
In the attribute list, select the checkbox for at least one attribute that contains geometry information. In the Type field, select the attribute type:
LatitudeorLongitudefor coordinatesWKTfor geometry in WKT formatH3 IDfor data in H3 format (Hexagonal Hierarchical Spatial Index)
If you cancel the attribute configuration or close the dialog, the uploaded dataset remains on the Data tab. In the dataset card, a note indicating that attributes need to be configured will be displayed. You will be able to work with the dataset only after the configuration is complete.
-
Click Create a dataset.
The data appears in the selected dataset group as a card (by default, it is the Uploaded Data group).
Data attributes parameters
Parameter | Description |
|---|---|
| Title | Field name. |
| Type | Attribute type:
|
| Filter type | Filter type for the attribute:
|
3. (Optional) Create a filter by territory from polygons
If uploaded data contains geometries of the polygon type, you can use them to create your own territorial division. This allows you to create new territory filters (geofilters) and filter data not only by standard territory types (regions, districts, settlements, and others) but also by your unique areas.
For example, you can upload polygons with the boundaries of the areas of your interest and analyze information on firms and urban environment within these polygons.
To create a filter by territory:
-
Make sure that the data you upload contains:
- geometries of the polygon type
- an attribute with the Name type (the attribute can have any name)
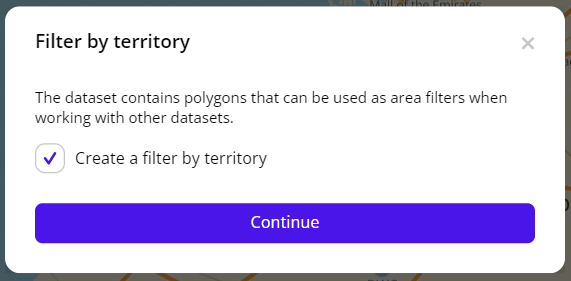
-
When uploading data, select the Create a filter by territory checkbox and click Continue.
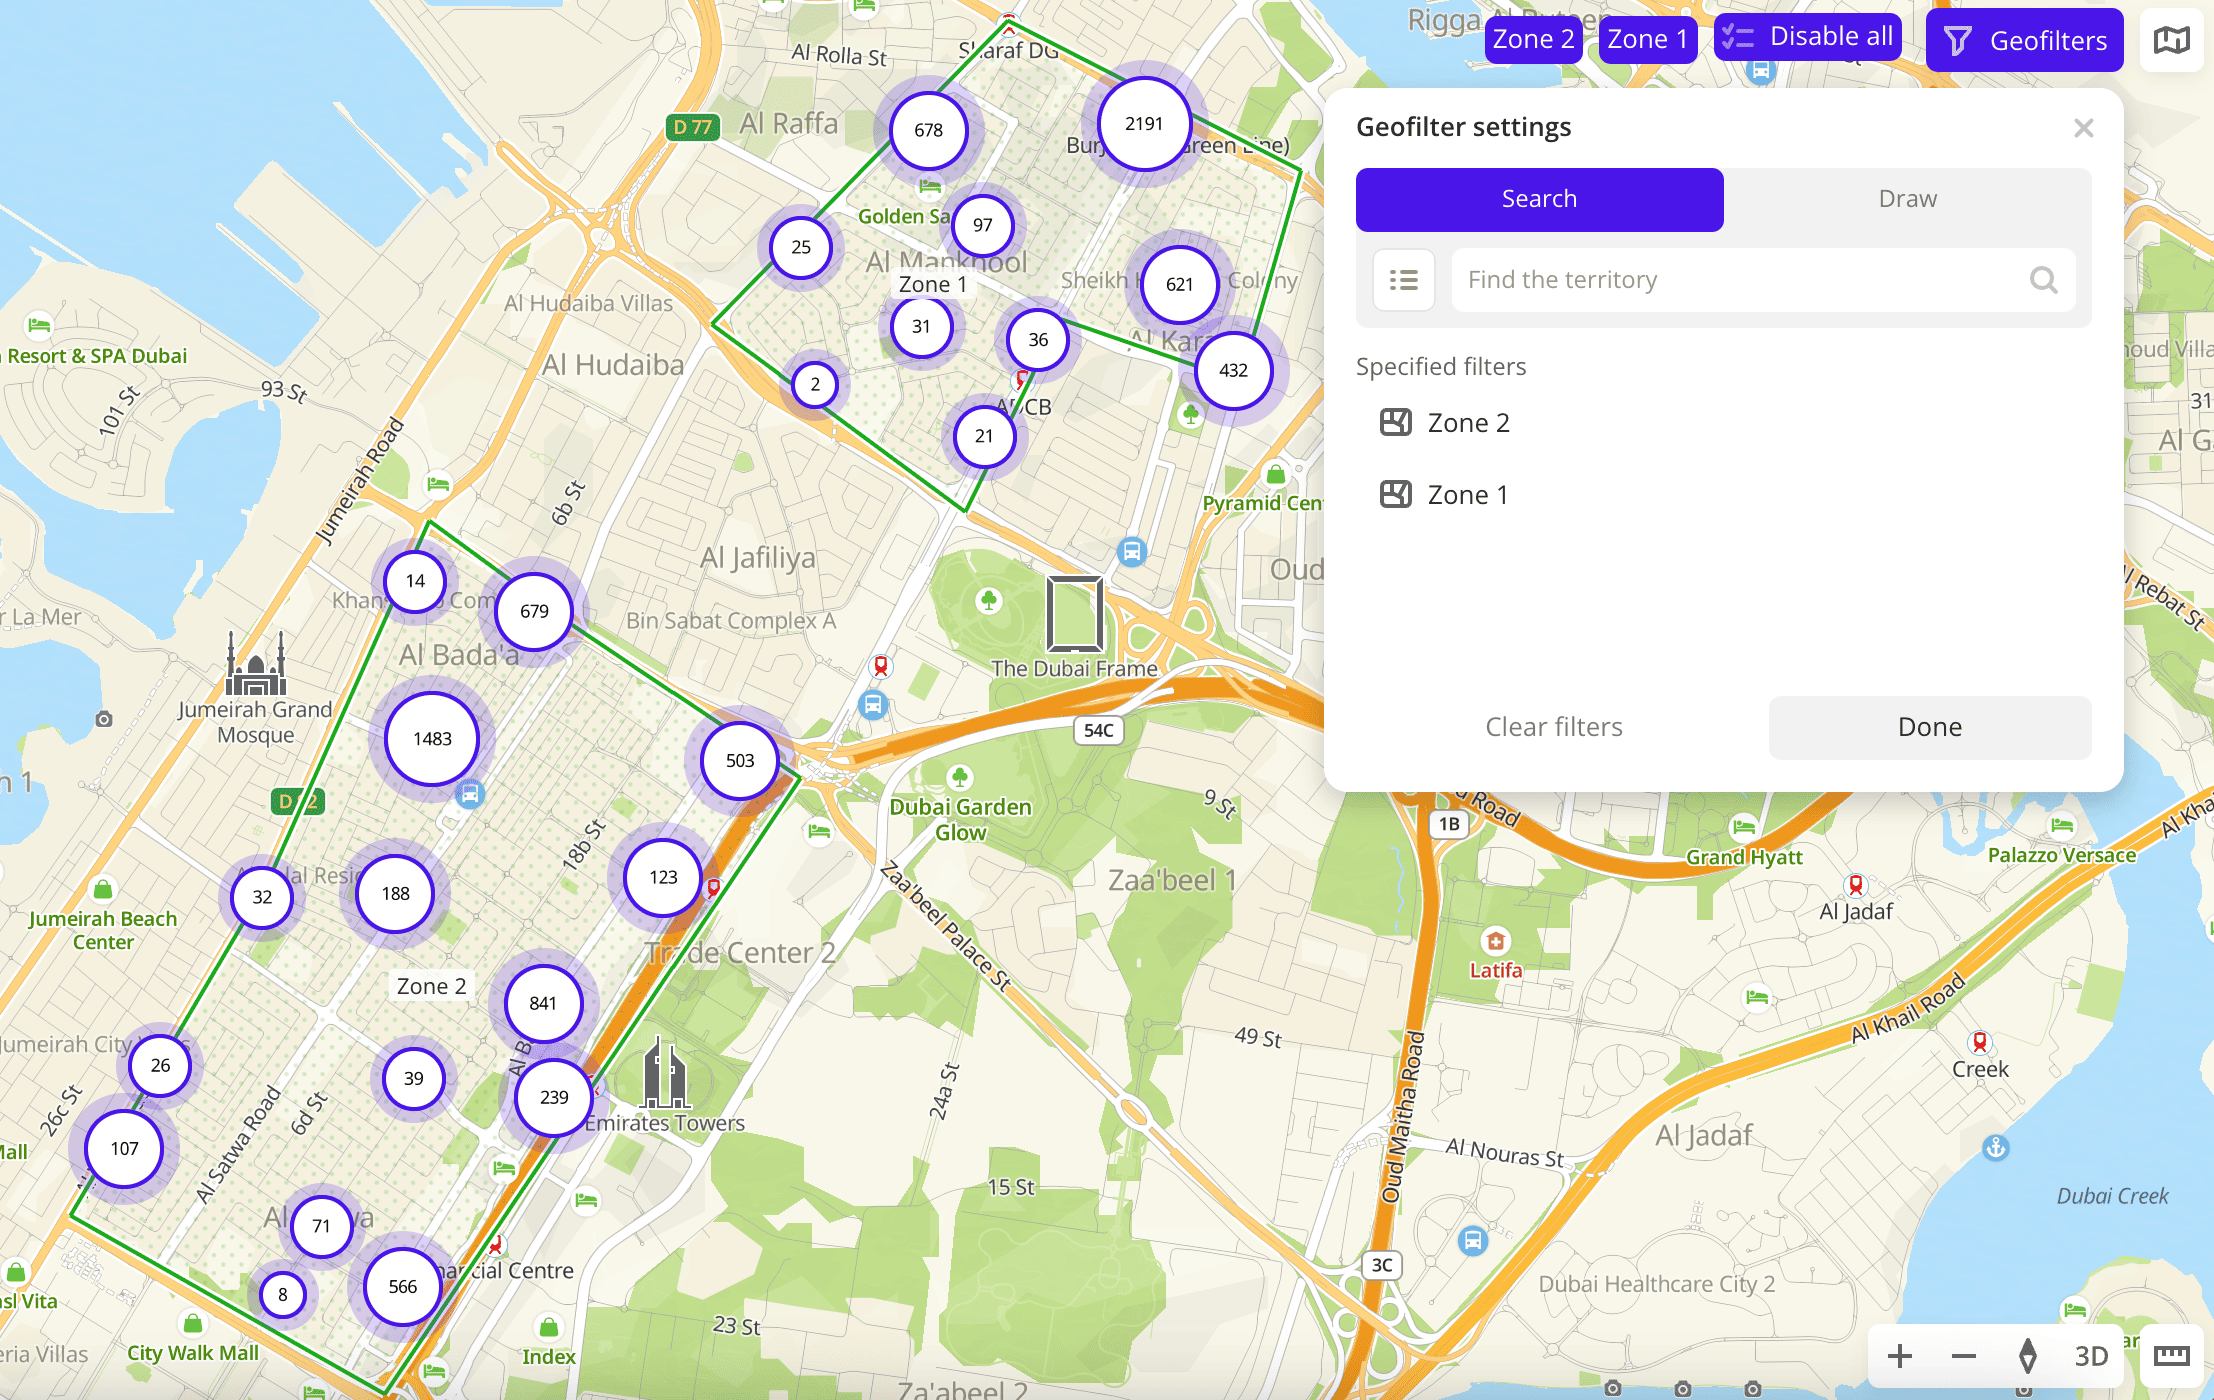
After that, when you filter data by territories, you can select the territories from the uploaded dataset in the Geofilter settings dialog:
4. Create a layer
To save the filtered sample and customize its visualization (e.g., as a heatmap), create a layer:
-
Go to the Main or Data tab.
-
Select the uploaded dataset.
-
In the Geofilter settings dialog, select up to 50 territories for which the data sample is created. You can use standard and custom territories and also build polygons, proximity zones, and circles on the map. For more information, see the Geofilters section. After you select the territories, click Done.
-
If the uploaded data contains geometries of the line or polygon type, select the data display method at the top of the Filters tab:
- Points: as centroid points (the centers of the object geometries).
- Geometries: as real data geometries (lines or polygons).
-
On the Filters tab, set the remaining filters if necessary.
-
Click Create layer.
-
Enter a layer name.
-
If there is at least one dashboard created, in the dialog, select the dashboard and scene to add the layer to. You can create a new dashboard or a new scene:
- To create a dashboard, click New dashboard and enter a name.
- To create a scene in an existing dashboard, in the Select scene field, click
 icon and enter a name.
Click Create.
If there are no created dashboards, a dashboard with one scene will be created, and the layer with data will be automatically added to it.
What's next?
- See Operations with datasets.
- Getting started.
- Get to know more about other Data categories.
- Get to know how to work with Data visualization.
- Learn more about Layers, Dashboards, Scenes, and Widgets.
- Learn about ready-made Analytics scenarios.