Car traffic (aggregated)
The Car traffic (aggregated) dataset provides information on average hourly car traffic. Traffic is grouped by days of the week and months.
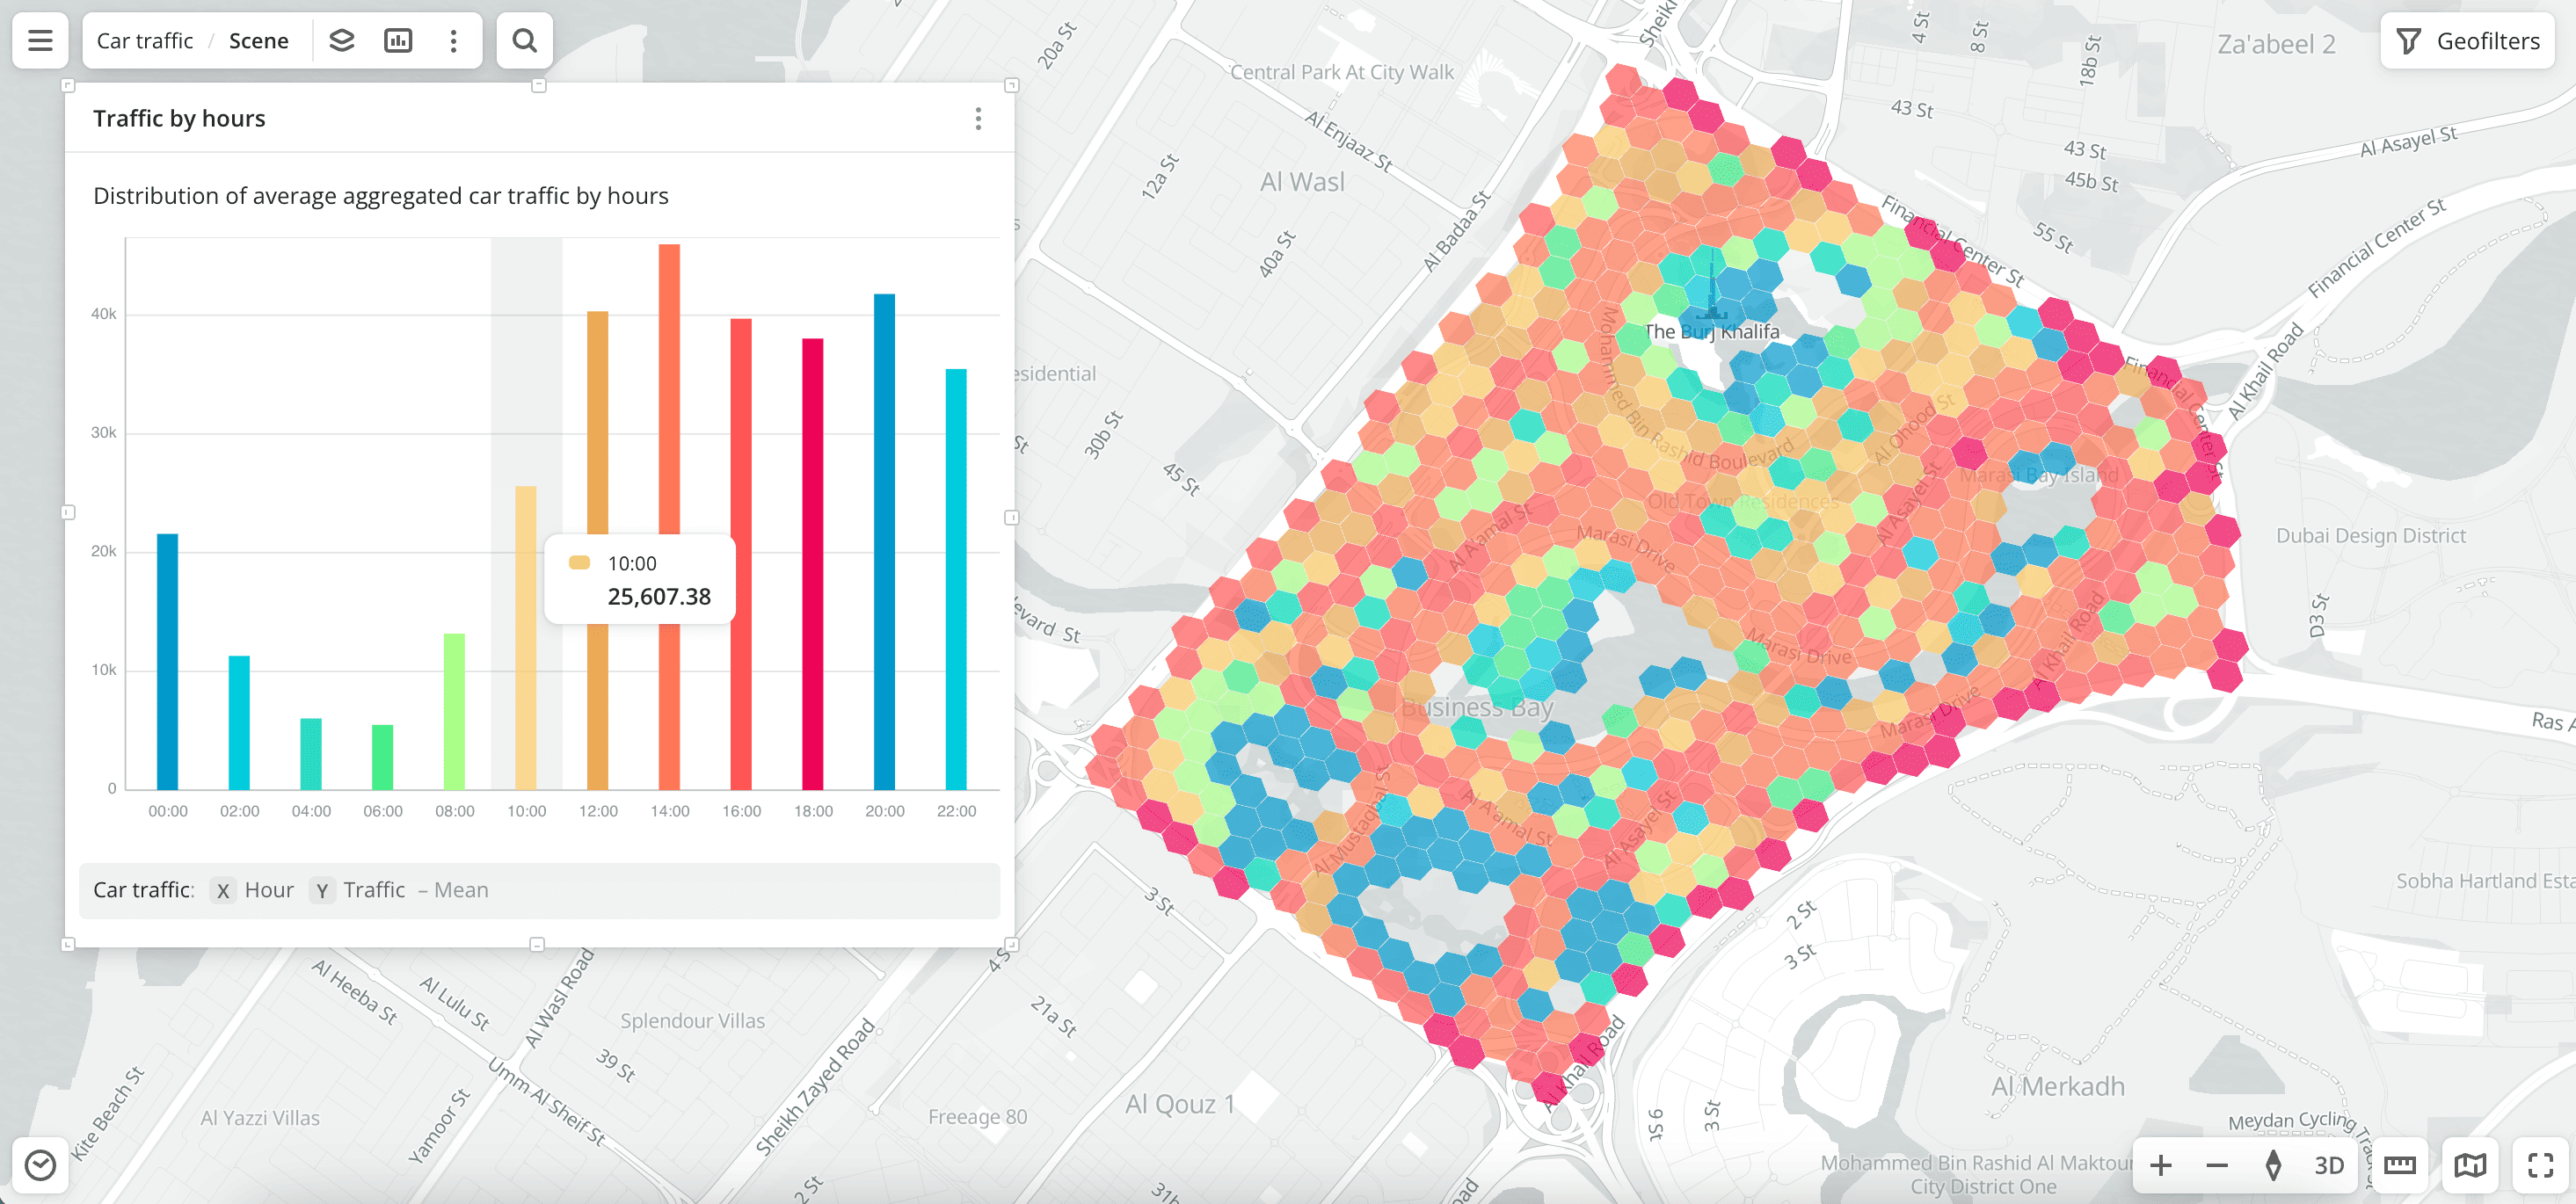
Aggregated car traffic allows you to observe the general distribution of traffic in a city or area. Traffic is presented as H3 cells: the approximate diameter of an H3 cell with the 10 resolution is 66 m, and with the 9 resolution is 175 m.
If you need car traffic data with street-level accuracy and direction of travel detail, use the Detailed car traffic dataset.
Usage scenarios
The Car traffic (aggregated) dataset helps to solve the problems:
- Transportation planning and road construction. It helps to determine traffic congestion and to make decisions about constructing new roads and interchanges or expanding existing ones. For example, high car traffic in a certain area may indicate the need to improve the transport infrastructure.
- Selecting a location for opening a business. It helps to select a location with a large number of passing cars and customer flow for a store, restaurant, gas station, etc.
- Urban planning. It helps to design residential areas, taking into account traffic flows. Traffic shows where new sidewalks, intersections, bus stops, or metro stations need to be built.
- Outdoor advertising. It helps to select locations for billboards and place advertisements on streets with high car traffic.
- Geospatial analysis. You can aggregate data or build proximity zones. For example, find out how many cars pass through a certain polygon or a proximity zone and also count the amount of traffic in a 1 km area from the store or a 15-minute proximity zone by car.
How is the data collected?
The algorithm for calculating car traffic consists of the following steps:
- Collecting GPS tracks of users of the 2GIS application navigator.
- Determining unique trip identifiers within H3 cells with the
10resolution. - Using coefficients to correct data. The step helps to use not only the 2GIS application data but also to show the real traffic congestion on the roads. The following indicators are used:
- Total count of 2GIS application users.
- Count of living population in the city.
- Proportion of people using cars among the population.
- Percentage of the working-age population.
- Calculating the average count of trips separately for each day of the week.
- Calculating the hourly traffic separately for each day of the week.
Data update and history
- Update frequency: data is updated once a month.
- History: historical data for the last 12 months is available.
Available territories
Data is available for the following countries:
- Azerbaijan
- Armenia
- Belarus
- Georgia
- Kazakhstan
- Kyrgyzstan
- Russia
- Uzbekistan
The data may not be available throughout the entire country, but only in populated areas where 2GIS is present and where data on user trips is collected. To check data availability, use geofilters or contact technical support.
Data availability
-
Cloud-based (2GIS Pro service):
- Demo tariff plan: data is not available. To start working with the data, change the tariff plan and request access to the dataset.
- Other tariff plans: data is available upon request.
-
On-Premise (installation of the service in a private environment): data is not available.
Getting started
- Go to the Main or Data tab.
- Select the Car traffic dataset.
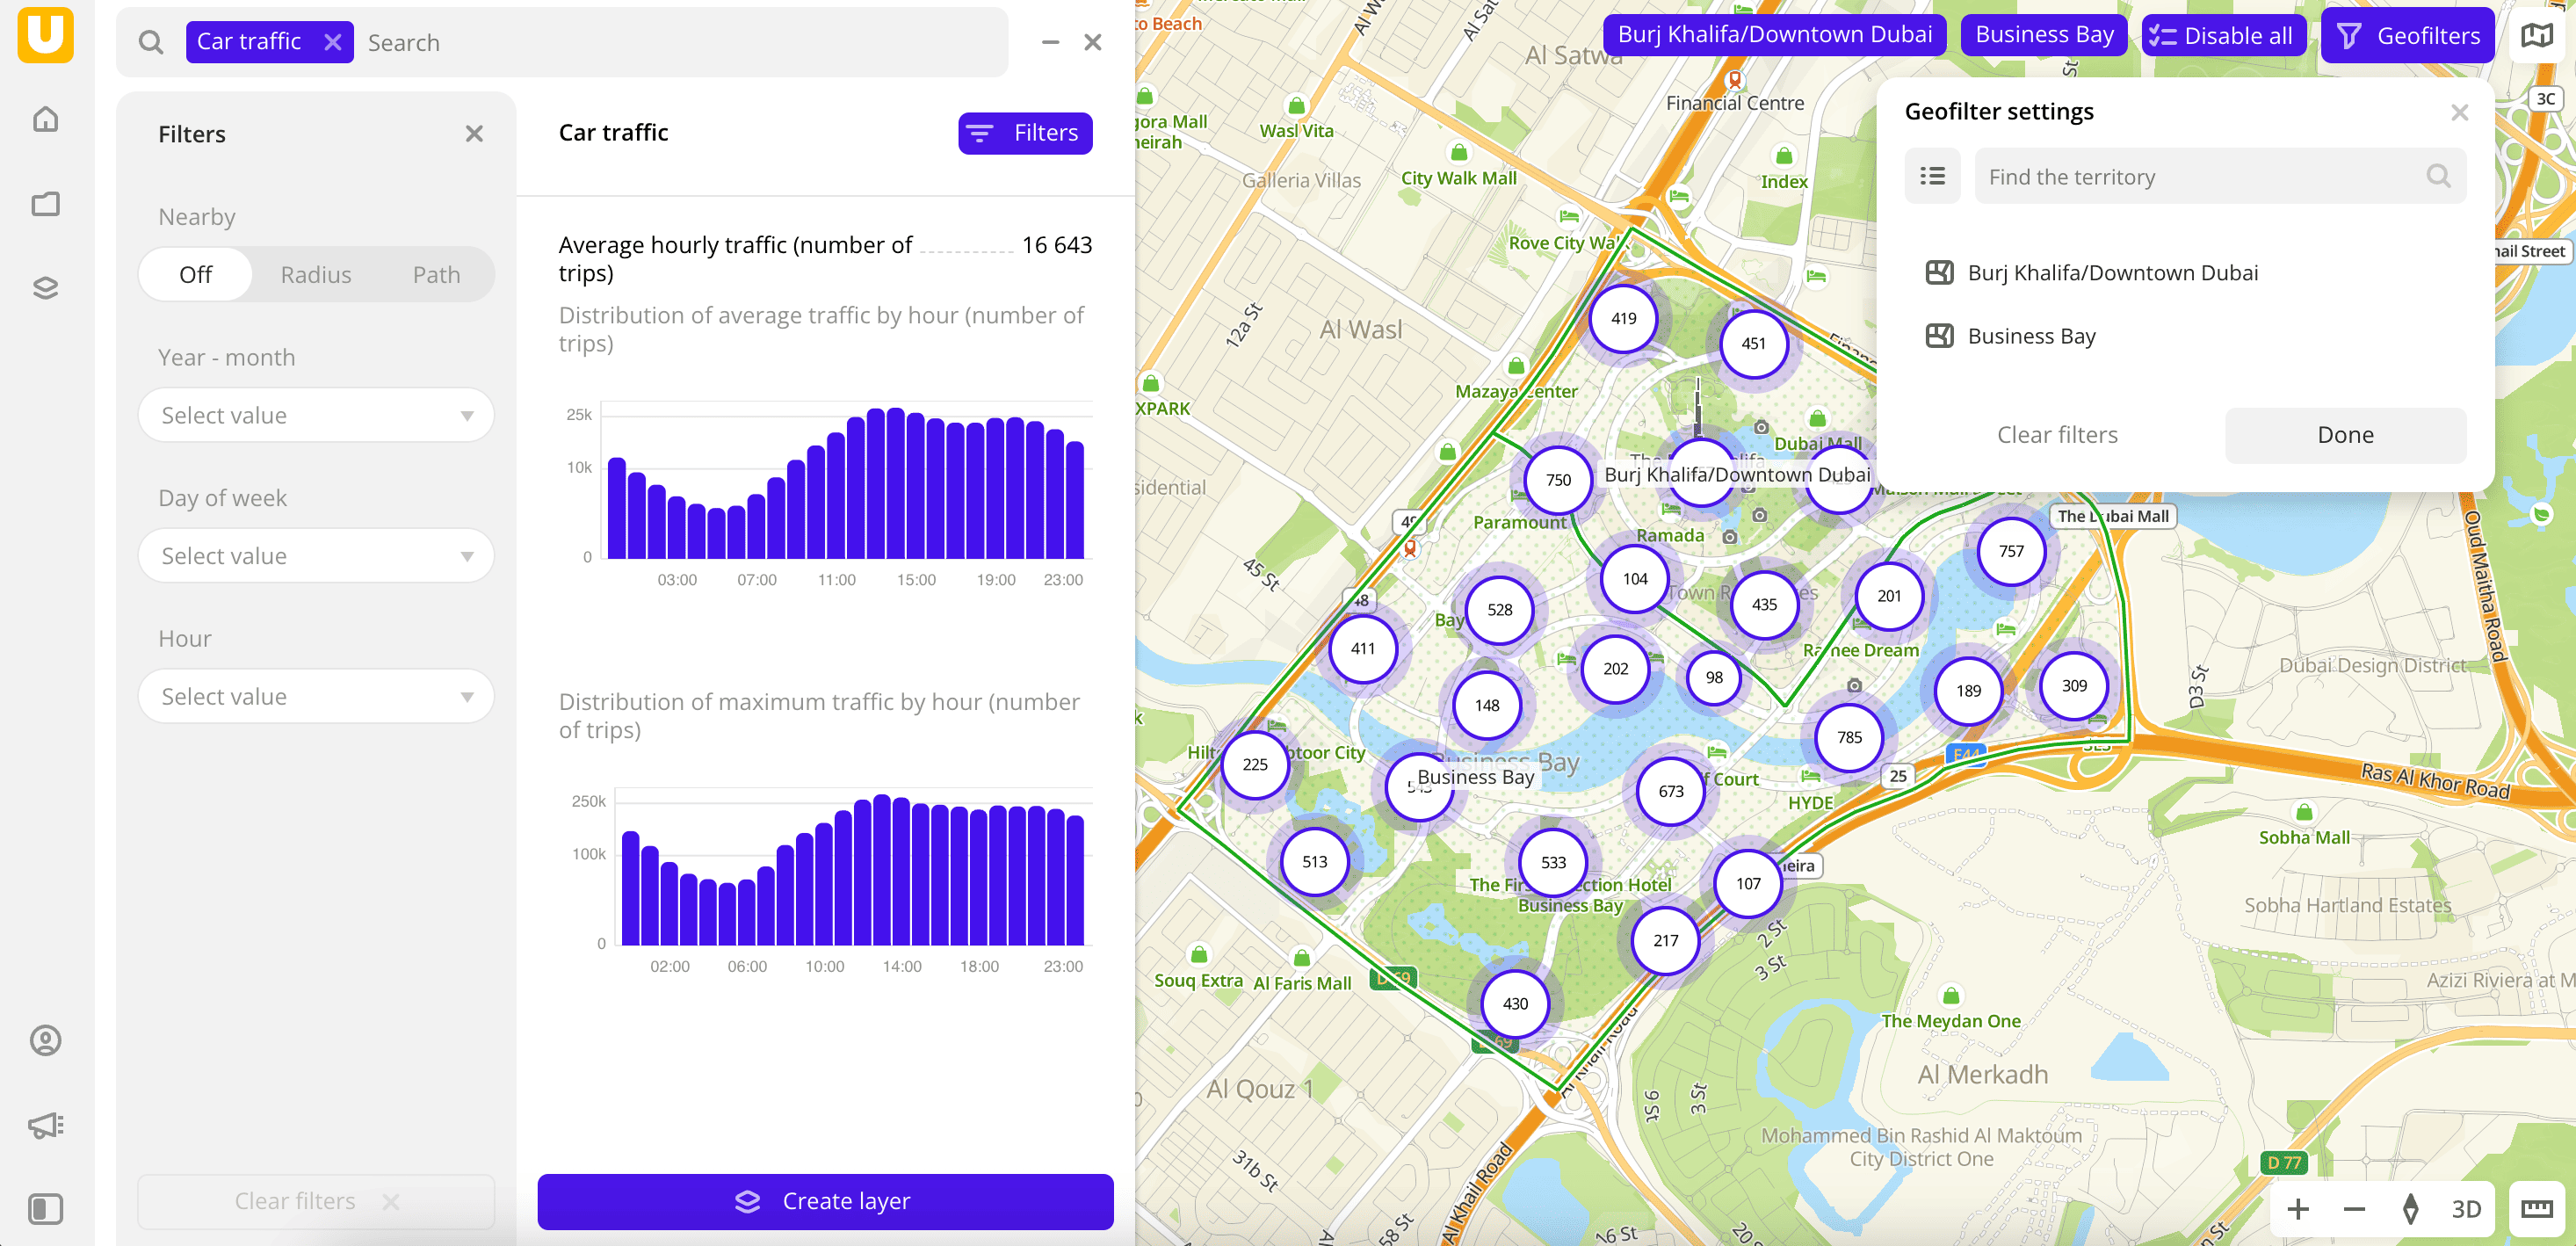
- In the Geofilter settings dialog, select up to 50 territories for which the data sample is created. You can use standard and custom territories and also build polygons, proximity zones, and circles on the map. For more information, see the Geofilters section. After you select the territories, click Done.
- On the Filters tab, set the remaining filters if necessary.
The data is displayed on the map as centroid points: the centers of the object geometries. Available filtering results:
- Average hourly count of registered trips.
- Distribution of average traffic by hour.
- Distribution of maximum traffic by hour.
To save the data sample, click Create layer and customize data visualization.
Filters
For the Car traffic (aggregated) dataset, the following filters are available:
- Year-month: year and month to display data. You can select multiple options.
- Day of week: day of the week to display data. You can select multiple options.
- Hour: hour to display data. You can select multiple options.
- Traffic: amount of traffic per day.
To reset the parameter filter, click ![]() icon next to the filter name. To reset all parameter filters, click Reset filters at the bottom of the tab.
icon next to the filter name. To reset all parameter filters, click Reset filters at the bottom of the tab.
To hide the filter by territory, in the Geofilter settings dialog, click ![]() icon next to the geofilter name. To delete the geofilter, click
icon next to the geofilter name. To delete the geofilter, click ![]() icon next to its name. To delete all geofilters, click Clear filters.
icon next to its name. To delete all geofilters, click Clear filters.
Data visualization
The following visualization methods are available for the dataset:
After creating the layer, configure a basic data visualization:
-
Select the H3 visualization method and set the Resolution parameter to
10: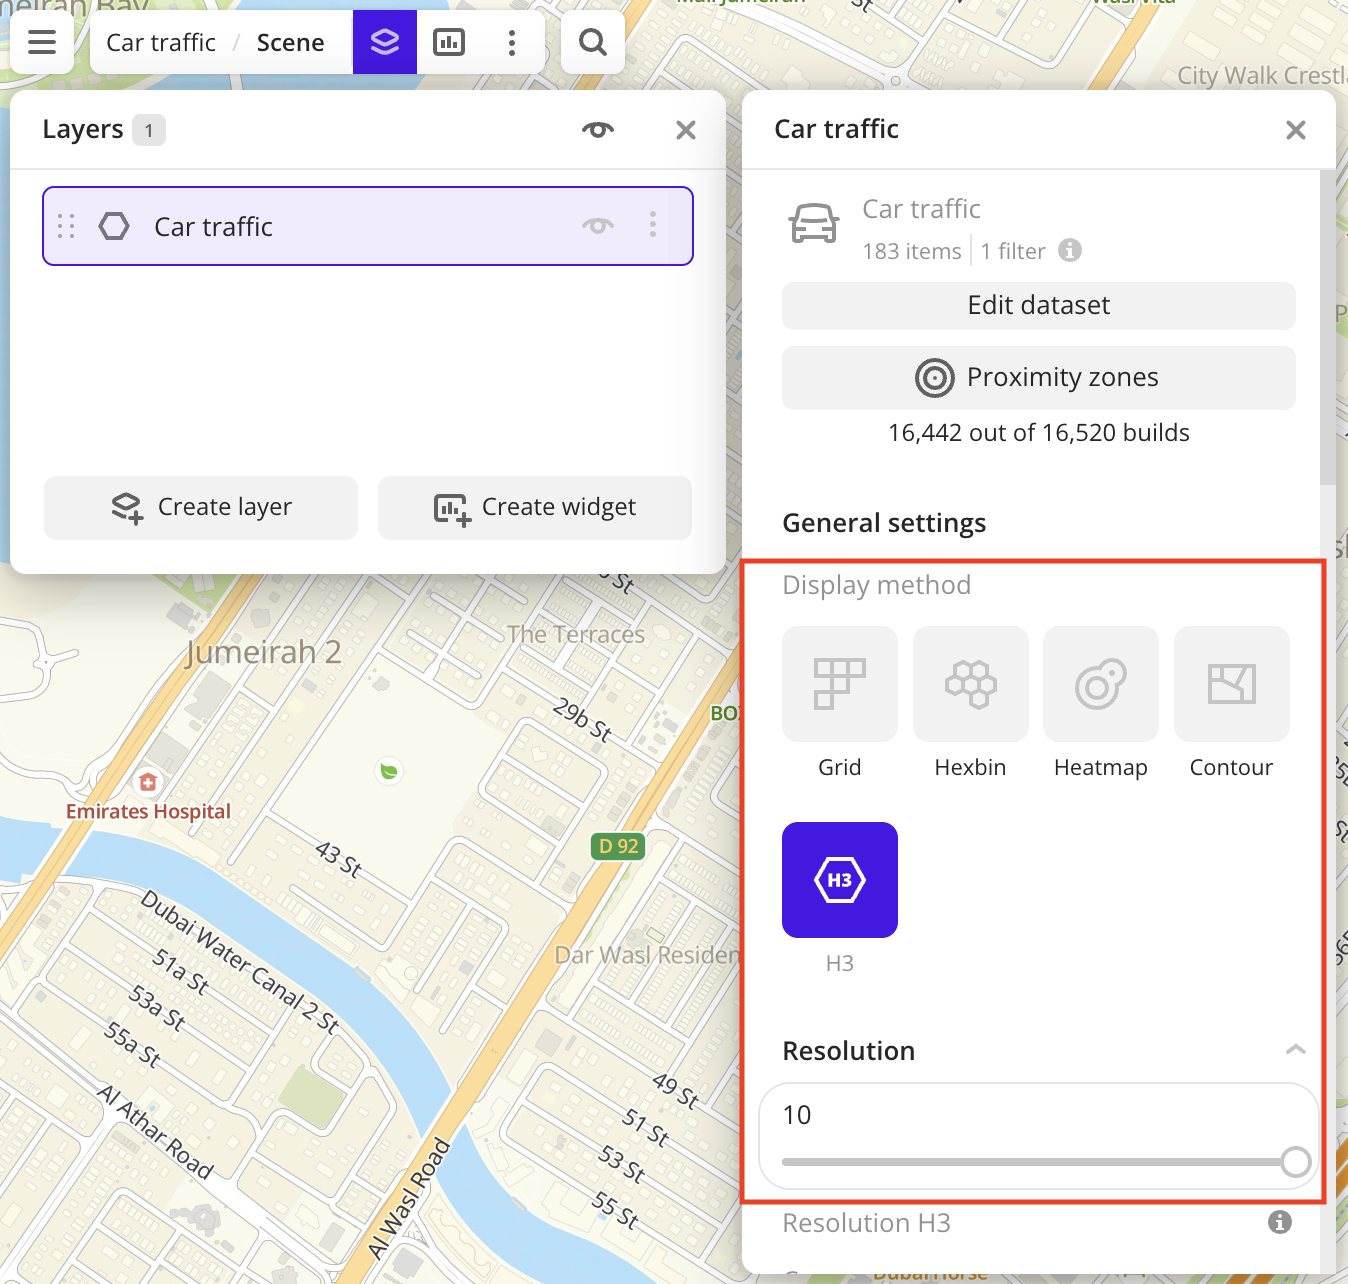
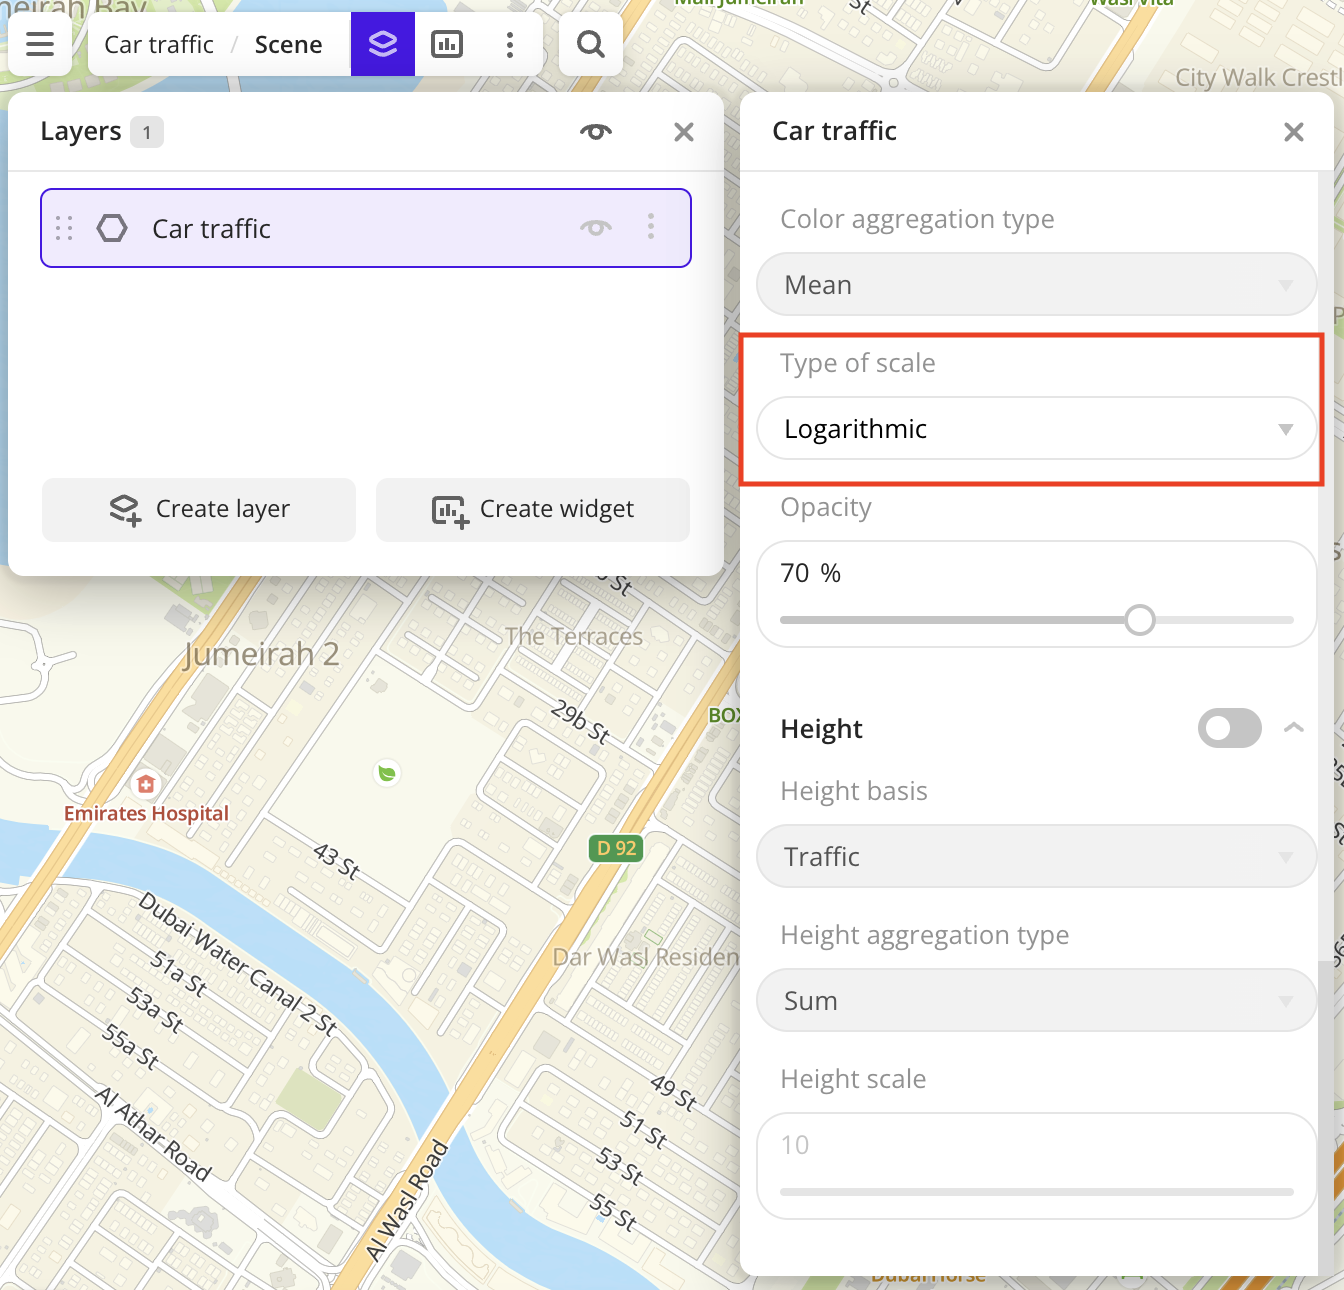
-
In the Type of scale field, select Logarithmic:
Data purchasing
You can purchase data separately as an export in the following formats:
- Table formats:
.csv.txt.json
- Formats for storing geographic data:
.shp(Shape).gpkg(GeoPackage).geojson(GeoJSON)
For more information about the price, available territories, and how to purchase data, fill out the form on urbi.ae.
What's next?
- Getting started.
- Get to know more about other Data categories.
- Get to know how to work with Data visualization.
- Learn more about Layers, Dashboards, Scenes, and Widgets.
- Learn about ready-made Analytics scenarios.