Terminals and ATMs
The Terminals and ATMs dataset provides information about places of payment for services that do not require the presence of service personnel (payment machines, ATM machines, and others).
Usage scenarios
The Terminals and ATMs dataset helps to solve the problems:
-
Optimizing ATM and terminal network. It helps banks to analyze the density and geographic distribution of ATMs and terminals to reduce underutilized devices and install new ones in areas with high demand.
-
Selecting locations for new payment terminals. It helps payment infrastructure operators to identify optimal locations for installing terminals by analyzing service payment demand in high-traffic and low-competition areas, such as shopping malls, railway stations, and markets.
-
Analyzing competitive market for financial services. It assists banks and fintech companies in monitoring competitor activity using organization-based filters. For example, it enables identifying new terminal installation points and analyzing device presence at specific bank locations.
How is the data collected?
2GIS specialists regularly collect and verify data: for details, see the About 2GIS data page.
Data update and history
- Update frequency: data is updated once a week.
- History: historical data is not available. You can only view the latest updated data.
Available territories
Data is available for the following countries:
- Azerbaijan
- Armenia
- Belarus
- Kazakhstan
- Kyrgyzstan
- Russia
- Uzbekistan
The data may not be available throughout the entire country, but only in populated areas where 2GIS is present. To check data availability, use geofilters or contact technical support.
Data availability
-
Cloud-based (2GIS Pro service):
- Demo tariff plan: data is not available. To start working with the data, change the tariff plan and request access to the dataset.
- Other tariff plans: data is available upon request.
-
On-Premise (installation of the service in a private environment): data is available.
Getting started
- Go to the Main or Data tab.
- Select the Terminals and ATMs dataset.
- In the Geofilter settings dialog, select up to 50 territories for which the data sample is created. You can use standard and custom territories and also build polygons, proximity zones, and circles on the map. For more information, see the Geofilters section. After you select the territories, click Done.
- On the Filters tab, set the remaining filters if necessary.
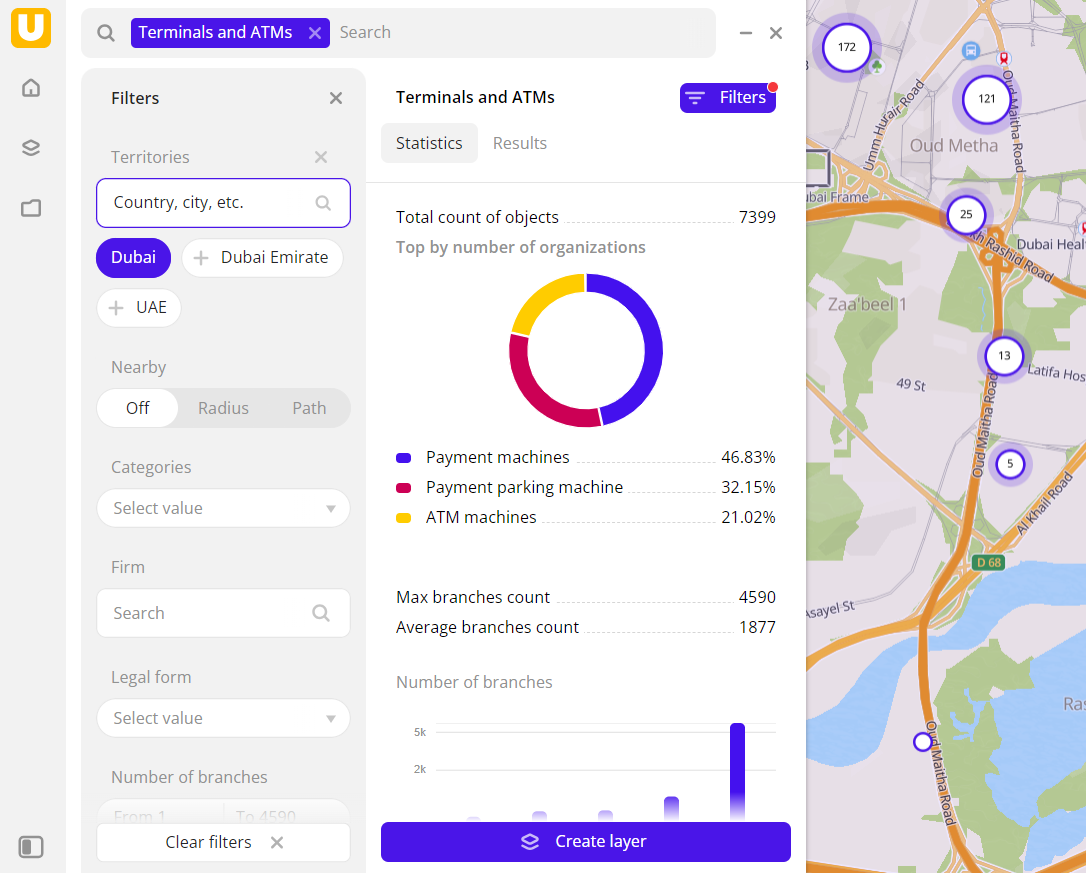
The data is displayed on the map as points. Filtering results are available on two tabs:
-
Statistics: general statistics about the sample:
- Total count of objects.
- Chart with the distribution of objects by categories. Displayed if multiple categories are selected.
- Maximum and average count of branches.
-
Results: general information about objects and their list. When selecting an object from the list:
- Information about the object is displayed in the card.
- The location of the object is indicated on the map.
You can manually edit the list of filtering results to keep only selected objects in the data sample. To do this, click Edit list, select the objects, and click Apply.
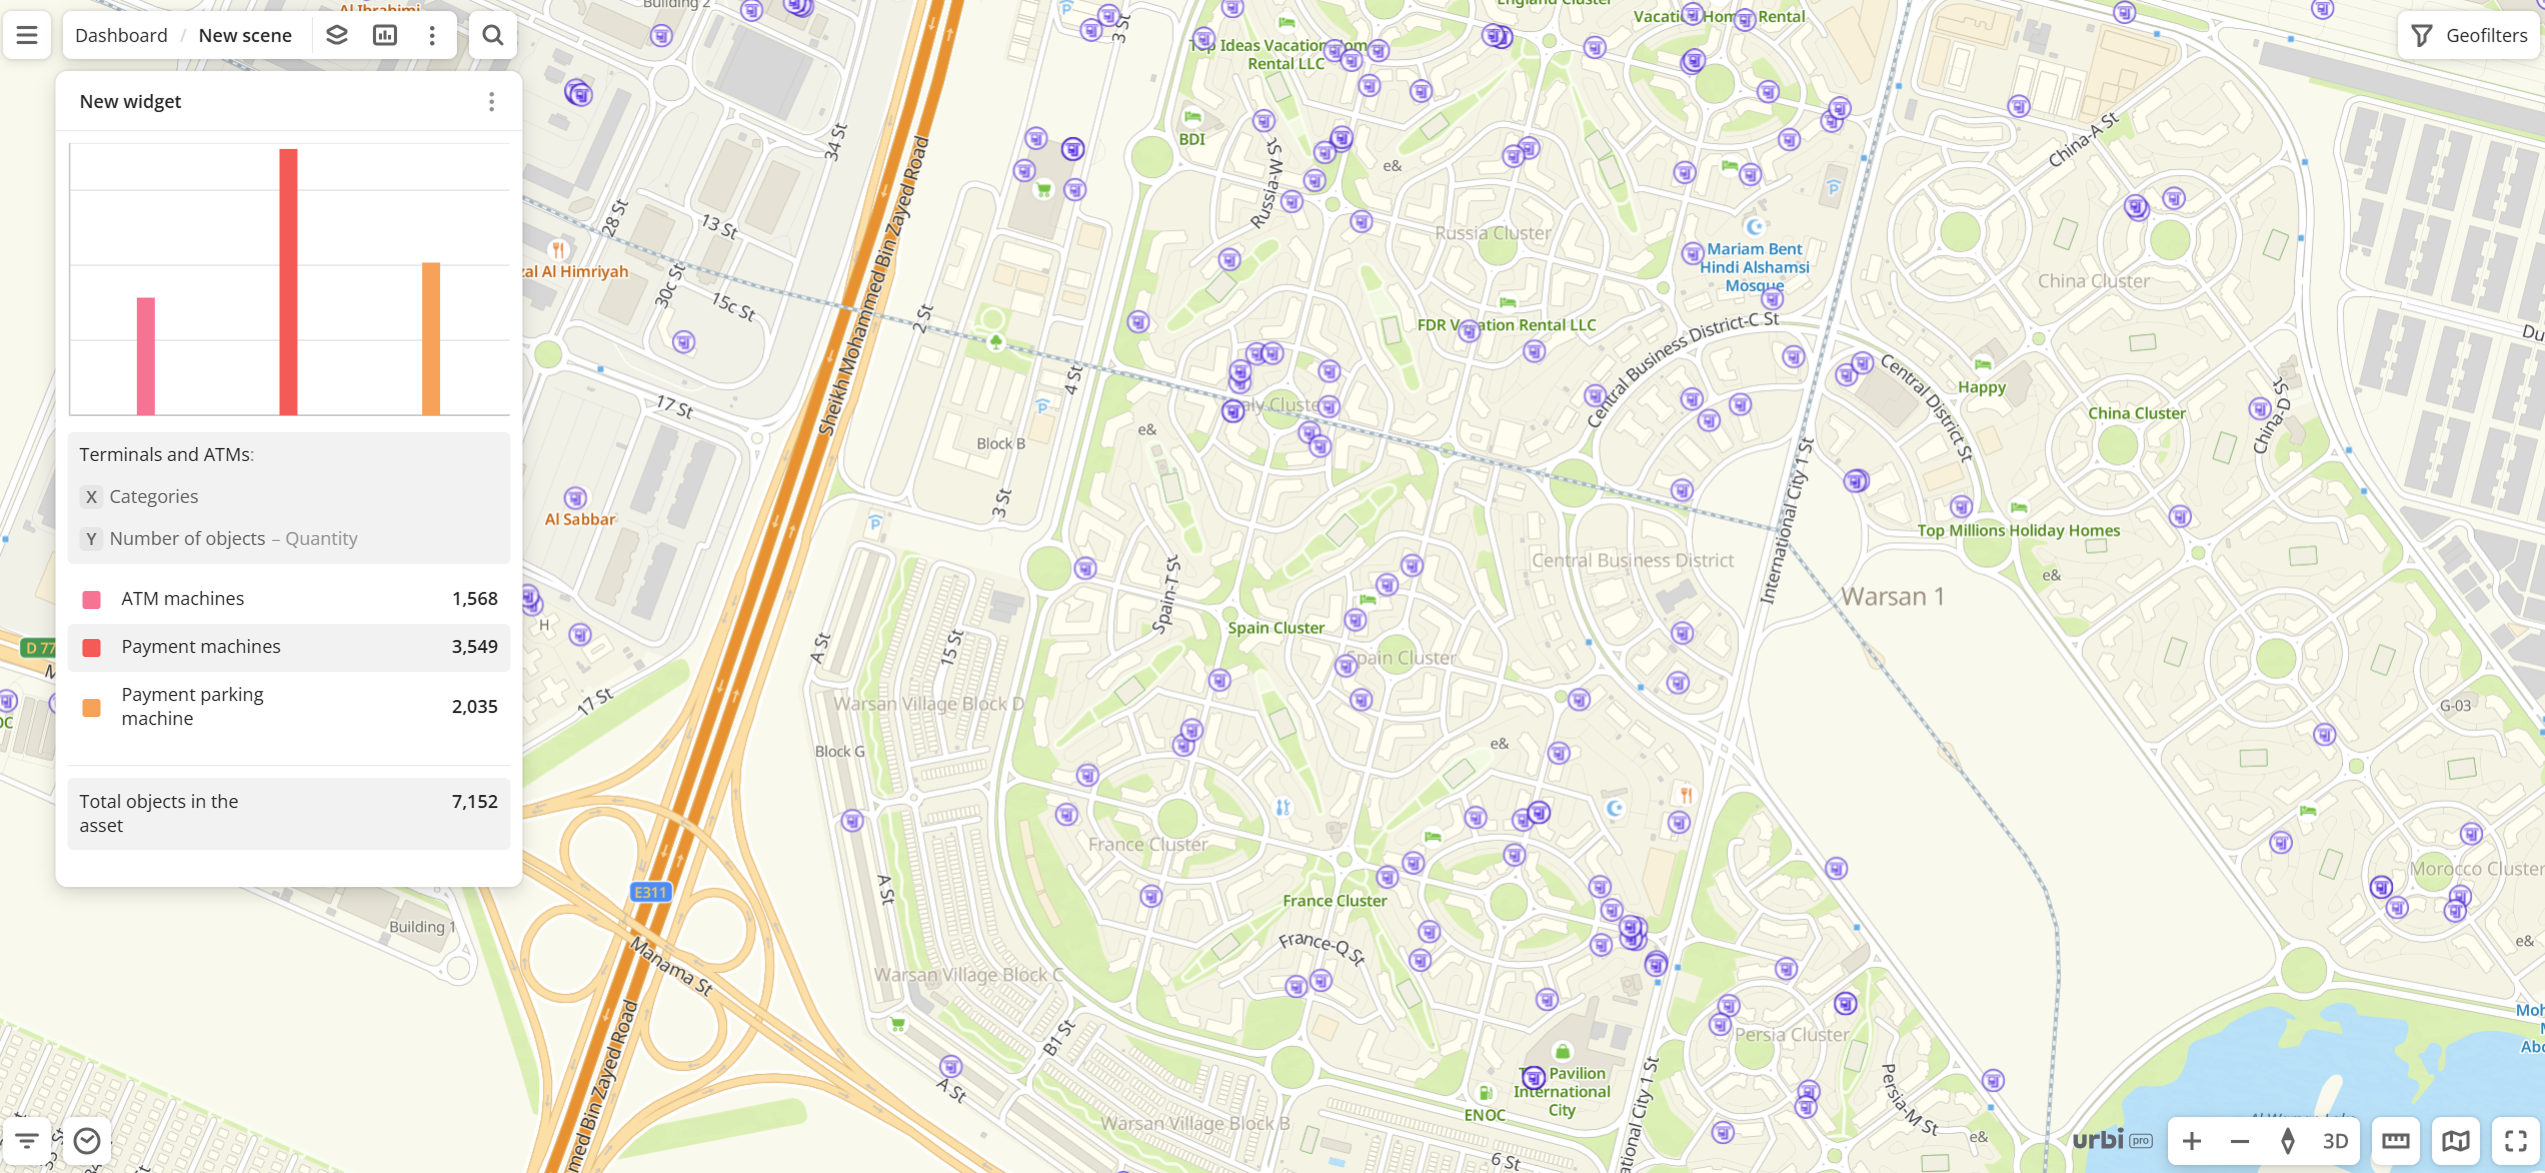
To save the data sample, click Create layer and customize data visualization.
Filters
For the Terminals and ATMs dataset, the following filters are available:
- Categories: object categories. You can select multiple categories.
- Firm: search for organizations that own terminals or ATMs by name.
- Legal form: legal form of the organization.
- Payment methods: method of payment available in the object.
- Service language: service language in the object.
- Round the clock: select to display only objects with a 24-hour work schedule.
- Rating: rating of the object from
1to5. - Number of reviews: count of reviews of the object.
To reset the parameter filter, click ![]() icon next to the filter name. To reset all parameter filters, click Reset filters at the bottom of the tab.
icon next to the filter name. To reset all parameter filters, click Reset filters at the bottom of the tab.
To hide the filter by territory, in the Geofilter settings dialog, click ![]() icon next to the geofilter name. To delete the geofilter, click
icon next to the geofilter name. To delete the geofilter, click ![]() icon next to its name. To delete all geofilters, click Clear filters.
icon next to its name. To delete all geofilters, click Clear filters.
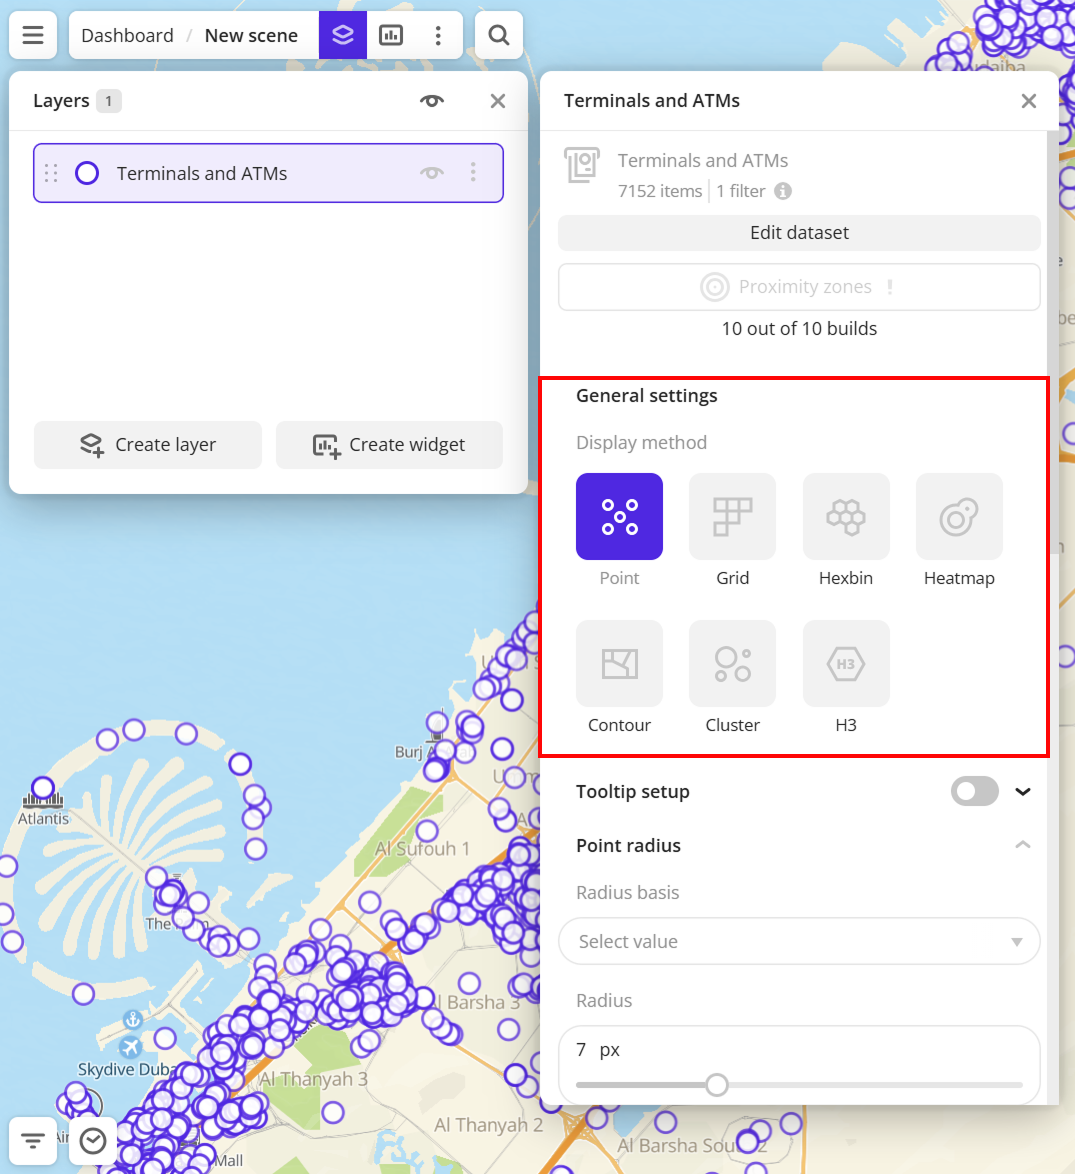
Data visualization
The following visualization methods are available for the dataset:
After creating the layer, configure a basic data visualization:
-
Select the Point visualization method:
-
In the Icon field, select the icon to display points on the map:
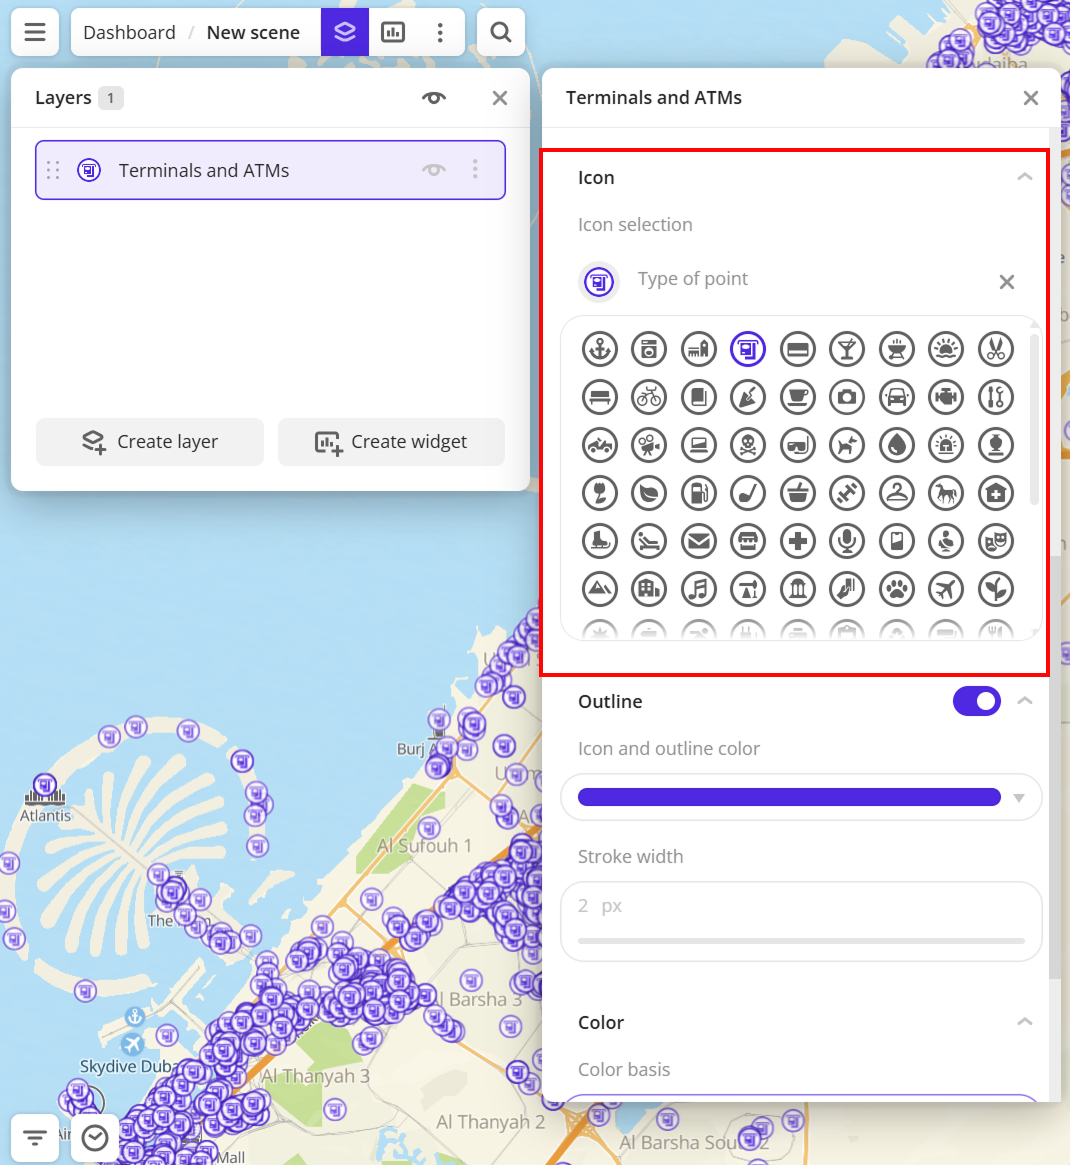
Data purchasing
You can purchase data separately as an export in the following formats:
- Table formats:
.csv.txt.json
- Formats for storing geographic data:
.shp(Shape).gpkg(GeoPackage).geojson(GeoJSON)
For more information about the price, available territories, and how to purchase data, fill out the form on urbi.ae.
What's next?
- Getting started.
- Get to know more about other Data categories.
- Get to know how to work with Data visualization.
- Learn more about Layers, Dashboards, Scenes, and Widgets.
- Learn about ready-made Analytics scenarios.