Audience activity
The Audience activity dataset provides information about the activity of users of the 2GIS mobile application.
Usage scenarios
The Audience activity dataset helps to solve the problems:
- Selecting advertising time. It helps to identify peak hours and days for placing outdoor or digital advertisement on billboards, facades, and screens based on user activity data.
- Comparing areas by activity. It allows businesses (cafes, shops, and services) to identify areas with a high audience concentration and constant user flow.
- Planning work schedule. It helps to detect peak activity hours in selected locations and set staff schedules, delivery hours, opening times, and working hours of organizations.
How is the data collected?
The data is anonymized. Only general statistics for all users are calculated. The algorithm for calculating audience activity consists of the following steps:
-
Collecting records of logins to the mobile application over a month.
-
Grouping records of logins by:
- Device location at the moment of the login. The location is converted to an H3 cell (hexagon) with a
9resolution. For more information about the H3 visualization method, see the H3 instruction. - Day of the week and time of day of the login. Depending on the day of the login, it is counted in the
WeekdaysorWeekendcategory. Depending on the time, the login is counted in one of the categories:Night(from 00:00 to 05:59),Morning(from 06:00 to 11:59),Afternoon(from 12:00 to 17:59), orEvening(from 18:00 to 23:59). - Operating system of the device. If the login is recorded from iOS, it is counted in the
Applecategory; if from Android, in theAndroidcategory.
- Device location at the moment of the login. The location is converted to an H3 cell (hexagon) with a
-
Calculating the number of unique users in each group. Example of calculation: 150 unique users logged in a certain area (H3) on a weekday (
Weekdayscategory) morning (Morningcategory) using iOS devices (Applecategory).
Data update and history
- Update frequency: data is updated once a month.
- History: historical data for the last 12 months is available.
Available territories
Data is available for the following countries:
- Azerbaijan
- Armenia
- Belarus
- Georgia
- Kazakhstan
- Kyrgyzstan
- Russia
- Uzbekistan
The data may not be available throughout the entire country, but only in populated areas where 2GIS is present. To check data availability, use geofilters or contact technical support.
Data availability
-
Cloud-based (2GIS Pro service):
- Demo tariff plan: data is not available. To start working with the data, change the tariff plan and request access to the dataset.
- Other tariff plans: data is available upon request.
-
On-Premise (installation of the service in a private environment): data is not available.
Getting started
- Go to the Main or Data tab.
- Select the Audience activity dataset.
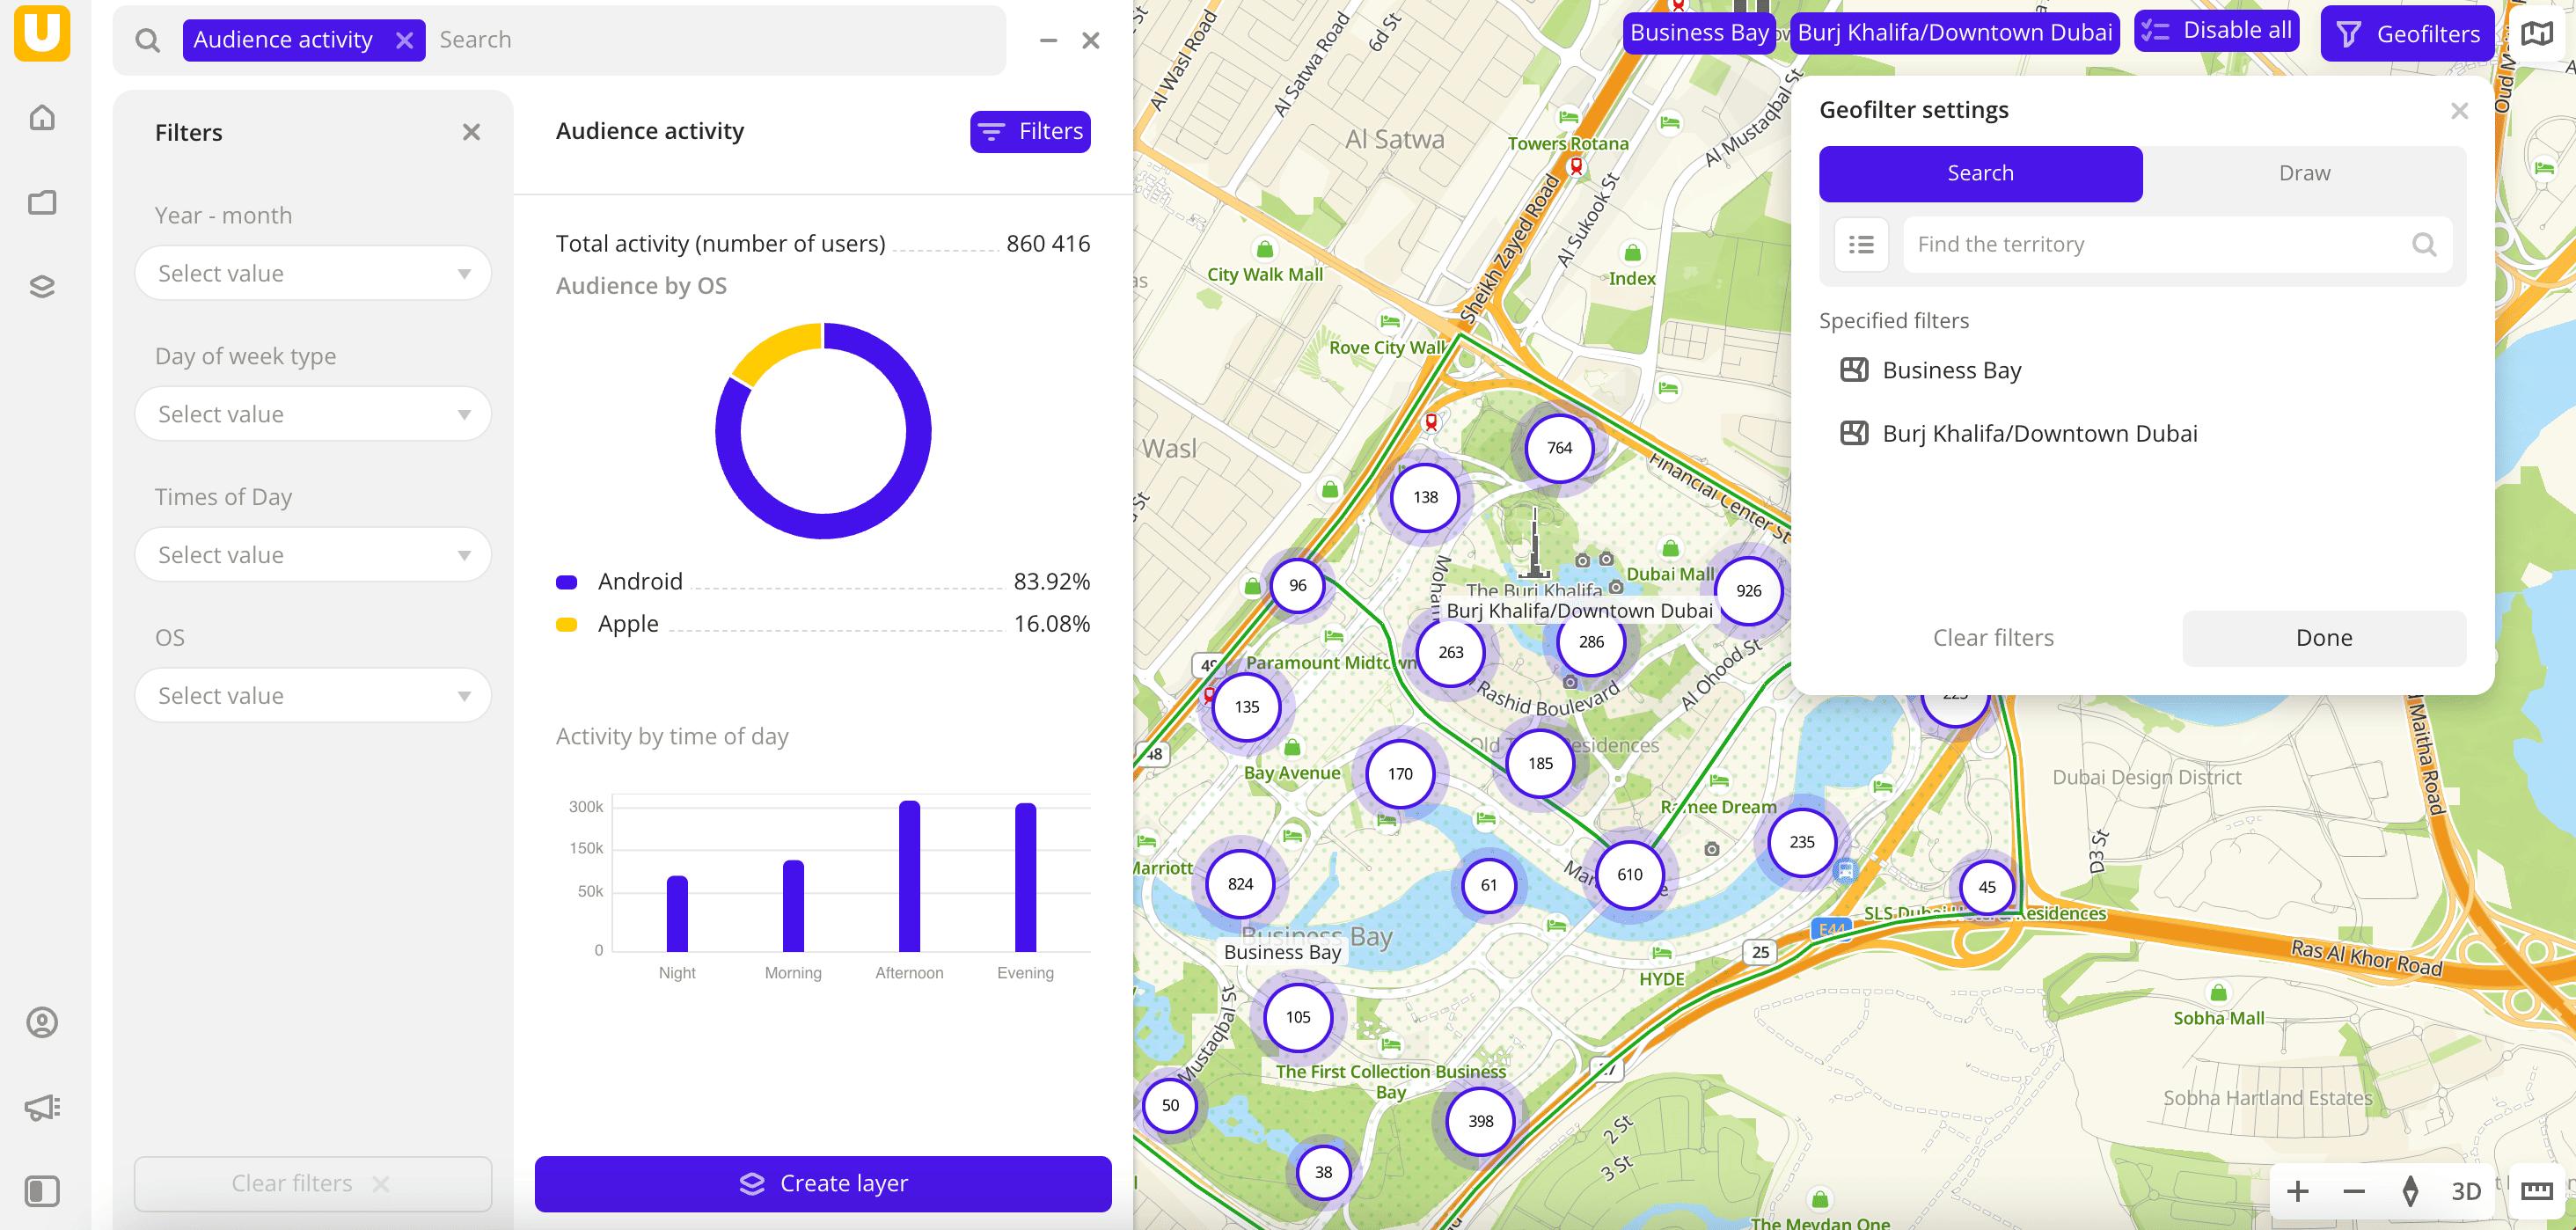
- In the Geofilter settings dialog, select up to 50 territories for which the data sample is created. You can use standard and custom territories and also build polygons, proximity zones, and circles on the map. For more information, see the Geofilters section. After you select the territories, click Done.
- On the Filters tab, set the remaining filters if necessary.
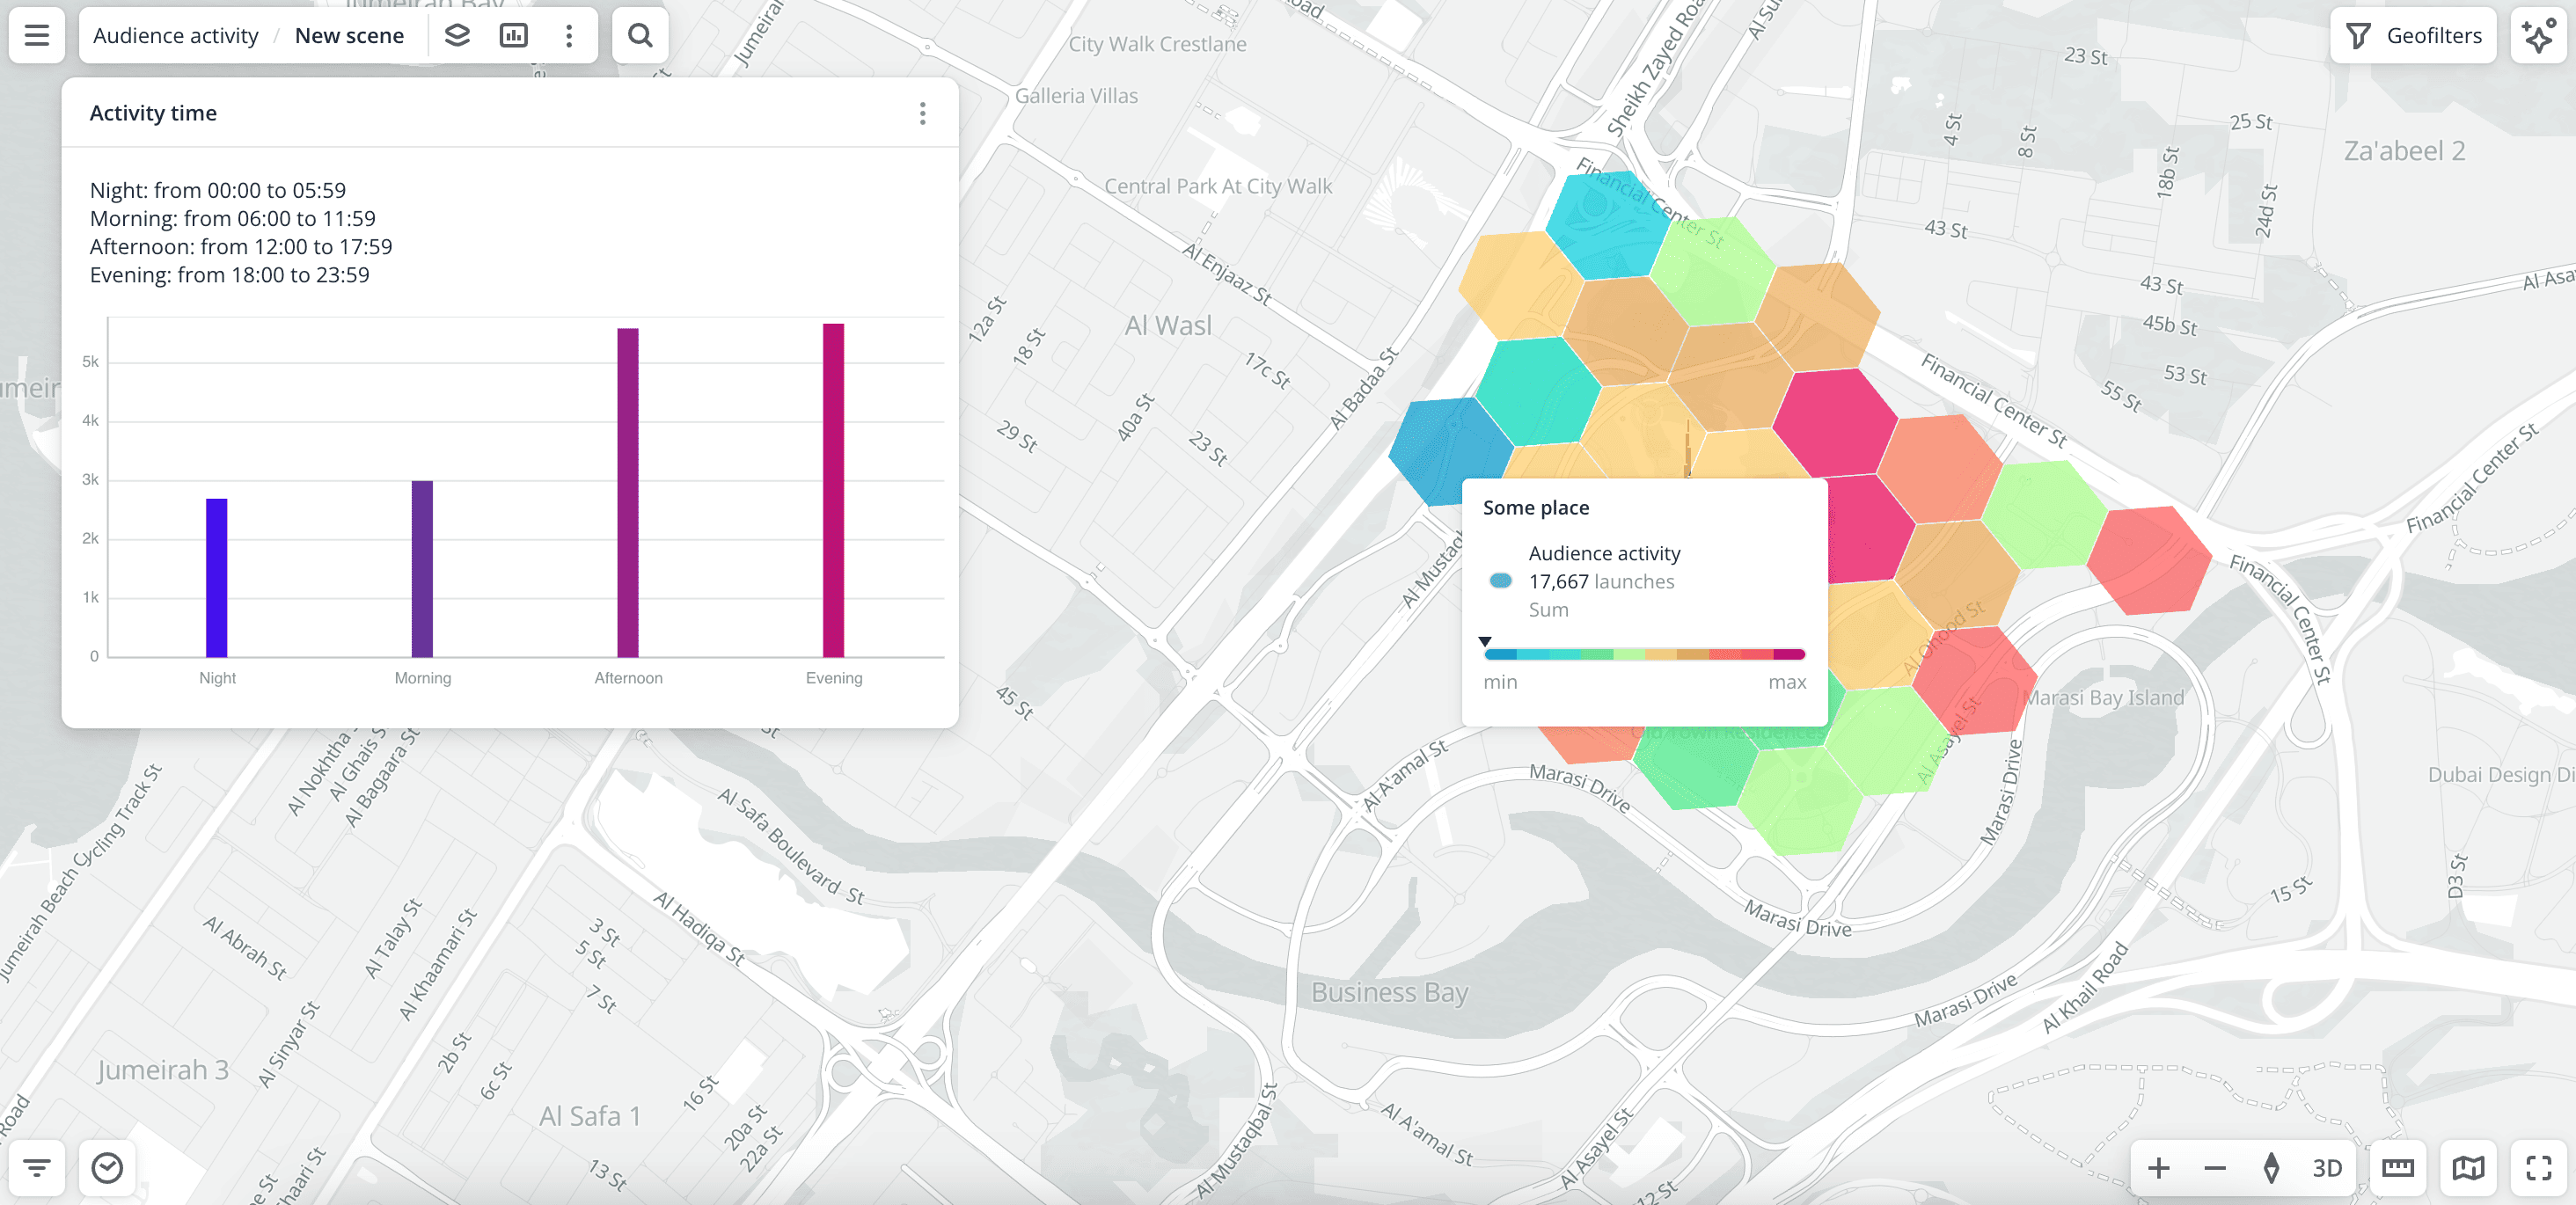
The data is displayed on the map as centroid points: the centers of the object geometries. Available filtering results:
- Total count of unique users of the mobile application. For more information on the algorithm for calculating unique users, see the How is the data collected? section.
- Chart with the distribution of operating systems on users' devices. Displayed if both operating systems are selected.
- Distribution of user activity (total count of logins to the application) depending on the time of day. Displayed if more than one value is selected.
To save the data sample, click Create layer and customize data visualization.
Filters
For the Audience activity dataset, the following filters are available:
- Year-month: year and month to display data. You can select multiple options.
- Day of week type:
WeekdaysandWeekend. - Time of day:
Morning(from 06:00 to 11:59 in the timezone of the selected territory),Afternoon(from 12:00 to 17:59),Evening(from 18:00 to 23:59), andNight(from 00:00 to 05:59). - OS: type of operating system of the user's device where the application is opened:
AndroidandApple. - Audience activity: amount of logins to the mobile application.
To reset the parameter filter, click ![]() icon next to the filter name. To reset all parameter filters, click Reset filters at the bottom of the tab.
icon next to the filter name. To reset all parameter filters, click Reset filters at the bottom of the tab.
To hide the filter by territory, in the Geofilter settings dialog, click ![]() icon next to the geofilter name. To delete the geofilter, click
icon next to the geofilter name. To delete the geofilter, click ![]() icon next to its name. To delete all geofilters, click Clear filters.
icon next to its name. To delete all geofilters, click Clear filters.
Data visualization
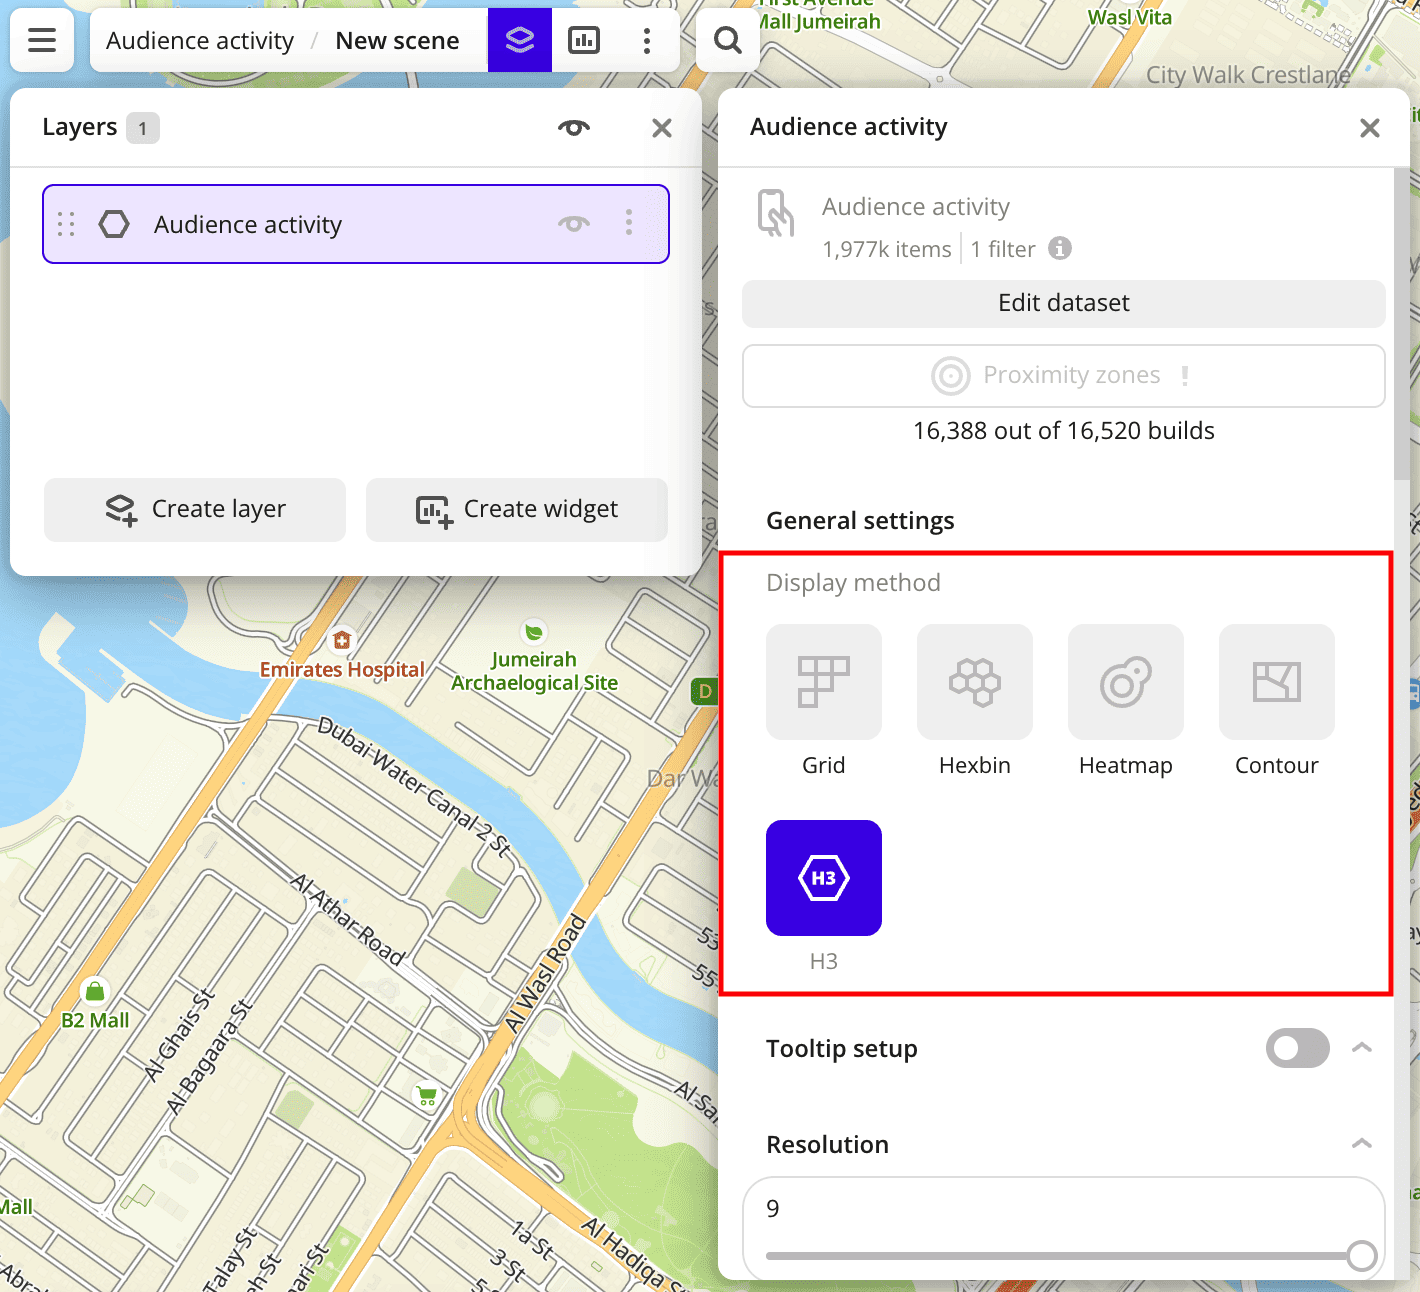
The following visualization methods are available for the dataset:
After creating the layer, configure a basic data visualization:
-
Select the H3 visualization method:
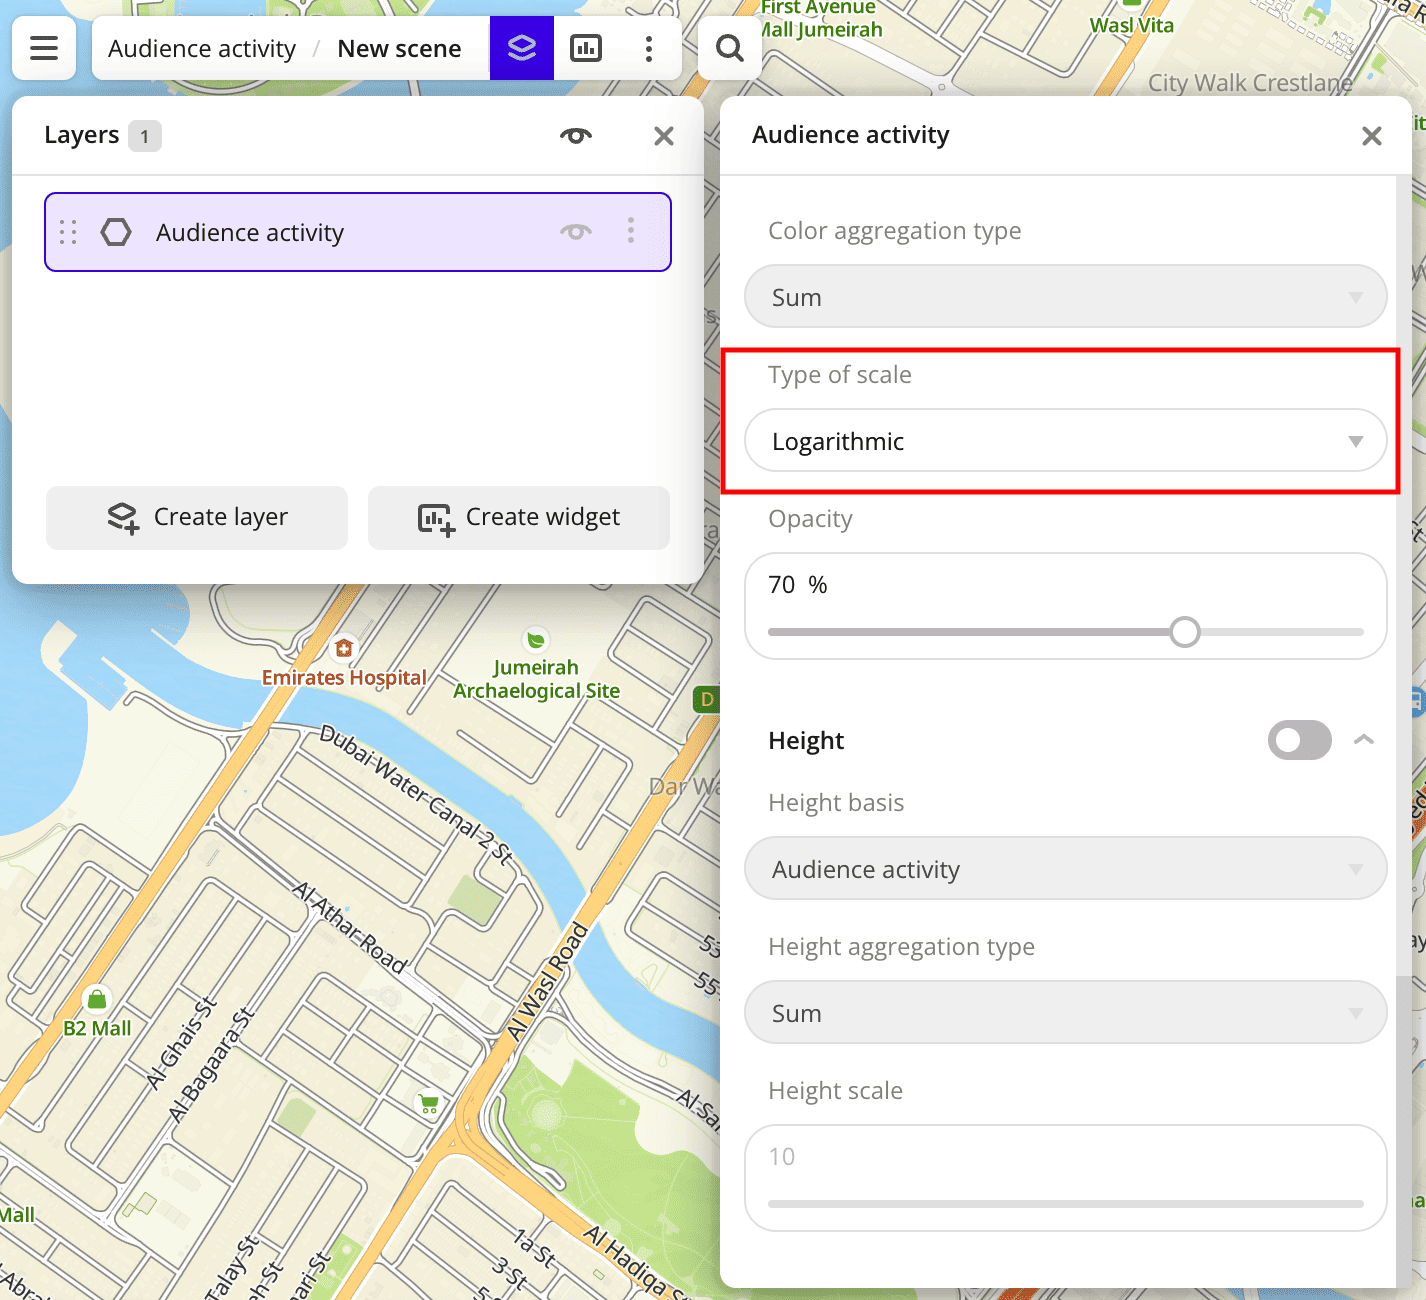
-
In the Type of scale field, select Logarithmic:
Data purchasing
You can purchase data separately as an export in the following formats:
- Table formats:
.csv.txt.json
- Formats for storing geographic data:
.shp(Shape).gpkg(GeoPackage).geojson(GeoJSON)
For more information about the price, available territories, and how to purchase data, fill out the form on urbi.ae.
What's next?
- Getting started.
- Get to know more about other Data categories.
- Get to know how to work with Data visualization.
- Learn more about Layers, Dashboards, Scenes, and Widgets.
- Learn about ready-made Analytics scenarios.