Overview
Widget is a visual element on a dashboard scene. You can add widgets with charts based on layer data, with text, and with indicators.
Widgets are divided into two groups:
- Custom widgets: you can create them, customize the content, and change their size and position on the scene.
- System widgets are available by default. These widgets cannot be deleted, but you can hide them on the scene.
Custom widgets
| Widget | Description | Example |
|---|---|---|
| Bar chart | Suitable for comparing data in different groups. Data is grouped on the Y-axis and displayed as horizontal bars. | 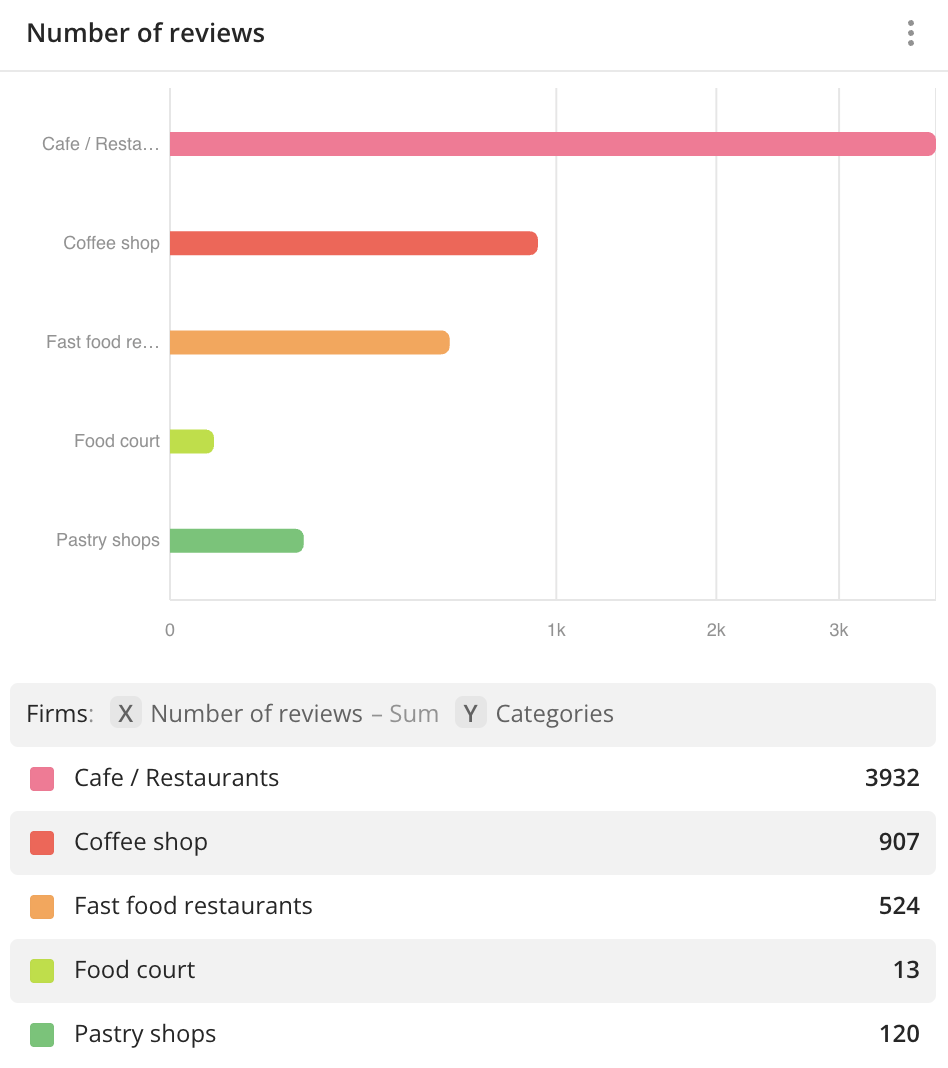 |
| Column chart | Suitable for comparing data in different groups. Data is grouped on the X-axis and displayed as vertical columns. | 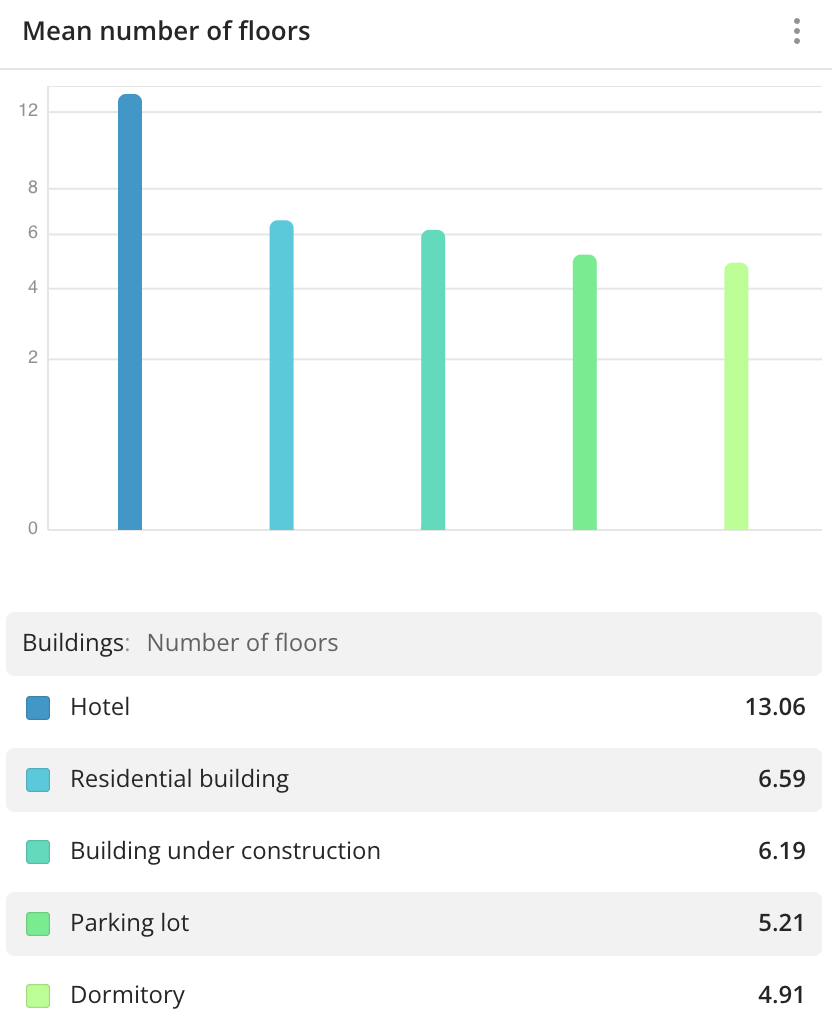 |
| Histogram | Suitable for distributing data by equal ranges (steps) as columns. | 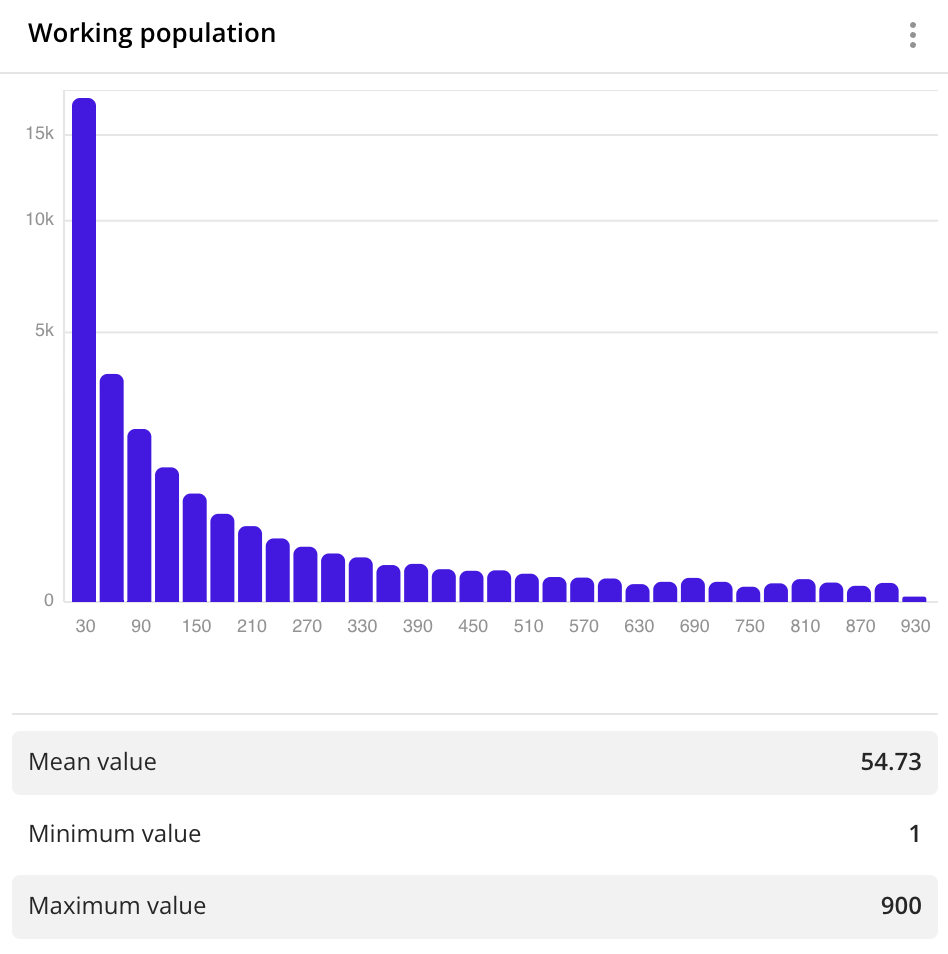 |
| Line graph | Suitable for viewing the changes in a value depending on a specific parameter. | 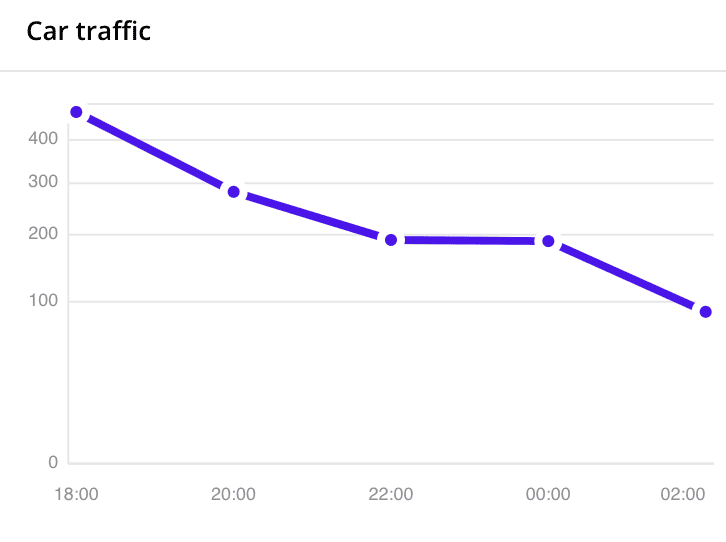 |
| Pie chart | Suitable for showing the ratio between values. A slice shows a value fraction of the whole. | 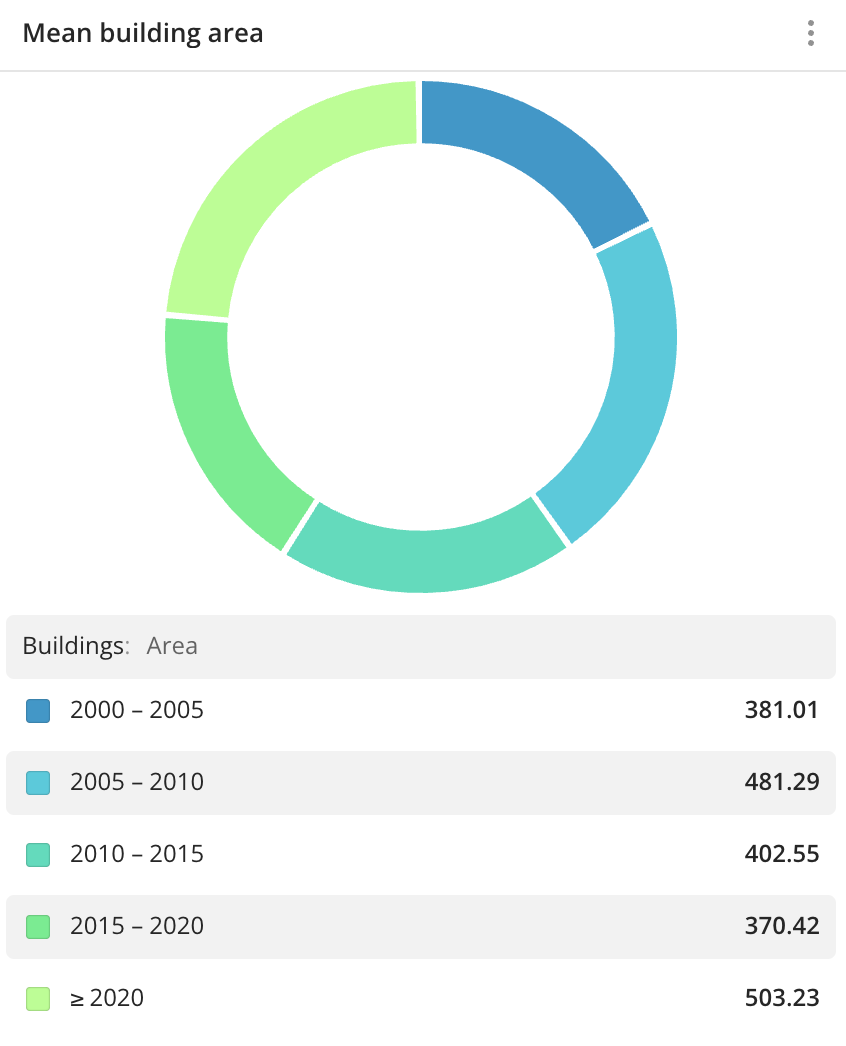 |
| Area chart | Similar to a line graph but with a filled area under the points and a smooth line. | 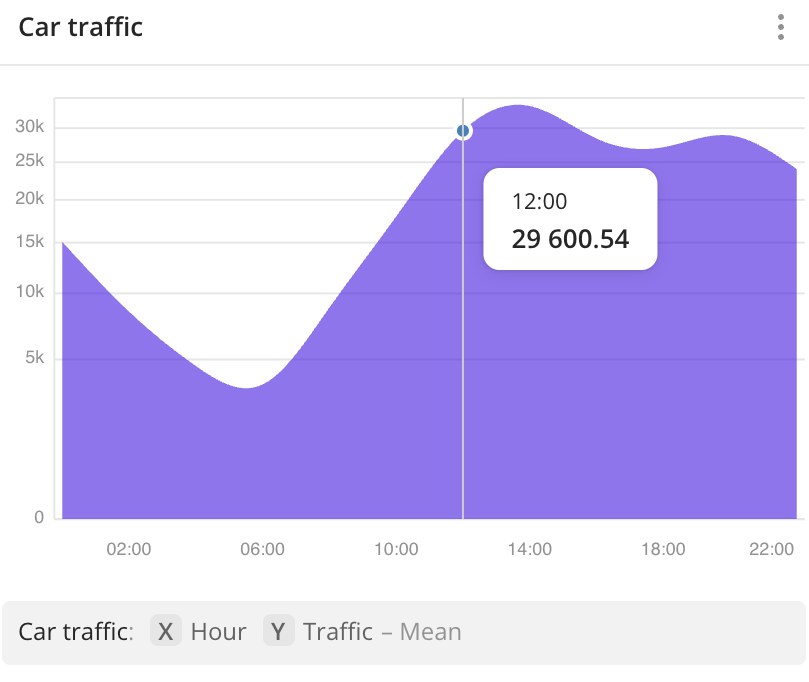 |
| Custom widget | Allows you to embed frames into the widget via URL or source code. | 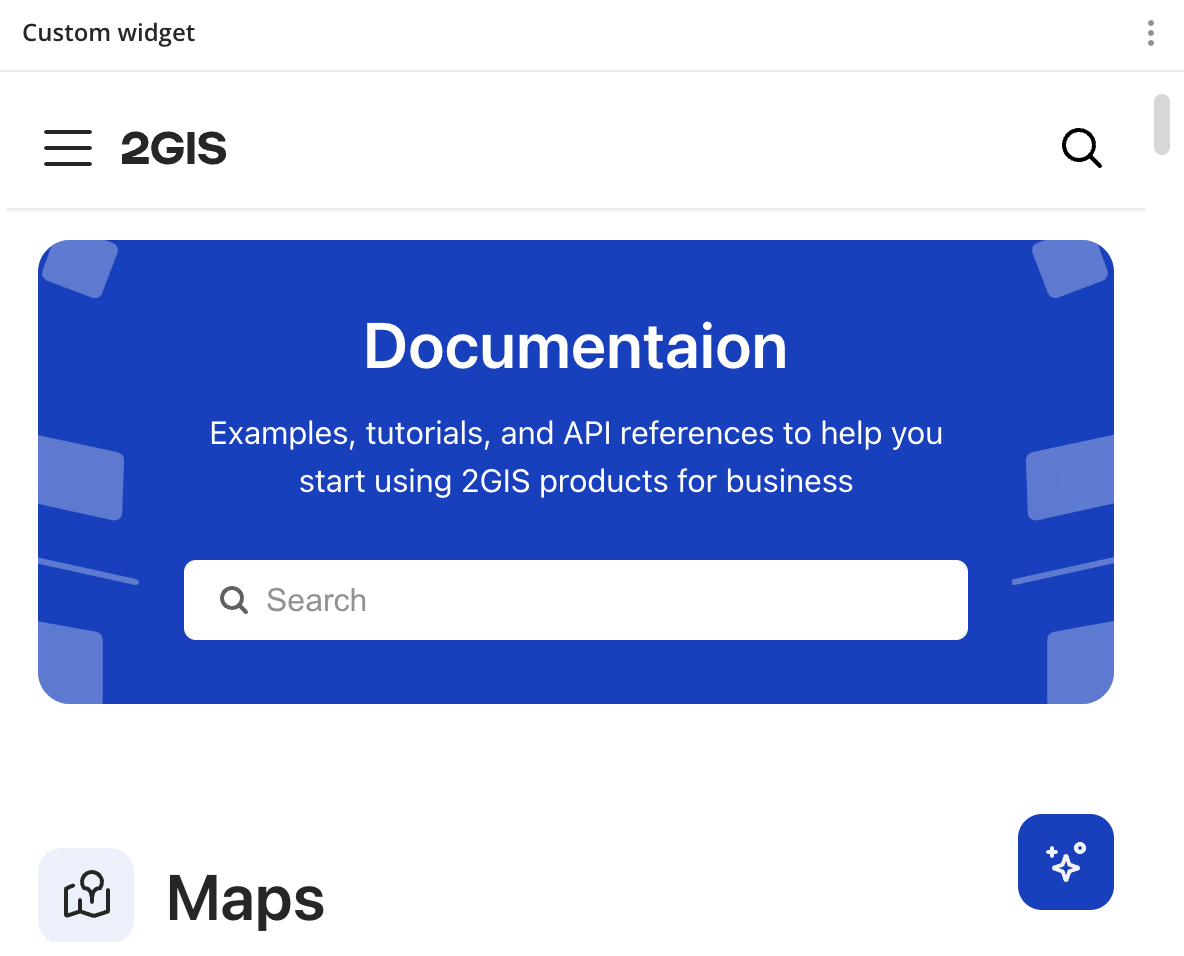 |
| Comparison | Suitable for comparing data in different groups in a table format. | 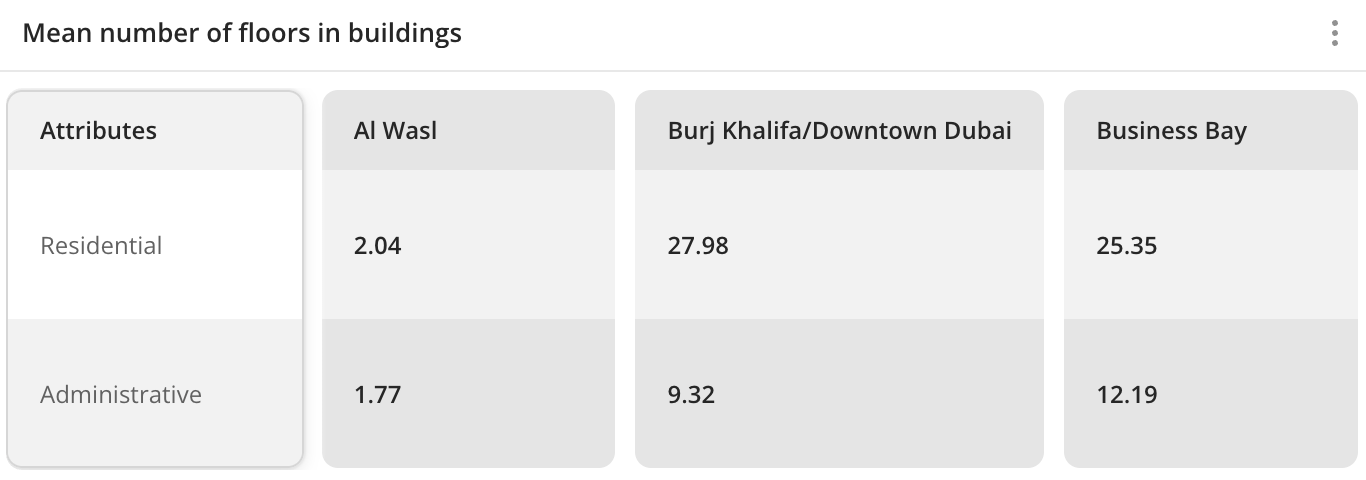 |
| Statistics | Suitable for viewing brief statistics on aggregated data. | 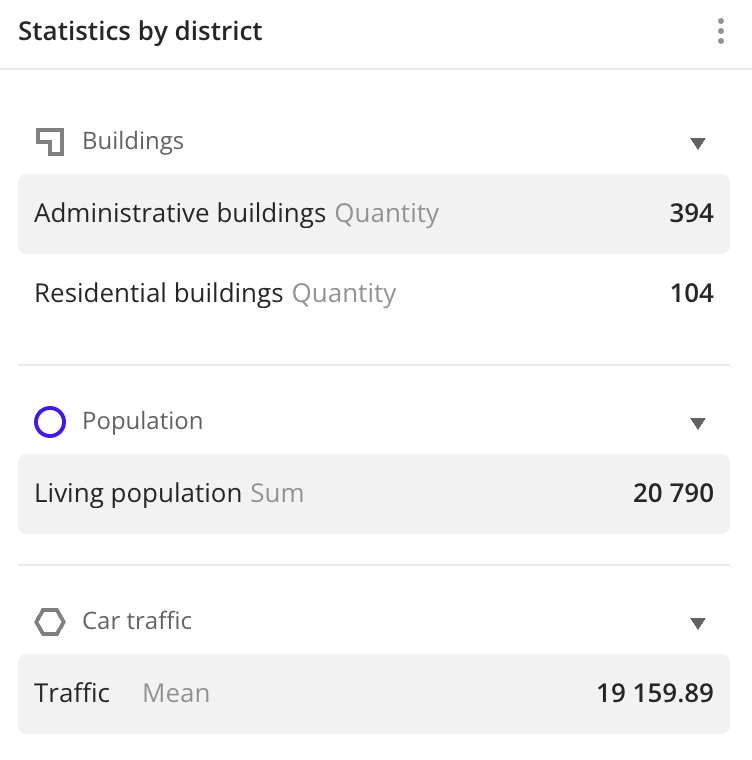 |
| Text widget | Suitable for adding a text description to a scene. You can format the text in the widget. | 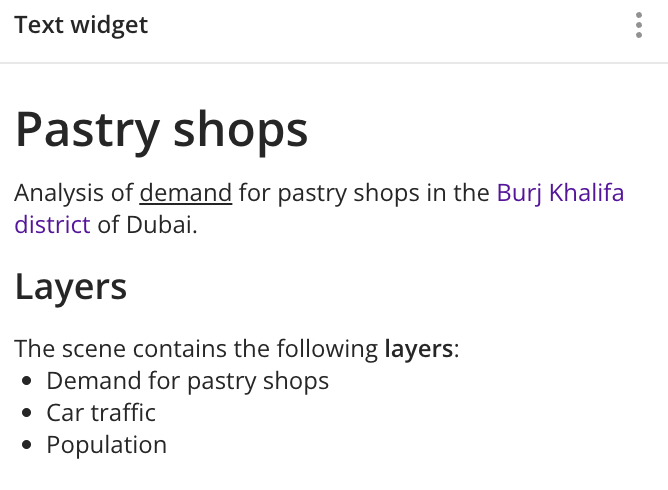 |
| KPI | Suitable for quickly viewing a key value from a sample and comparing the current value with the target. | 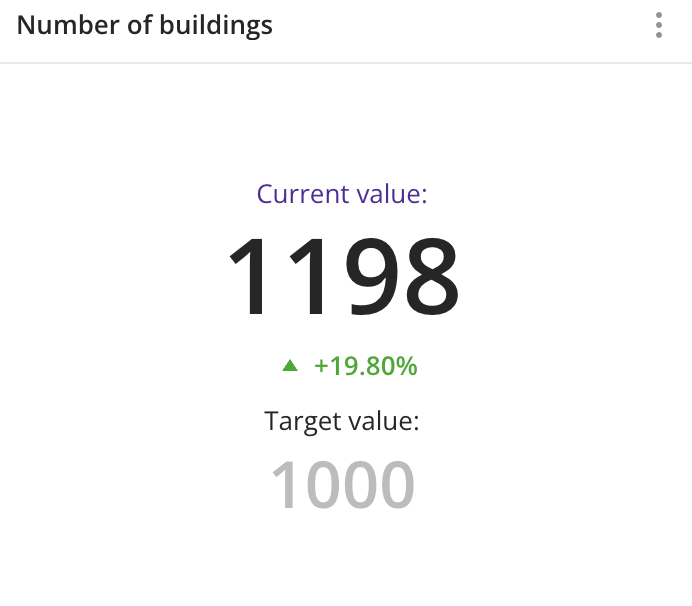 |
System widgets
| Widget | Description | Example |
|---|---|---|
| Legend | Shows information about all scene layers. | 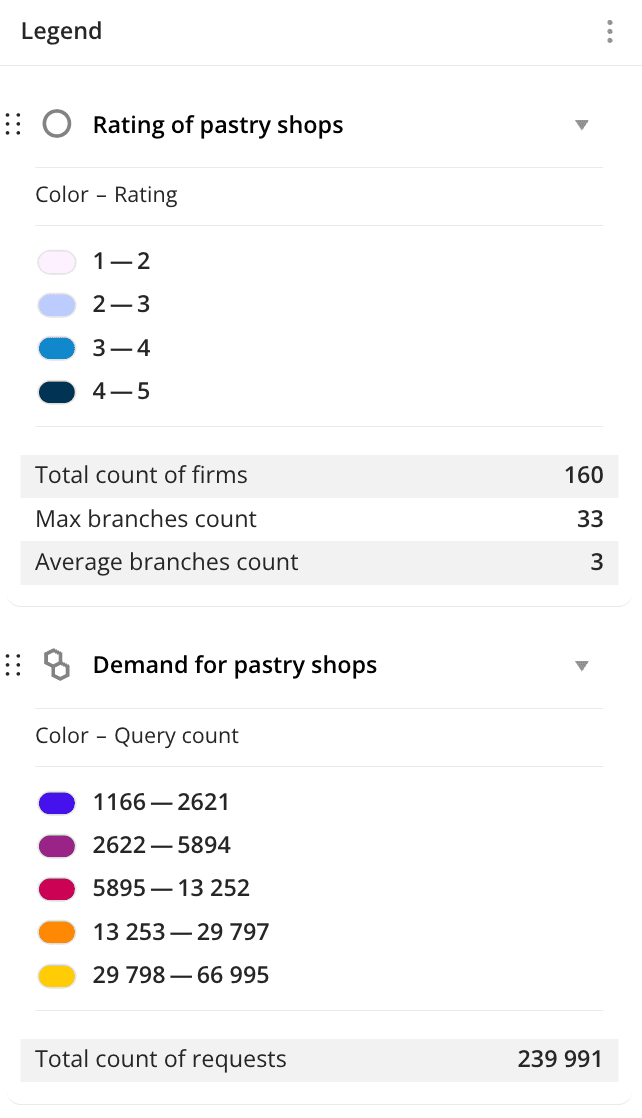 |
| Timeline | Used for filtering data on the scene by the Date attribute and viewing an animation of data changes. | 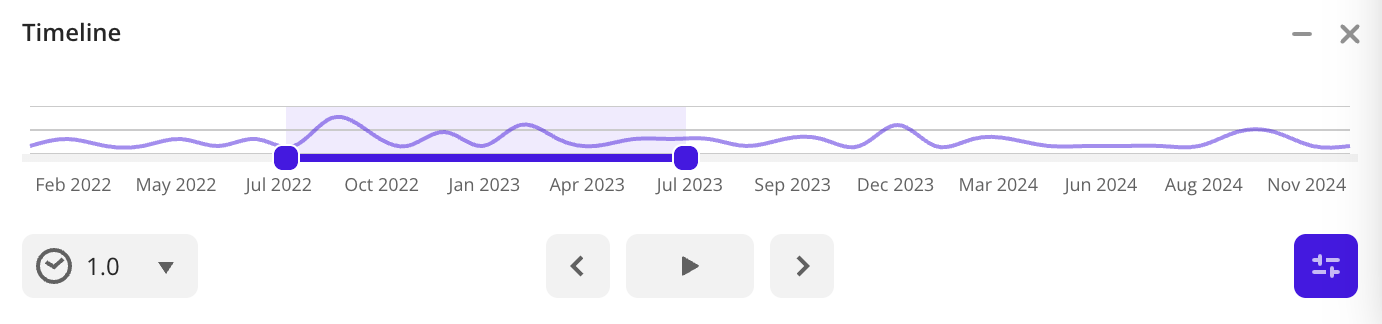 |
| Slice Filter | Used for filtering data on the scene without editing the original sample. | 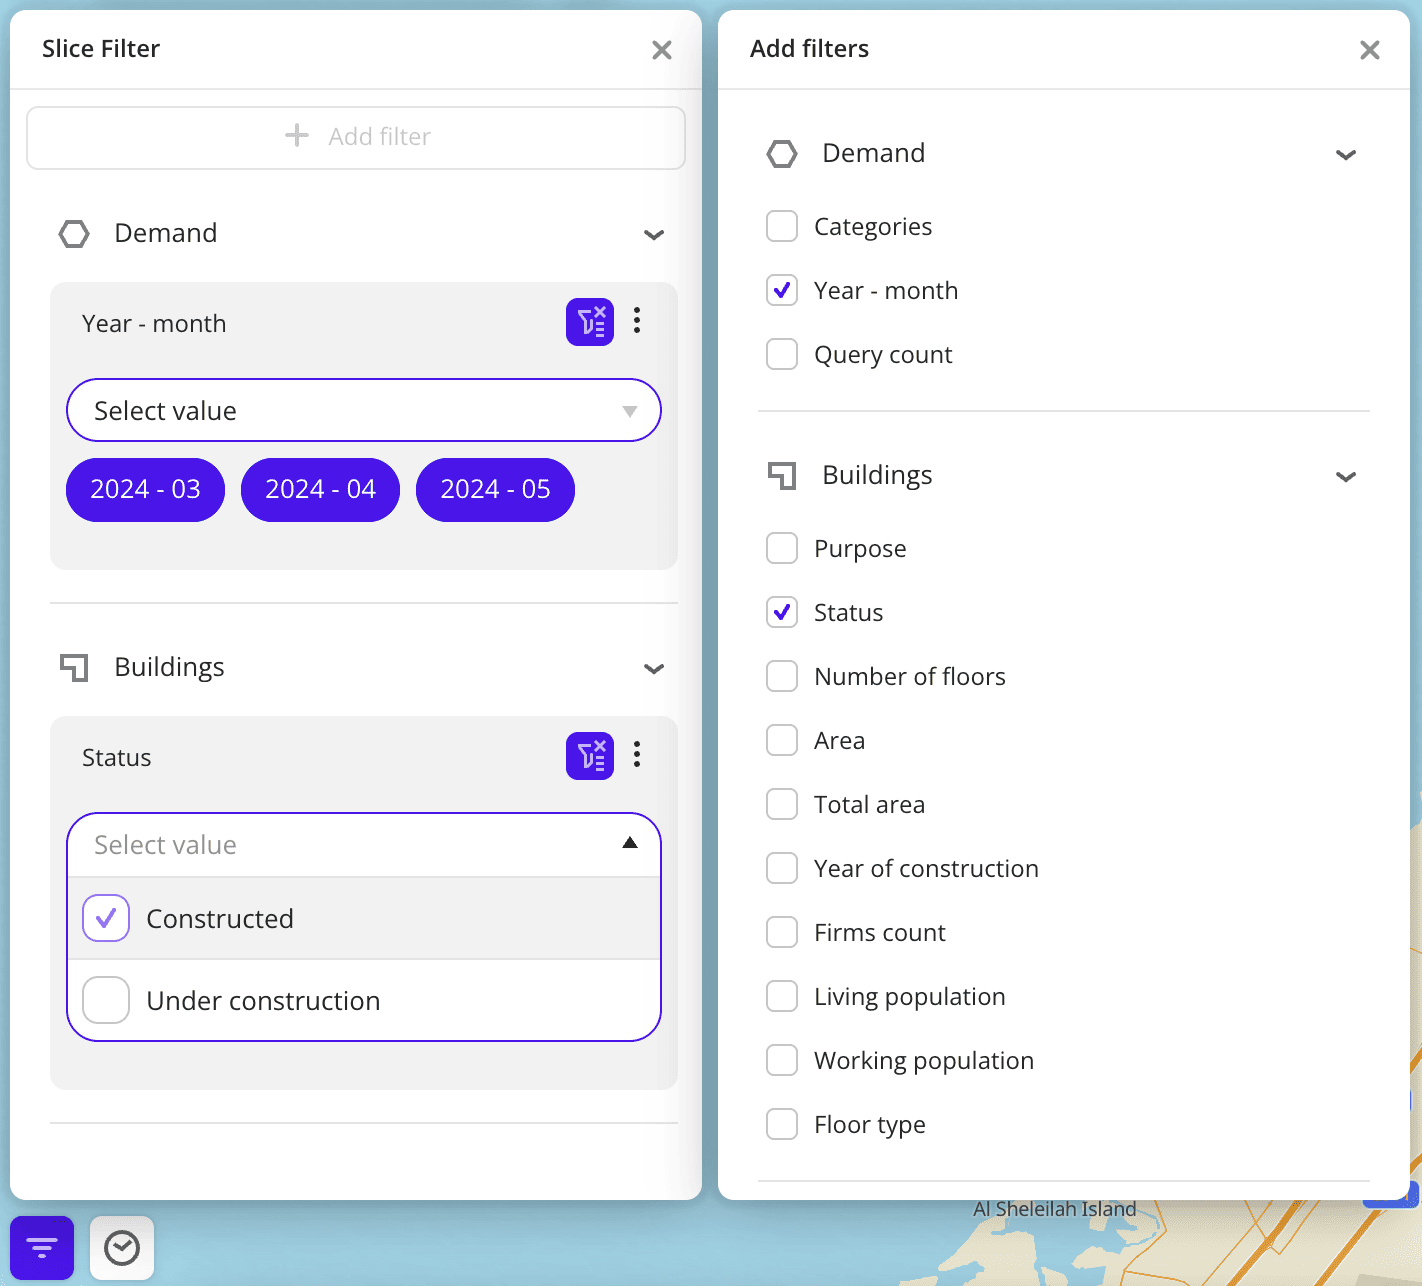 |
What's next?
- See how to Create a widget.
- Getting started.
- Get to know how to work with Data and Data visualization.
- Learn more about Layers, Dashboards, and Scenes.
- Learn about ready-made Analytics scenarios.