Filtering data on a scene
By default, a dashboard scene displays all data from the samples that the layers in the scene are based on. You can apply additional filtering while working with the scene to temporarily hide part of the data without changing the original sample. You can filter data:
-
by territories: via geofilters
-
by data attributes:
- via widgets by clicking chart components
- via slices by selecting multiple filters for different layers
-
by date and time: via the Timeline widget
When you filter data on a scene, samples in layers remain unchanged. Only the number of objects on the scene updates: on the map, in the Legend widget, and in other widgets (except the text widget). To change a data sample, see the Modifying data sample instruction.
Filtering via geofilters
To remain data only for specific territories on the dashboard scene, apply geofilters:
-
Go to the Dashboards tab and open the dashboard.
-
Open a scene using the arrows
 and
and  . If there is only one scene in the dashboard, it opens automatically.
 -
Select territories using one of the methods:
-
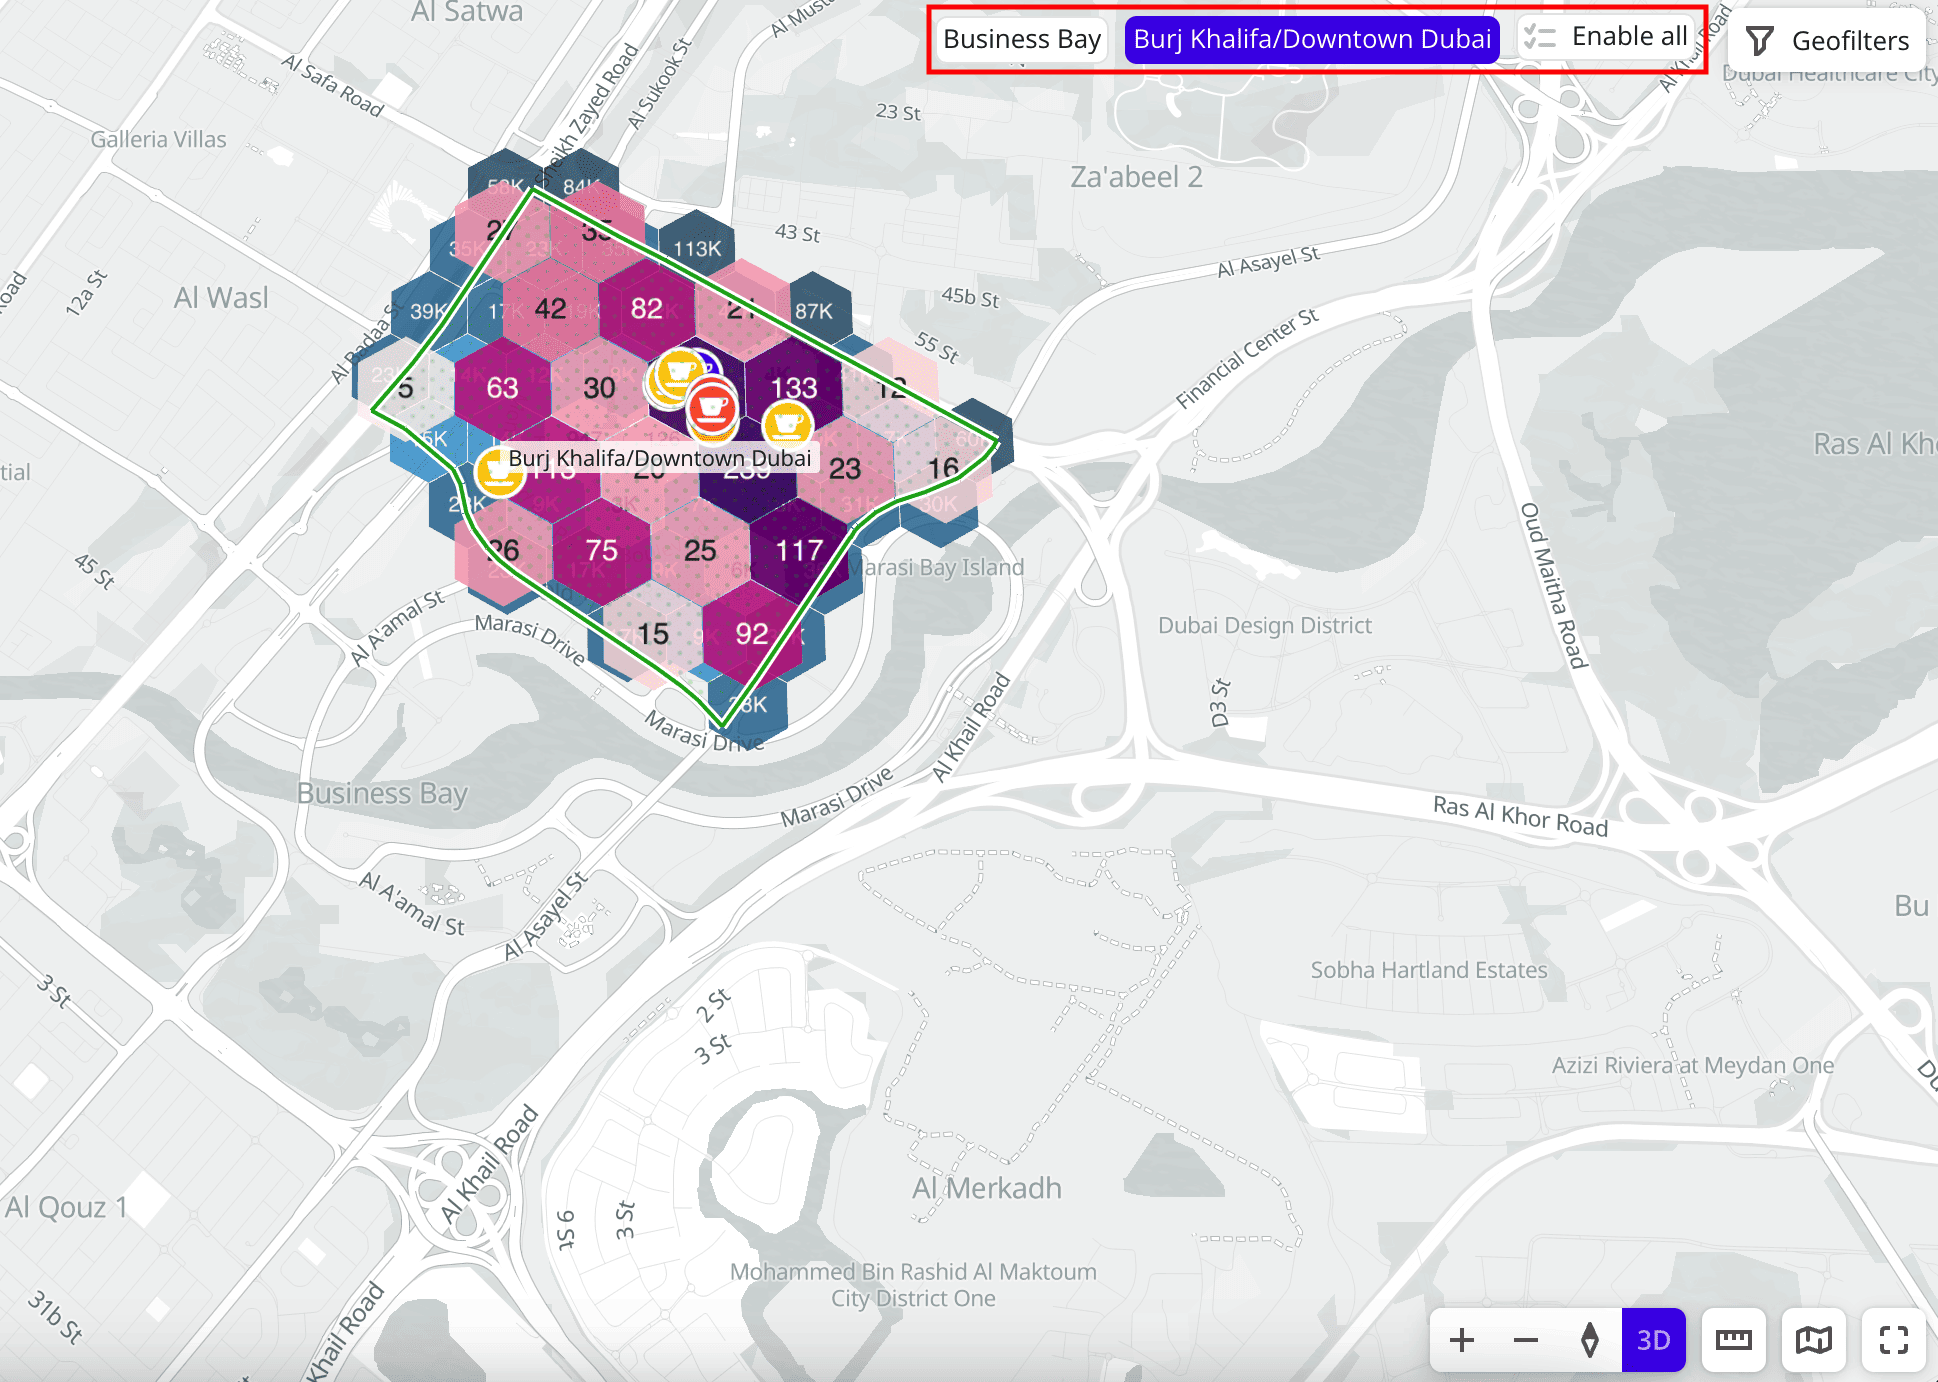
In the upper-right corner of the scene, click the names of territories which data you need to hide:
-
Click Geofilters and specify territories in the Geofilter settings dialog. To hide a filter by territory, click
 icon next to the geofilter name. To delete a geofilter, click
  icon next to its name. To delete all geofilters, click Clear filters:
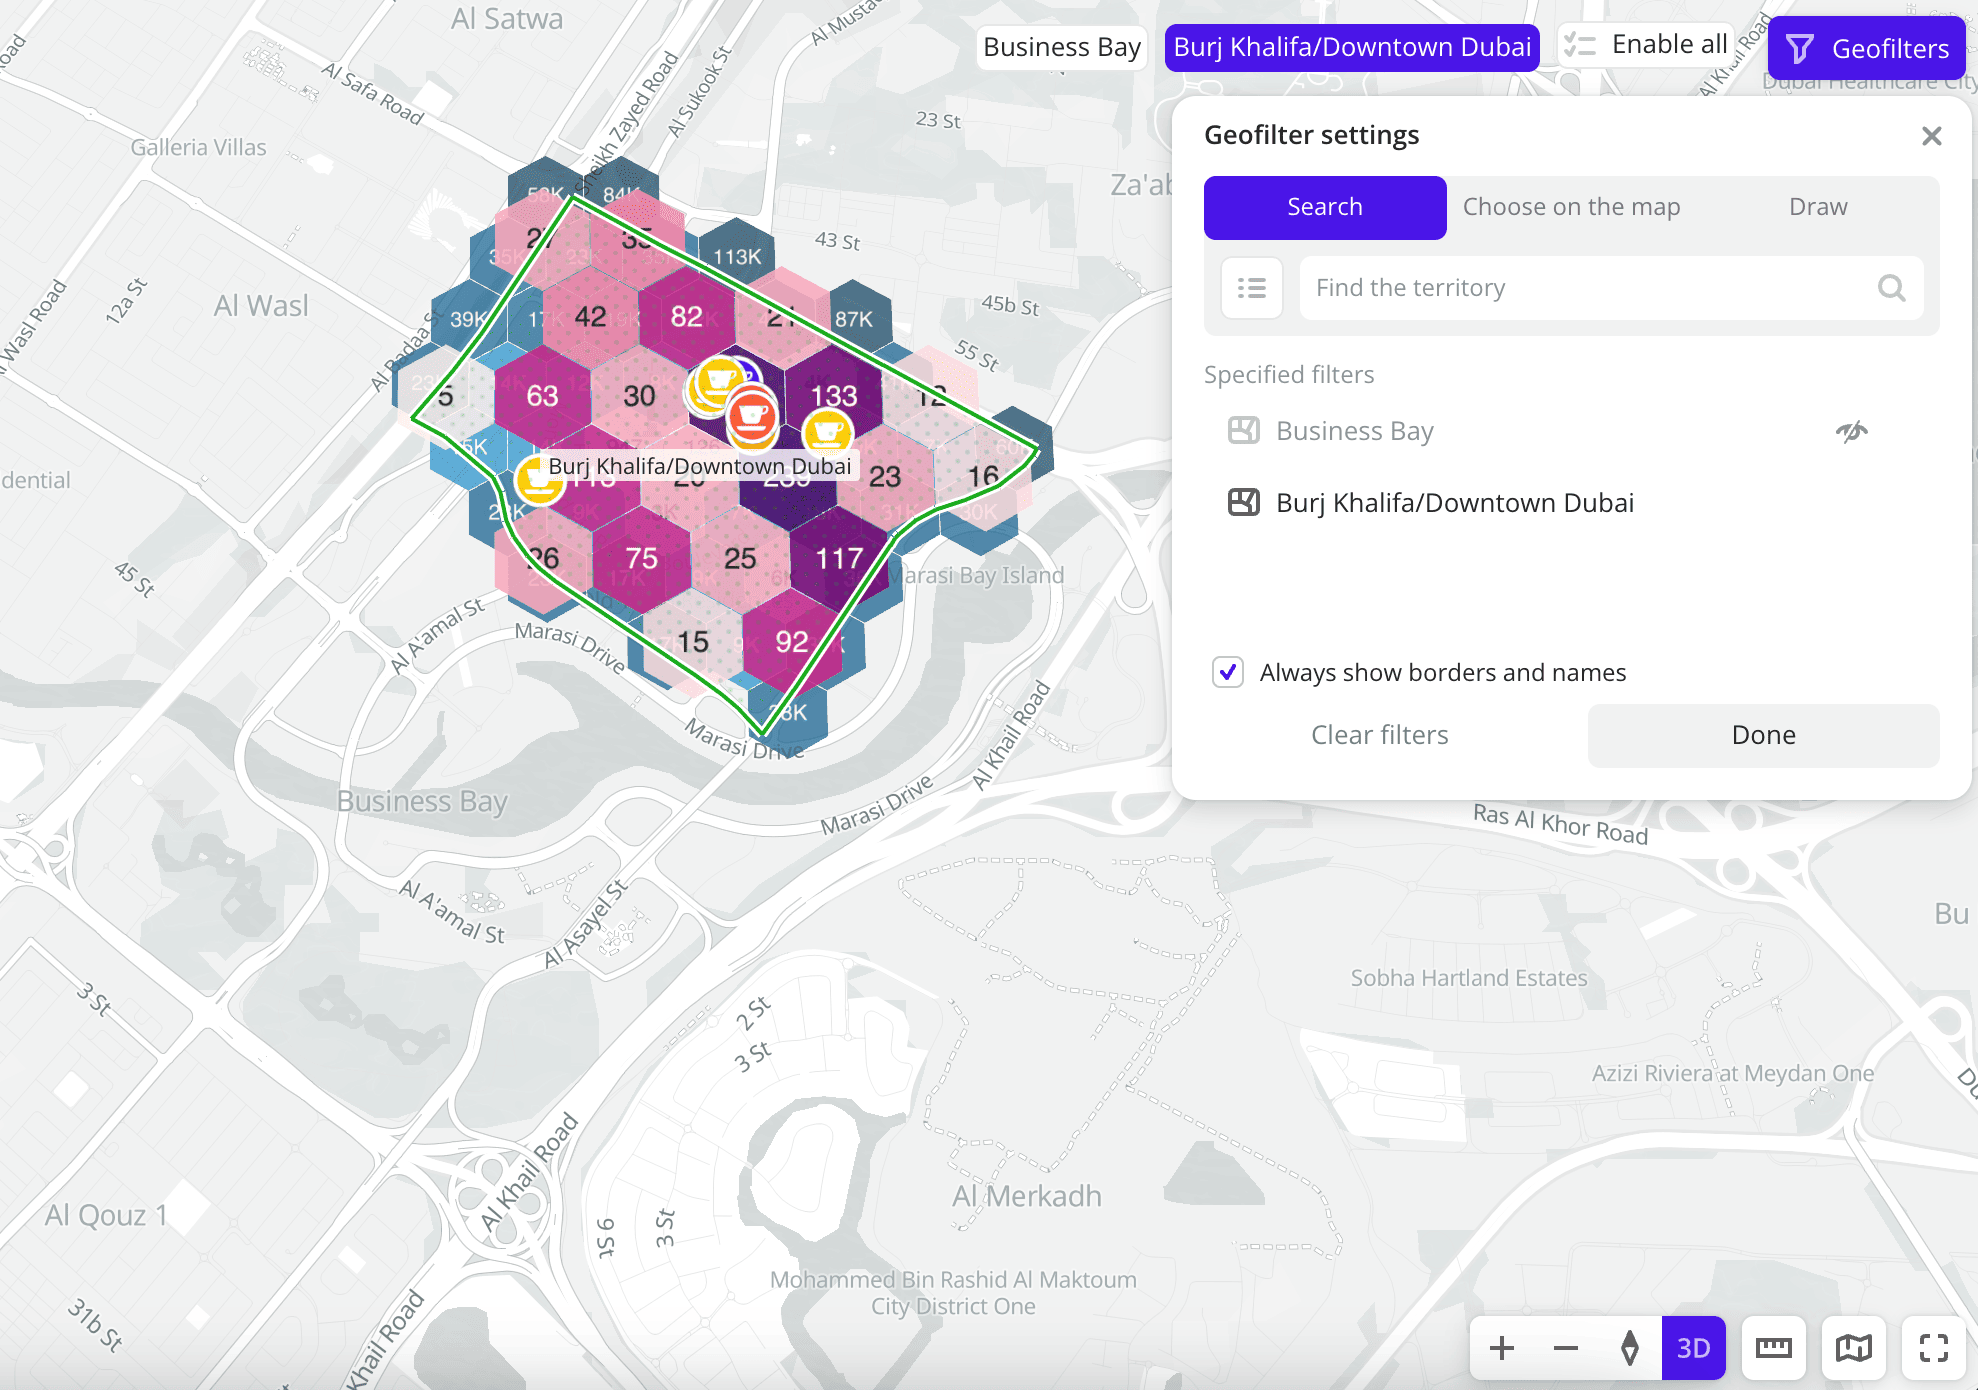
-
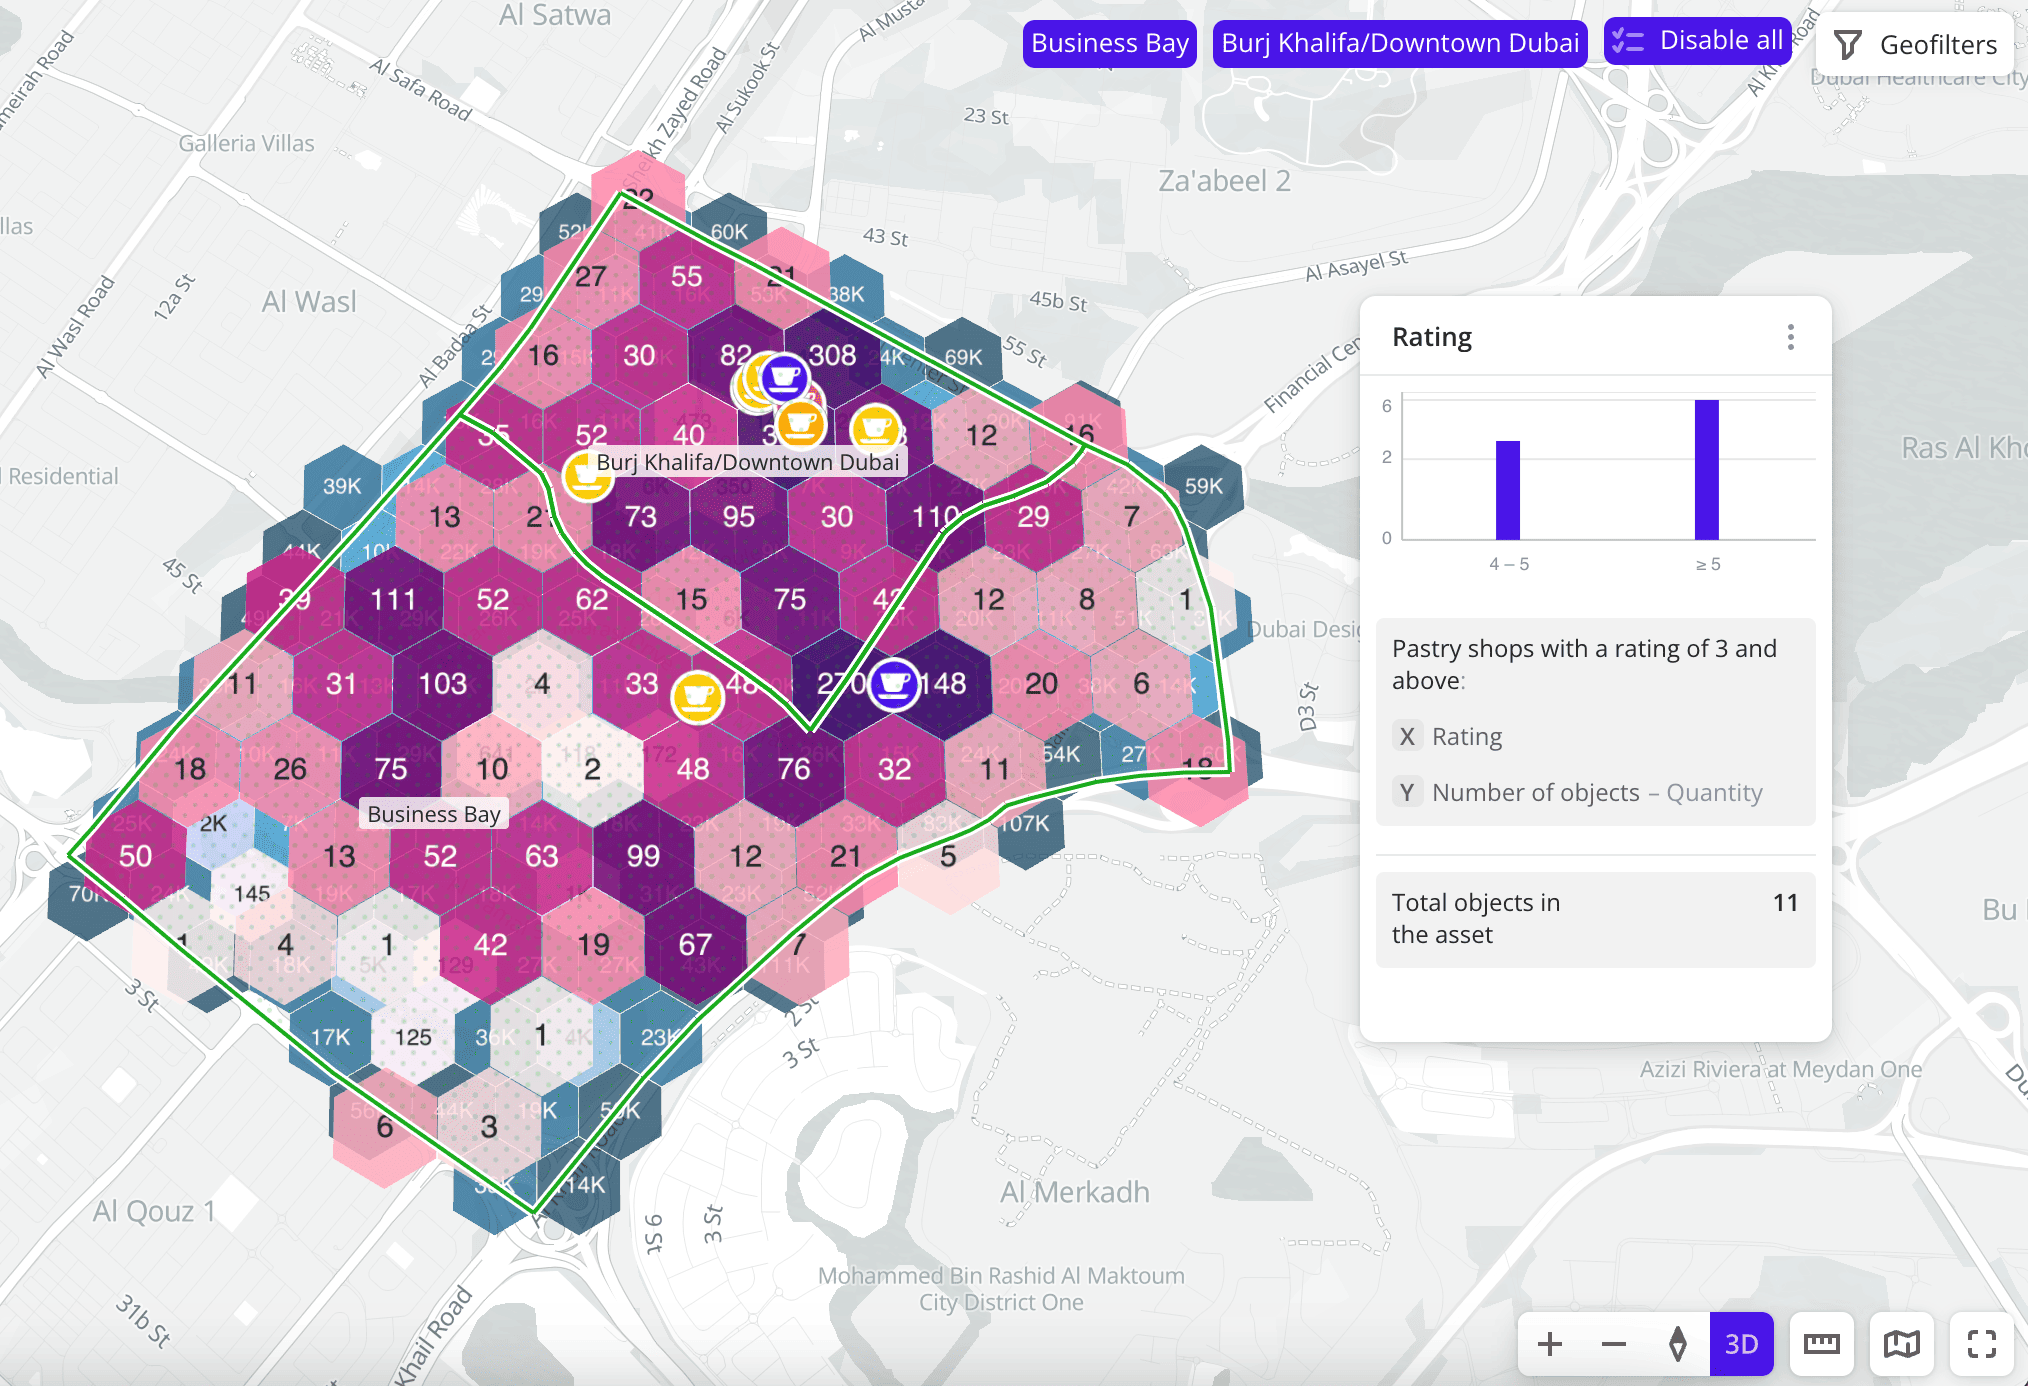
As a result, only data for the selected territories will remain on the scene:
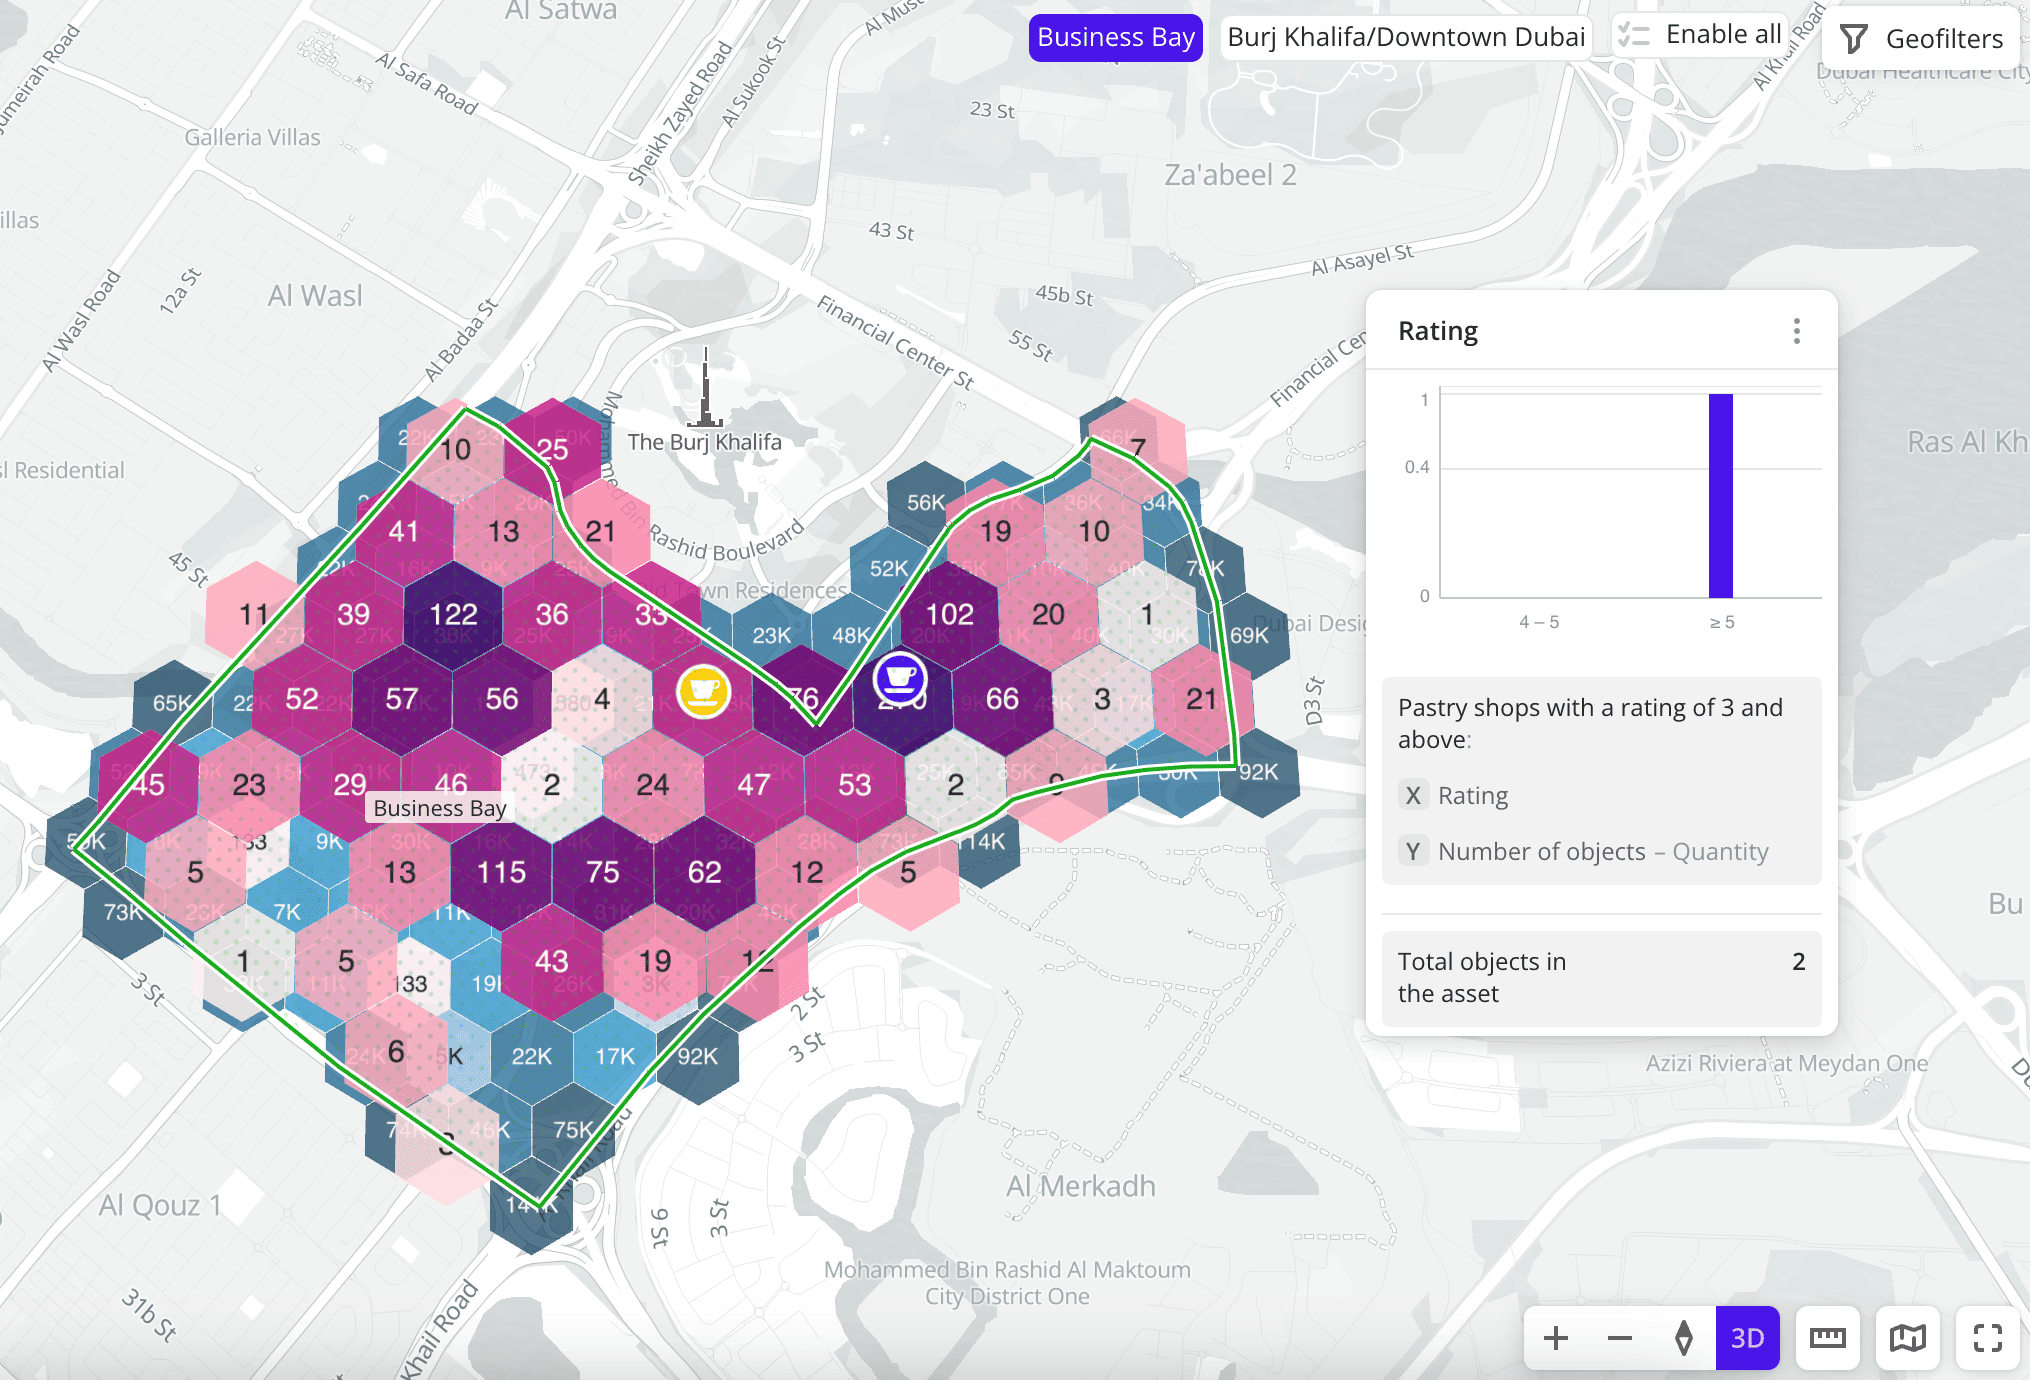
-
A scene example before applying a geofilter:
-
A scene example after applying a geofilter:
Filtering via widgets
To filter data by attribute values, click chart components (bars, columns, or sectors) or legend elements in widgets.
You can apply filtering in one layer or in multiple layers at once. You can also select multiple values and widgets simultaneously: for more details, see the Combining filter conditions section.
Filtering is available via the following widgets:
If you apply filtering via slices to a layer, filtering via widgets in that layer will be reset.
Filtering in one layer
When filtering data in one layer:
- Data is filtered only in that layer: on the map, in the
Legend, and in other widgets from that layer. - Other layers and widgets from other layers do not change.
- The widget with an applied filter shows
 icon.
icon. - In the layer list, the layer with an applied filter shows
 icon.
icon.
Filtering example
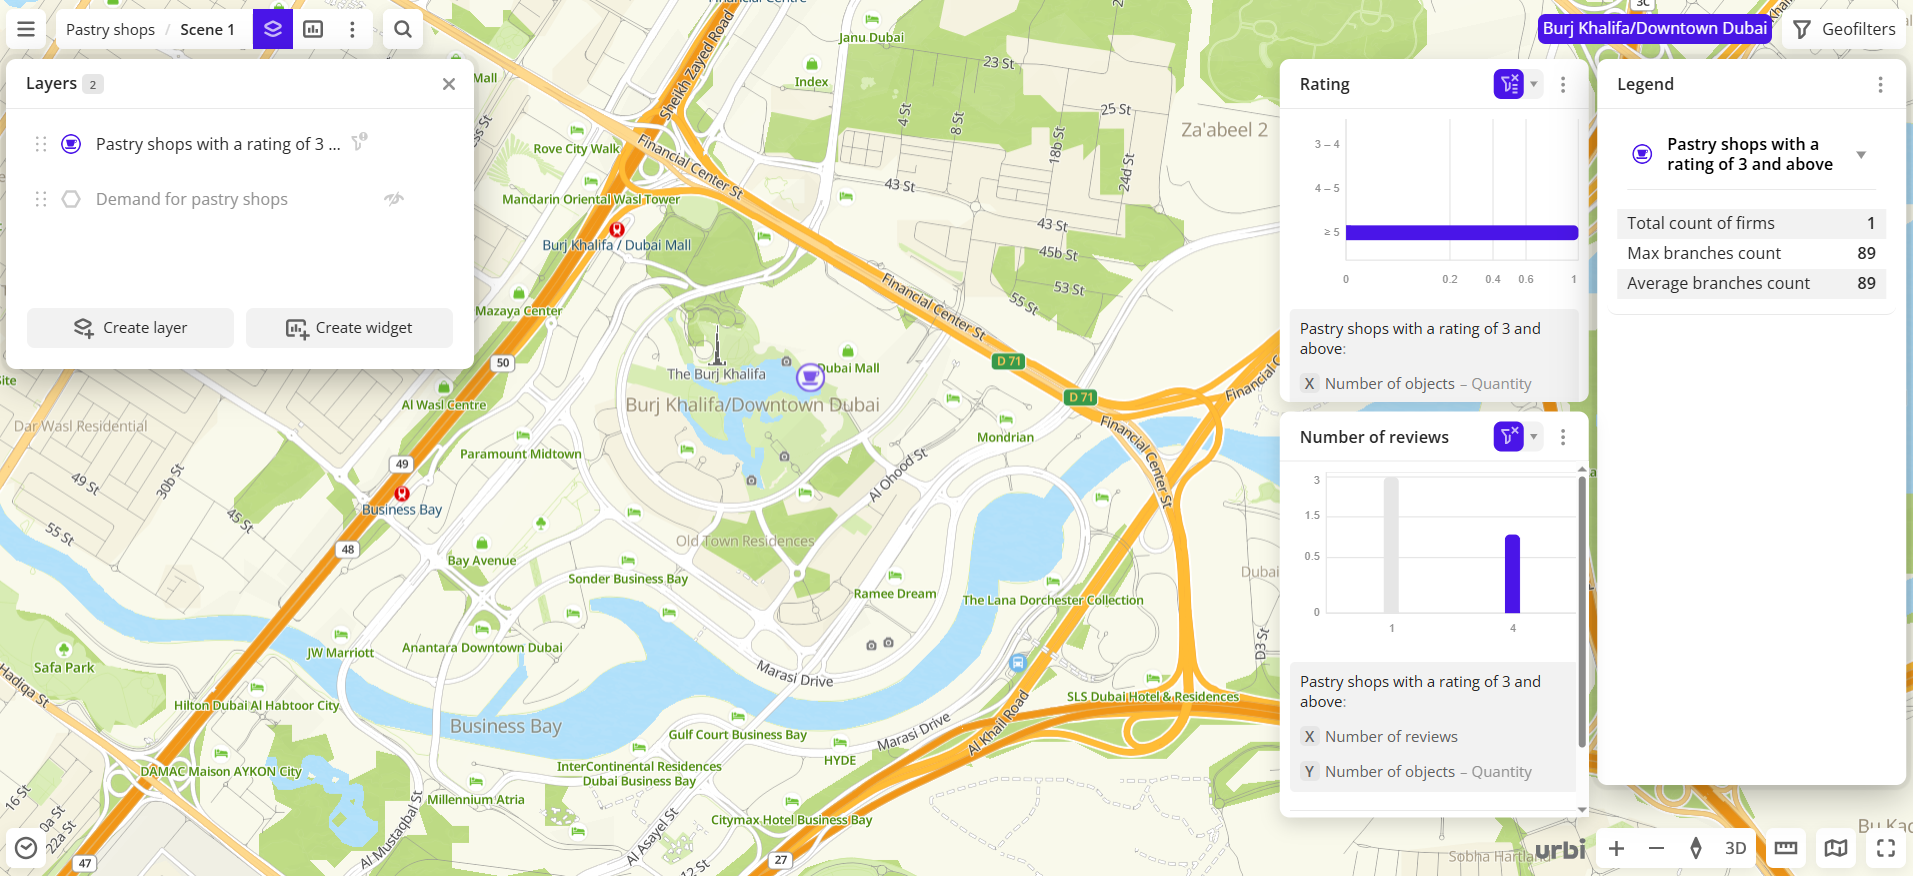
The scene shows all data of the Pastry shops layer:
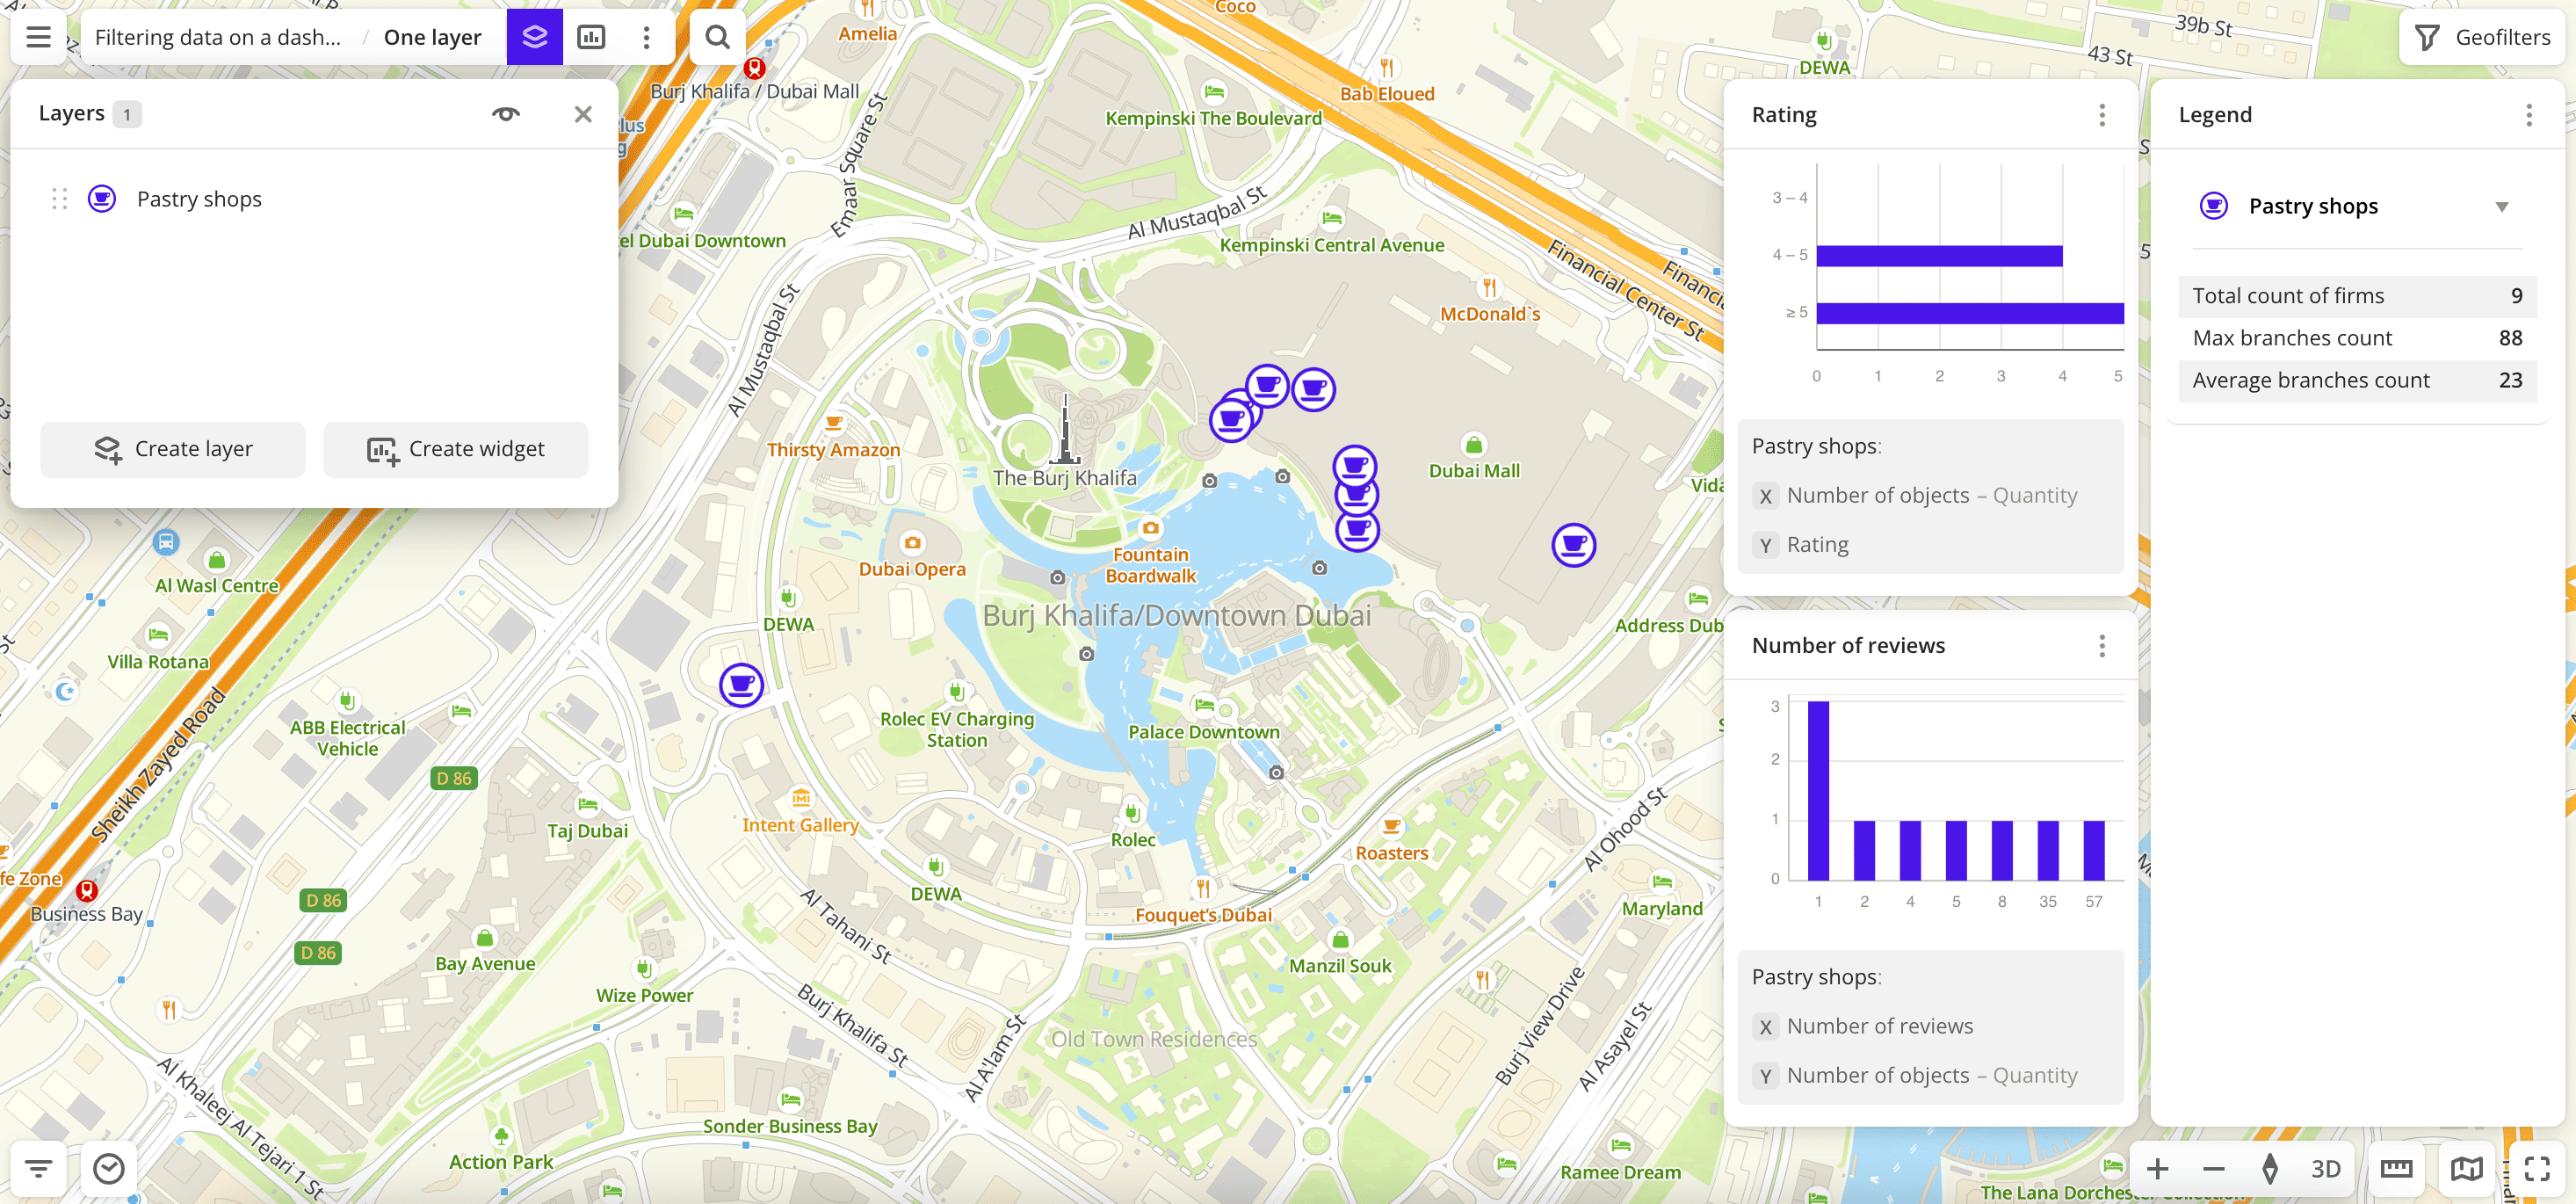
To remain only pastry shops with a rating from 4 to 5, in the Rating widget created from the Pastry shops layer, click the 4-5 rating range (bar on the chart).
As a result, data is filtered by the Rating attribute. Pastry shops only with a rating from 4 to 5 remain:
- on the map
- in the
RatingandNumber of reviewswidgets created from thePastry shopslayer - in the
Legendwidget
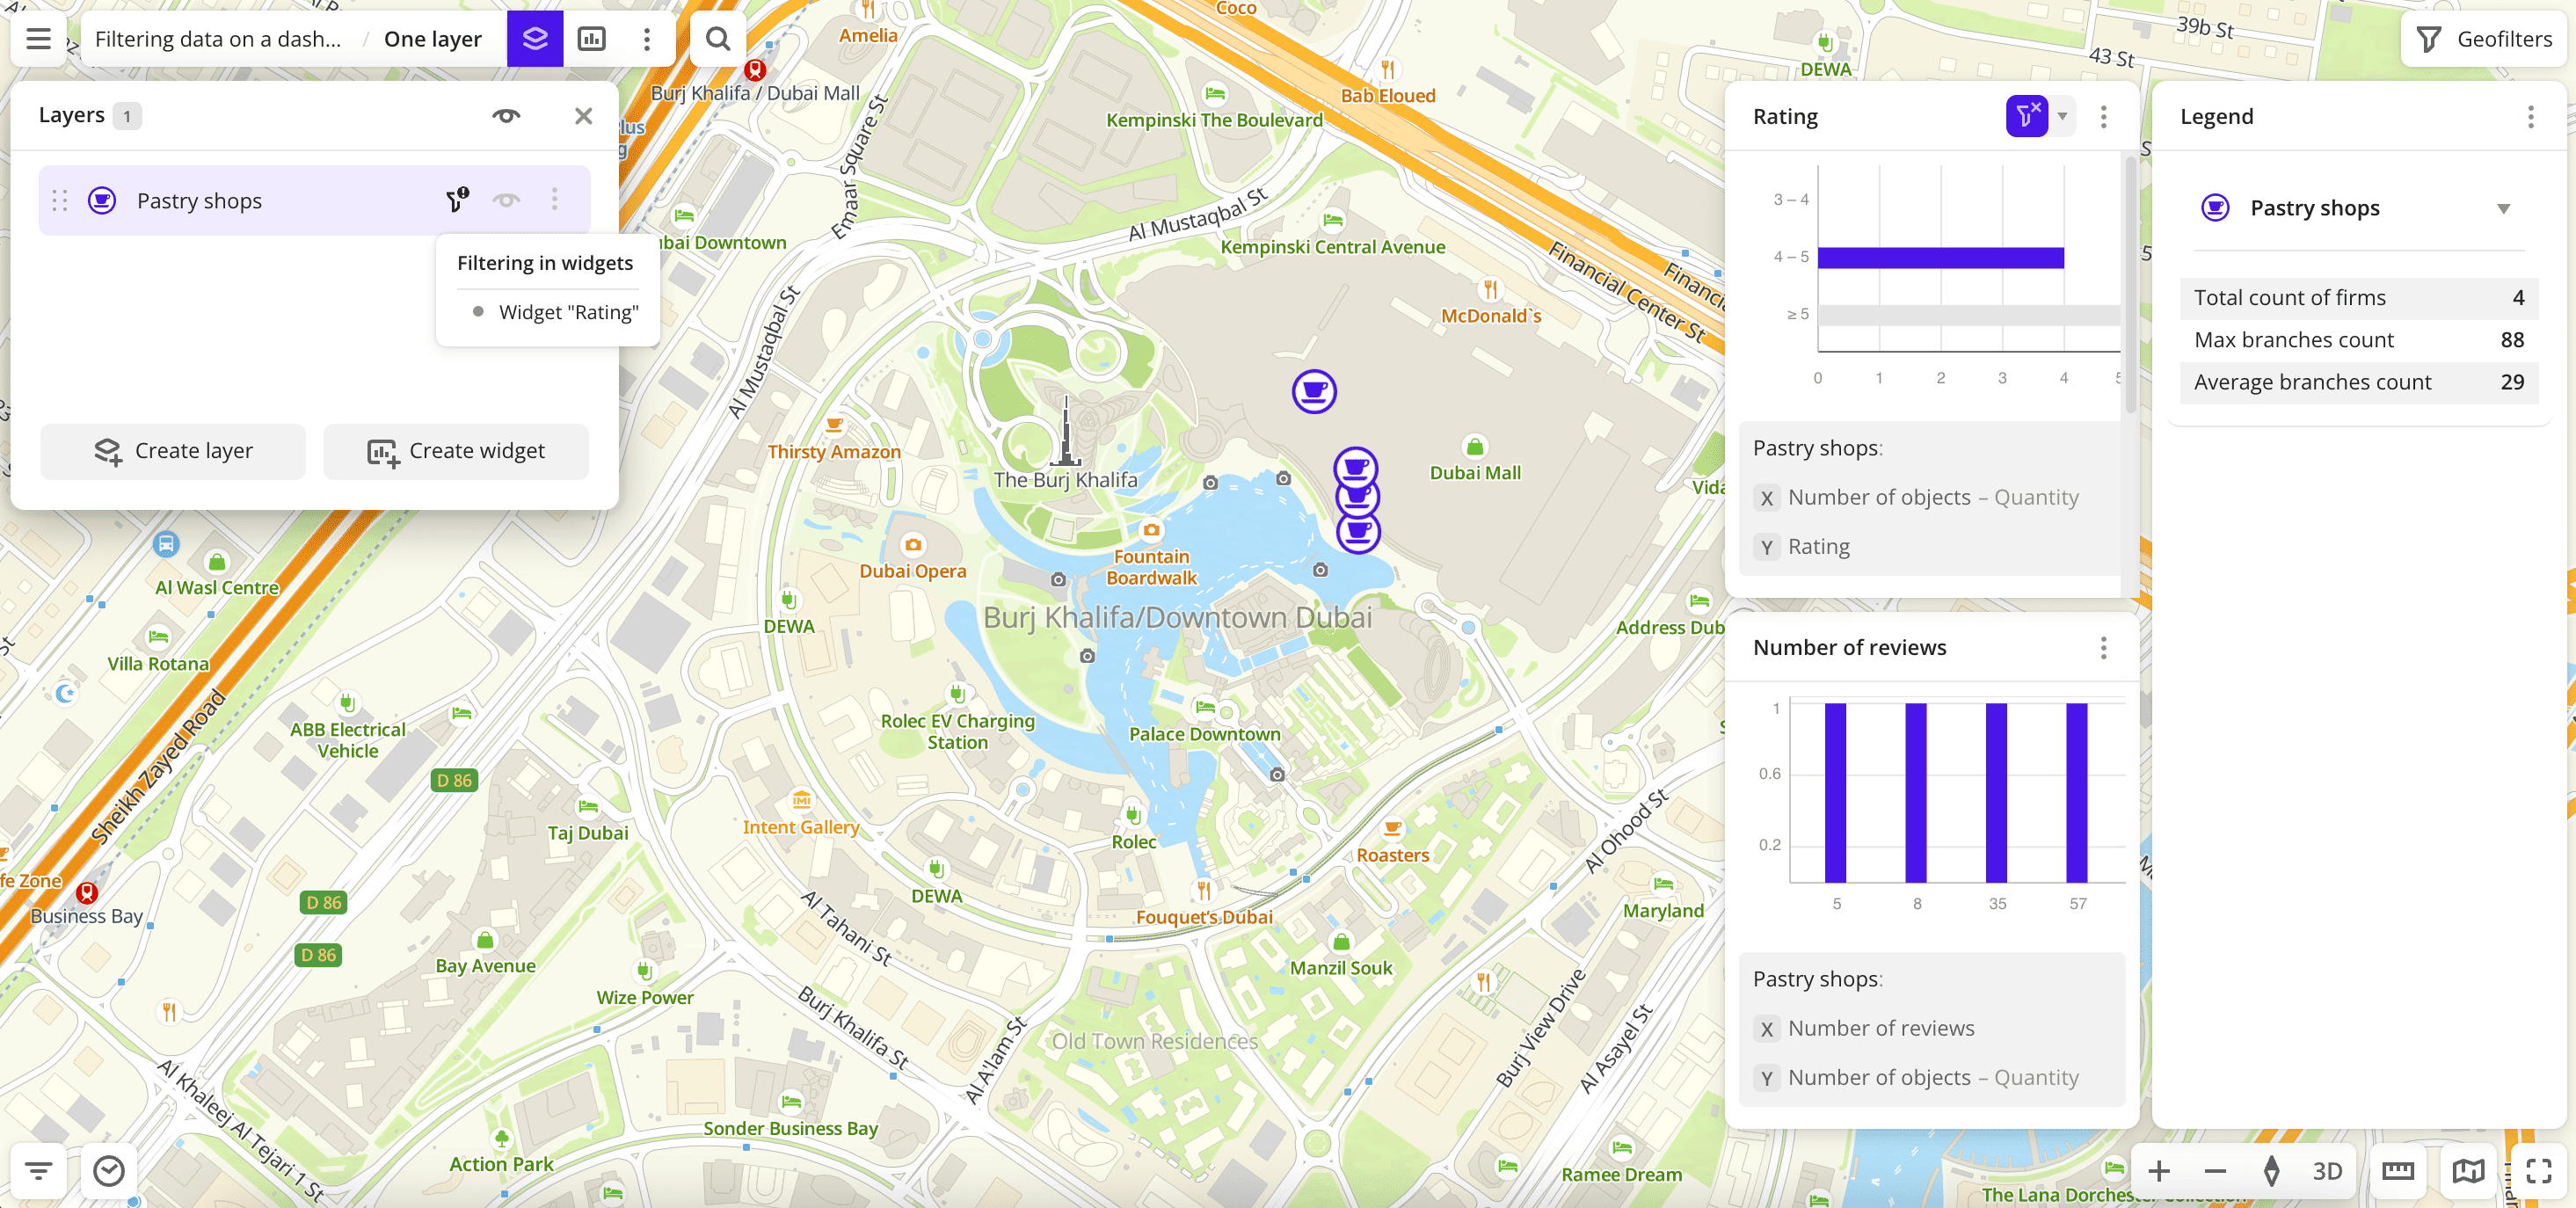
To delete the filter, click ![]() icon in the widget or click the selected chart component.
icon in the widget or click the selected chart component.
Filtering in multiple layers
You can apply a filter to multiple layers on the dashboard scene at once. The filter applies:
- To layers created from the same dataset.
- To layers created from other datasets if those datasets contain the selected global attribute. For example, built-in datasets Dynamics of organizations, Demand, and Firms contain the global attribute
Category.
From the same dataset
When filtering data in multiple layers from the same dataset:
- Data is filtered only in layers from that dataset: on the map, in the
Legend, and in other widgets from those layers. - Layers created from other datasets and widgets from these layers do not change (unless a global attribute is selected).
- The widget with an applied filter shows
 icon.
icon. - In the layer list, layers with an applied filter show icon.
Filtering example
The scene shows all data of two layers Hotels and Pastry shops from the Firms dataset:
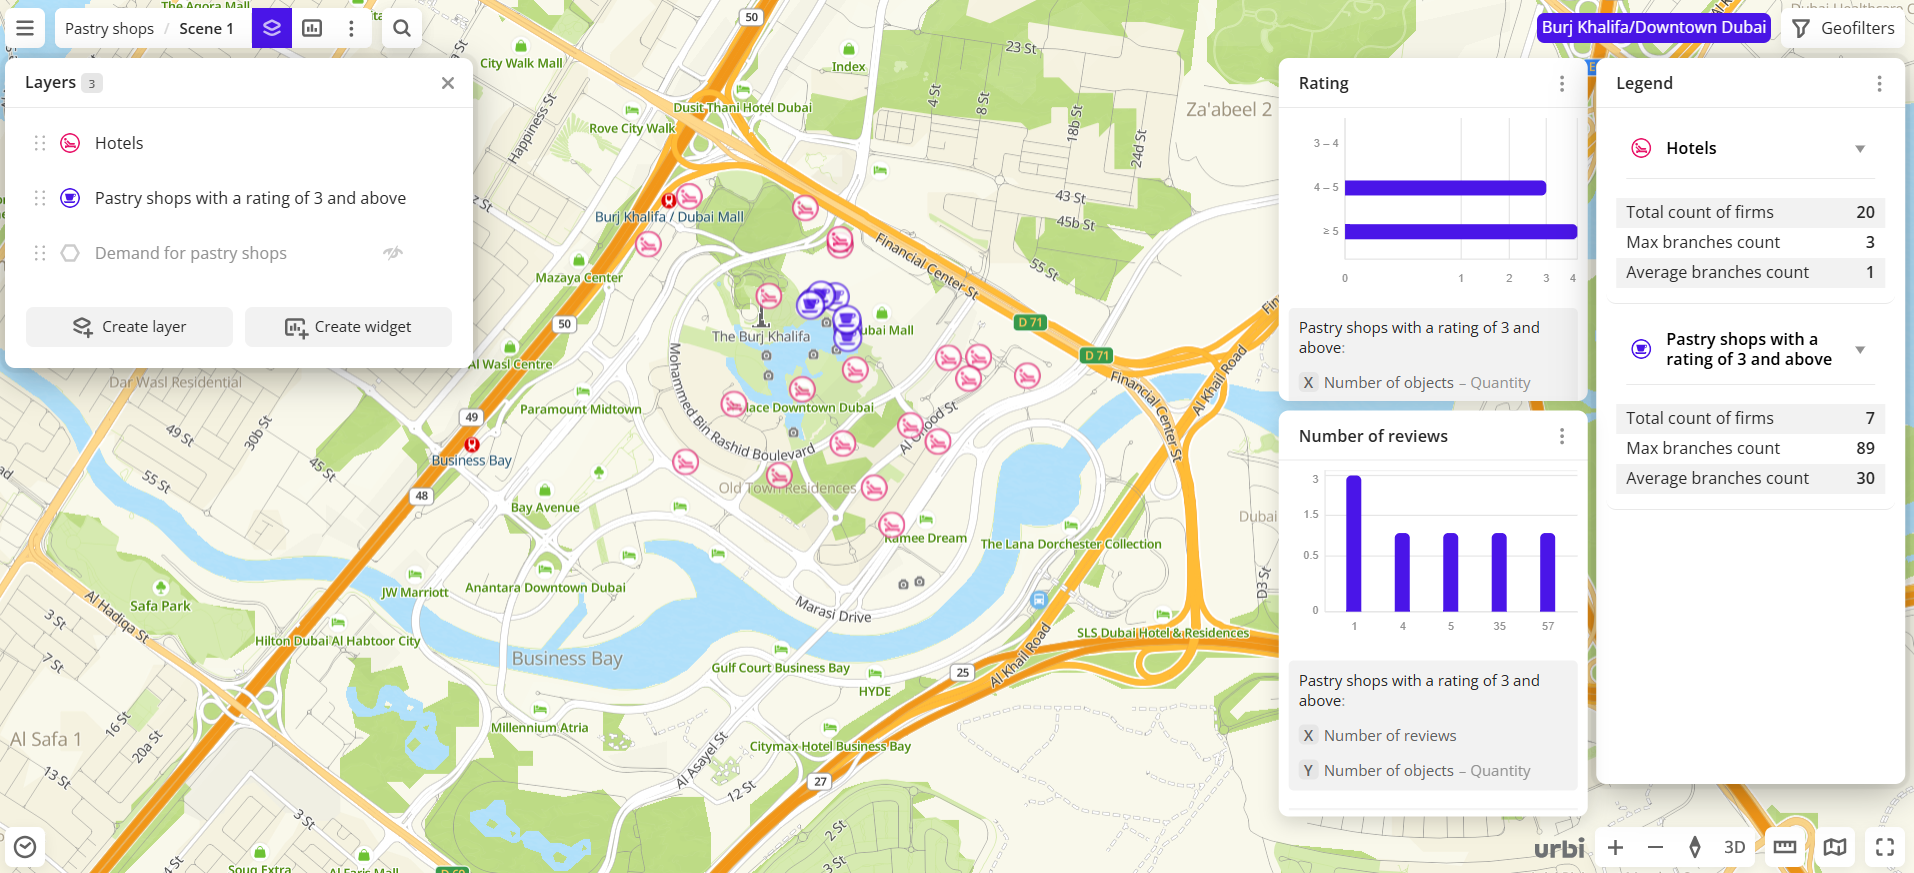
To remain only pastry shops and hotels with a rating from 4 to 5:
-
In the
Rating of pastry shopswidget created from thePastry shopslayer, click the 4-5 rating range (bar on the chart). By default, the filter applies only to this layer: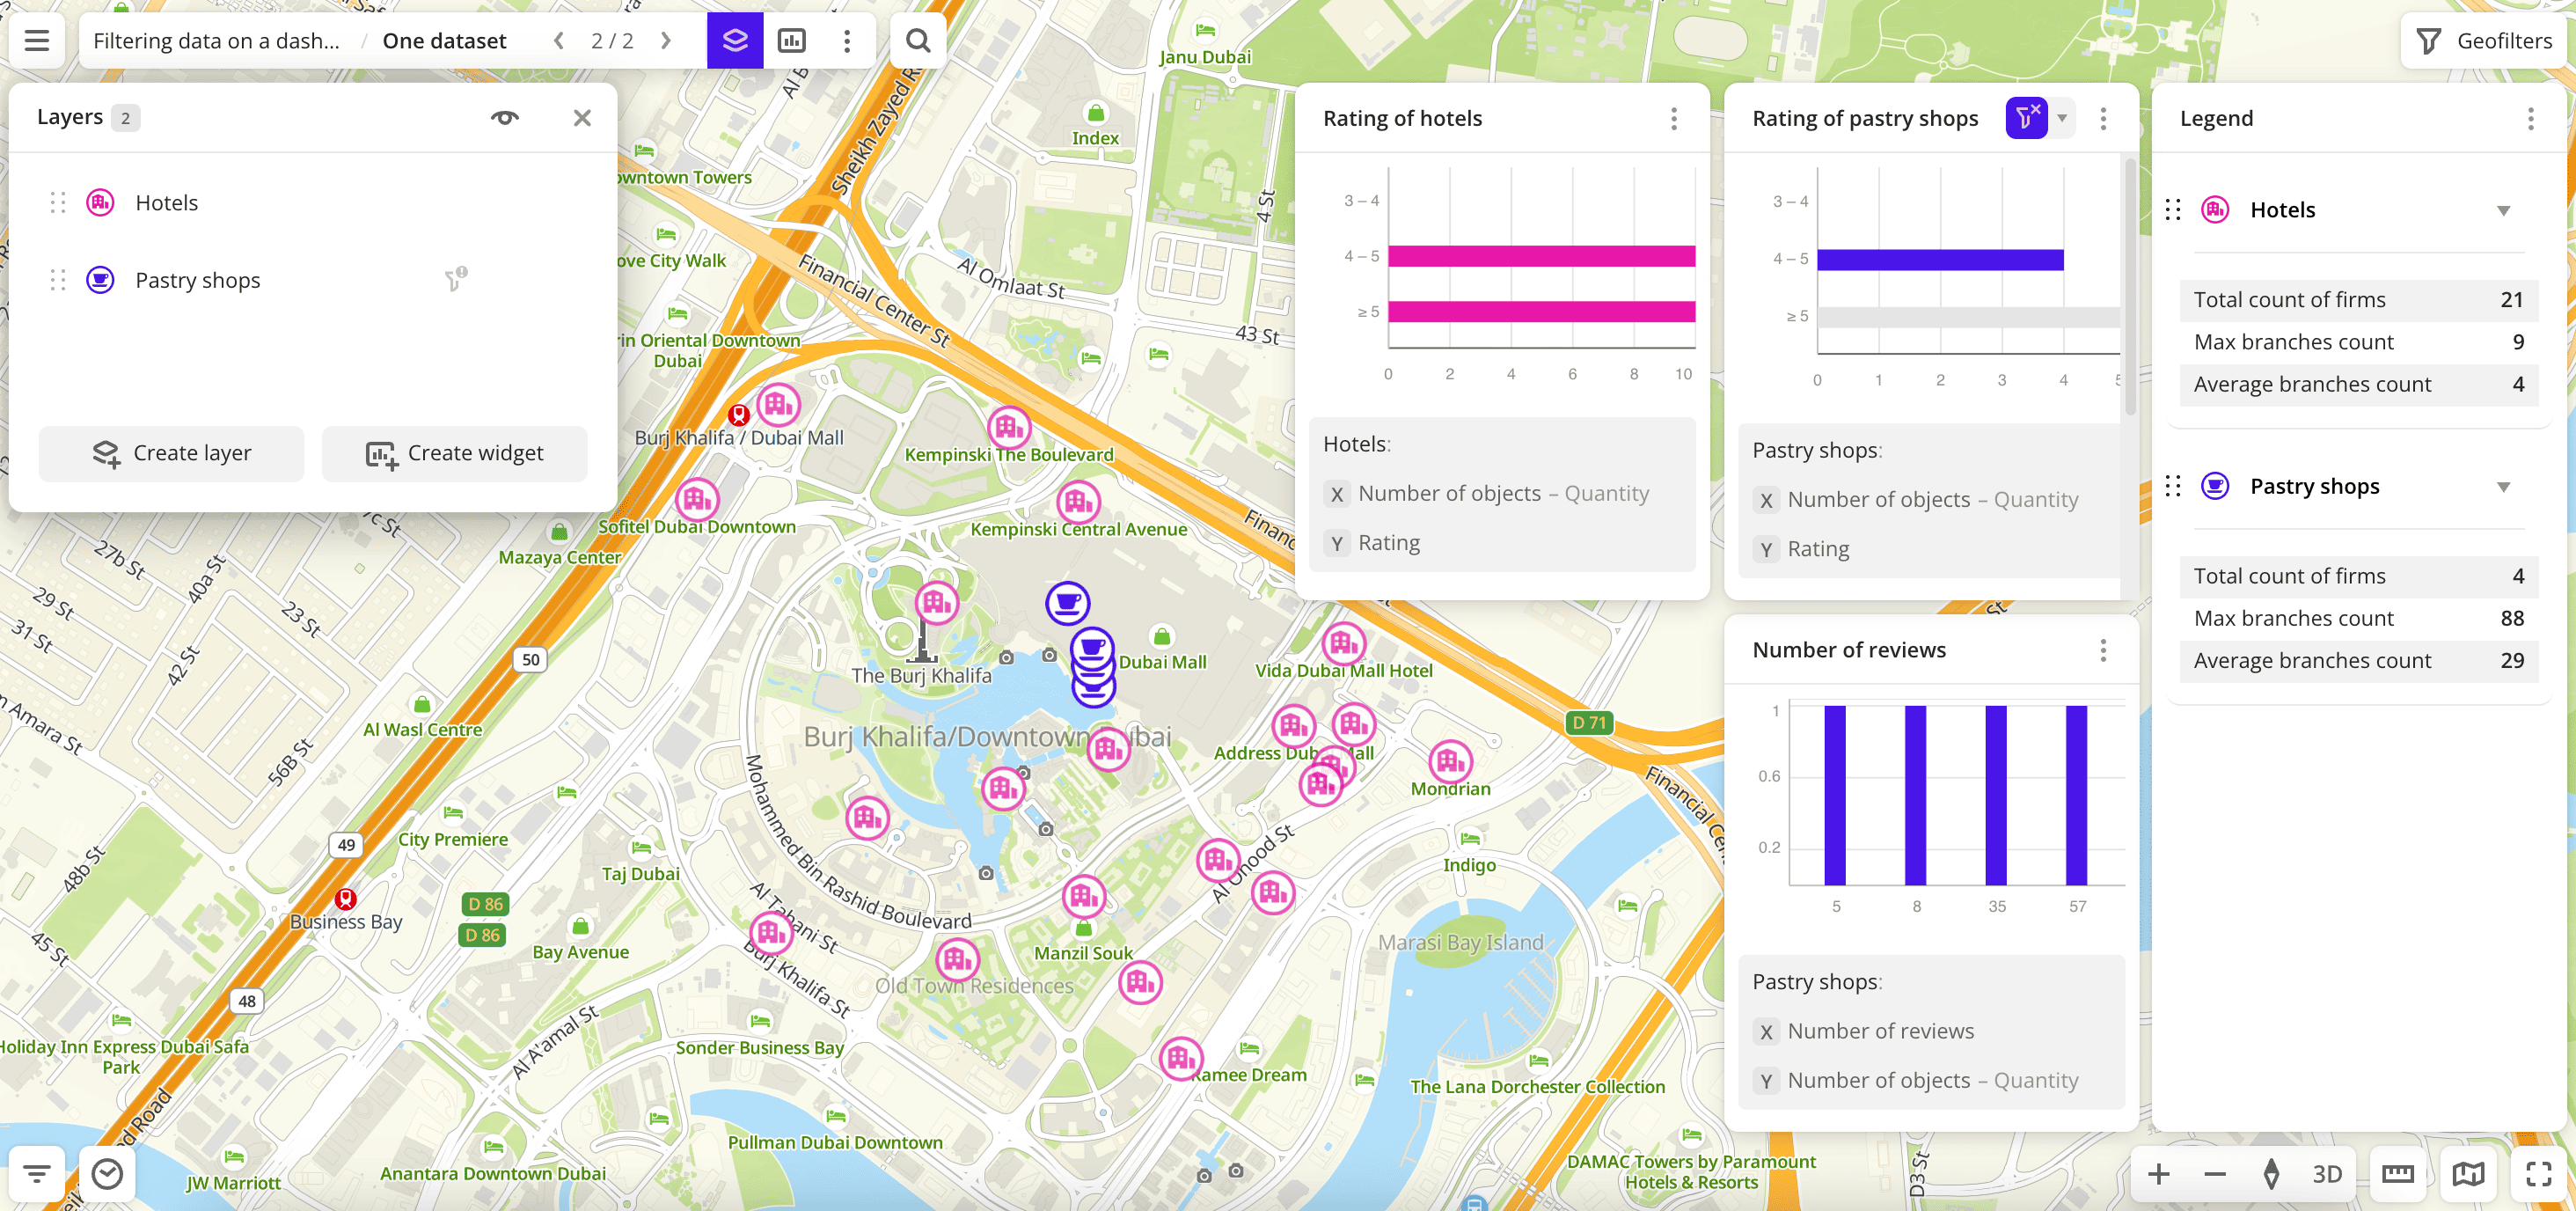
-
In the
Rating of pastry shopswidget, open the drop-down list next to icon and select Apply to all layers. The list will show all layers to which the filter will be applied: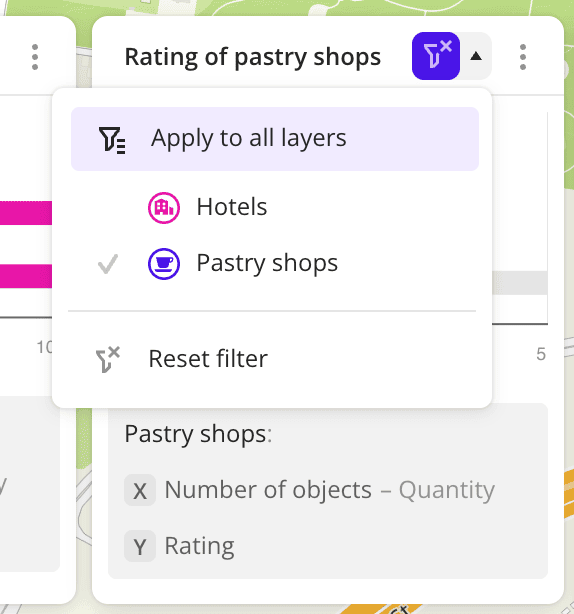
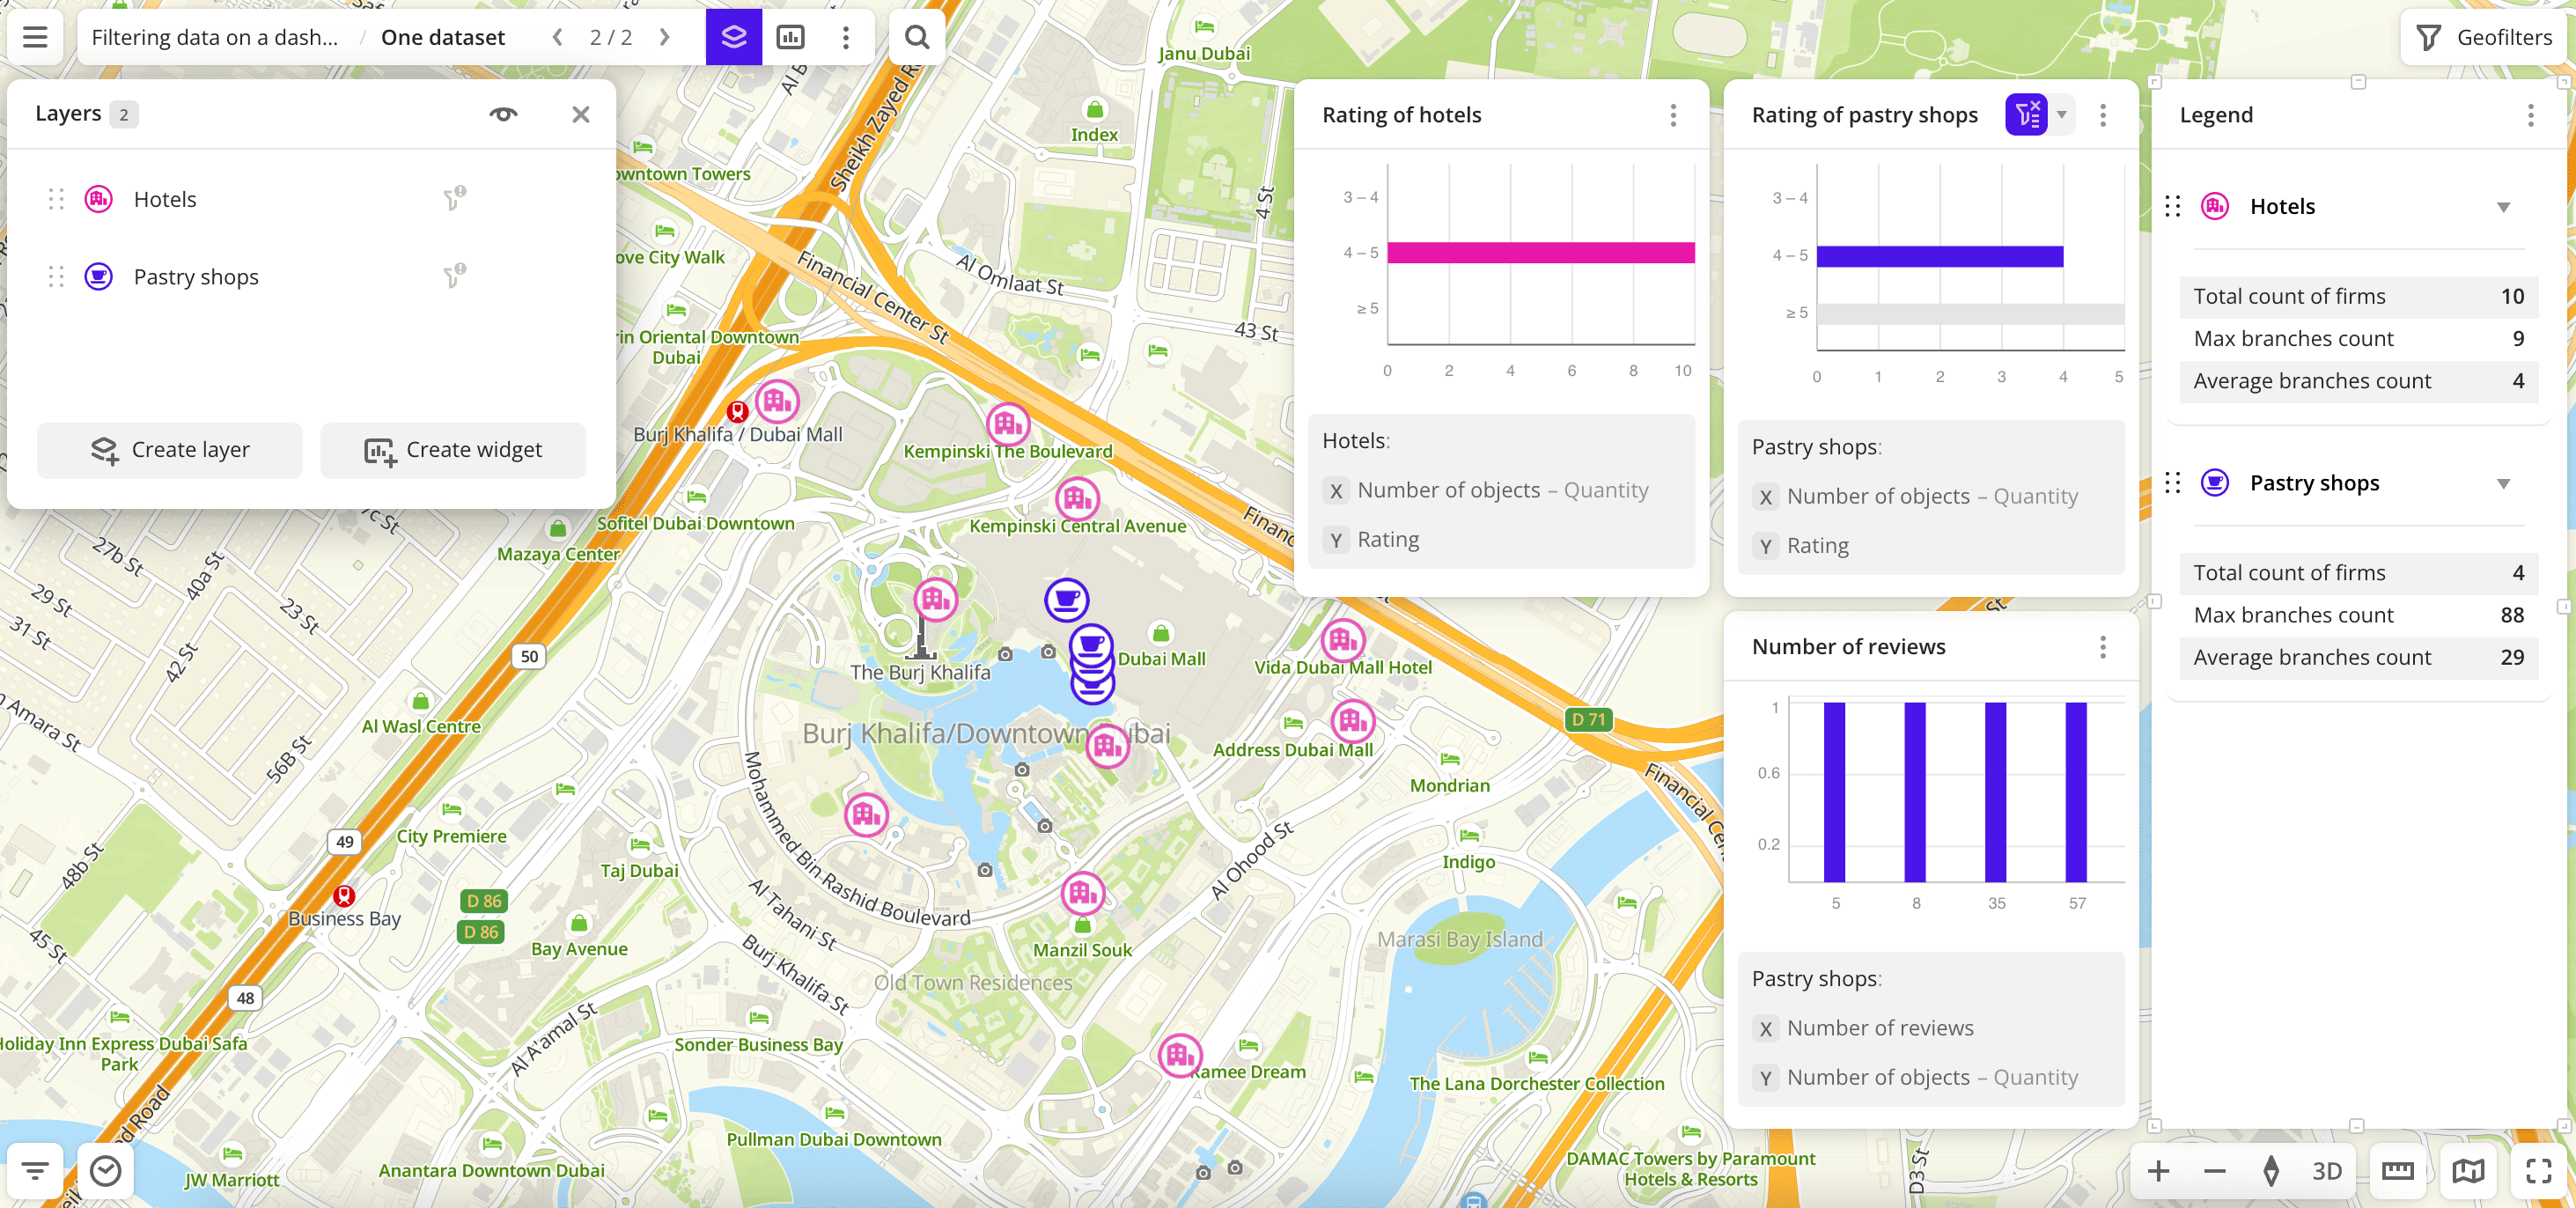
As a result, the filter Rating is applied to both layers, because they are created from the same dataset. Only pastry shops and hotels with a rating from 4 to 5 remain:
- on the map
- in the
Rating of pastry shopsandNumber of reviewswidgets created from thePastry shopslayer - in the
Rating of hotelswidget created from theHotelslayers - in the
Legendwidget
To apply a filter only to the source layer, open the drop-down list next to ![]() icon in the widget and select Source layer only. To delete the filter, select Reset filter or click the selected chart component.
icon in the widget and select Source layer only. To delete the filter, select Reset filter or click the selected chart component.
By global attributes
When filtering data in multiple layers with global attributes:
- Data is filtered only in layers from datasets that contain the global attribute: on the map, in the
Legend, and in other widgets from those layers. - Layers created from datasets without the global attribute and widgets from these layers do not change.
- The widget with an applied filter shows icon.
- In the layer list, layers with an applied filter show icon.
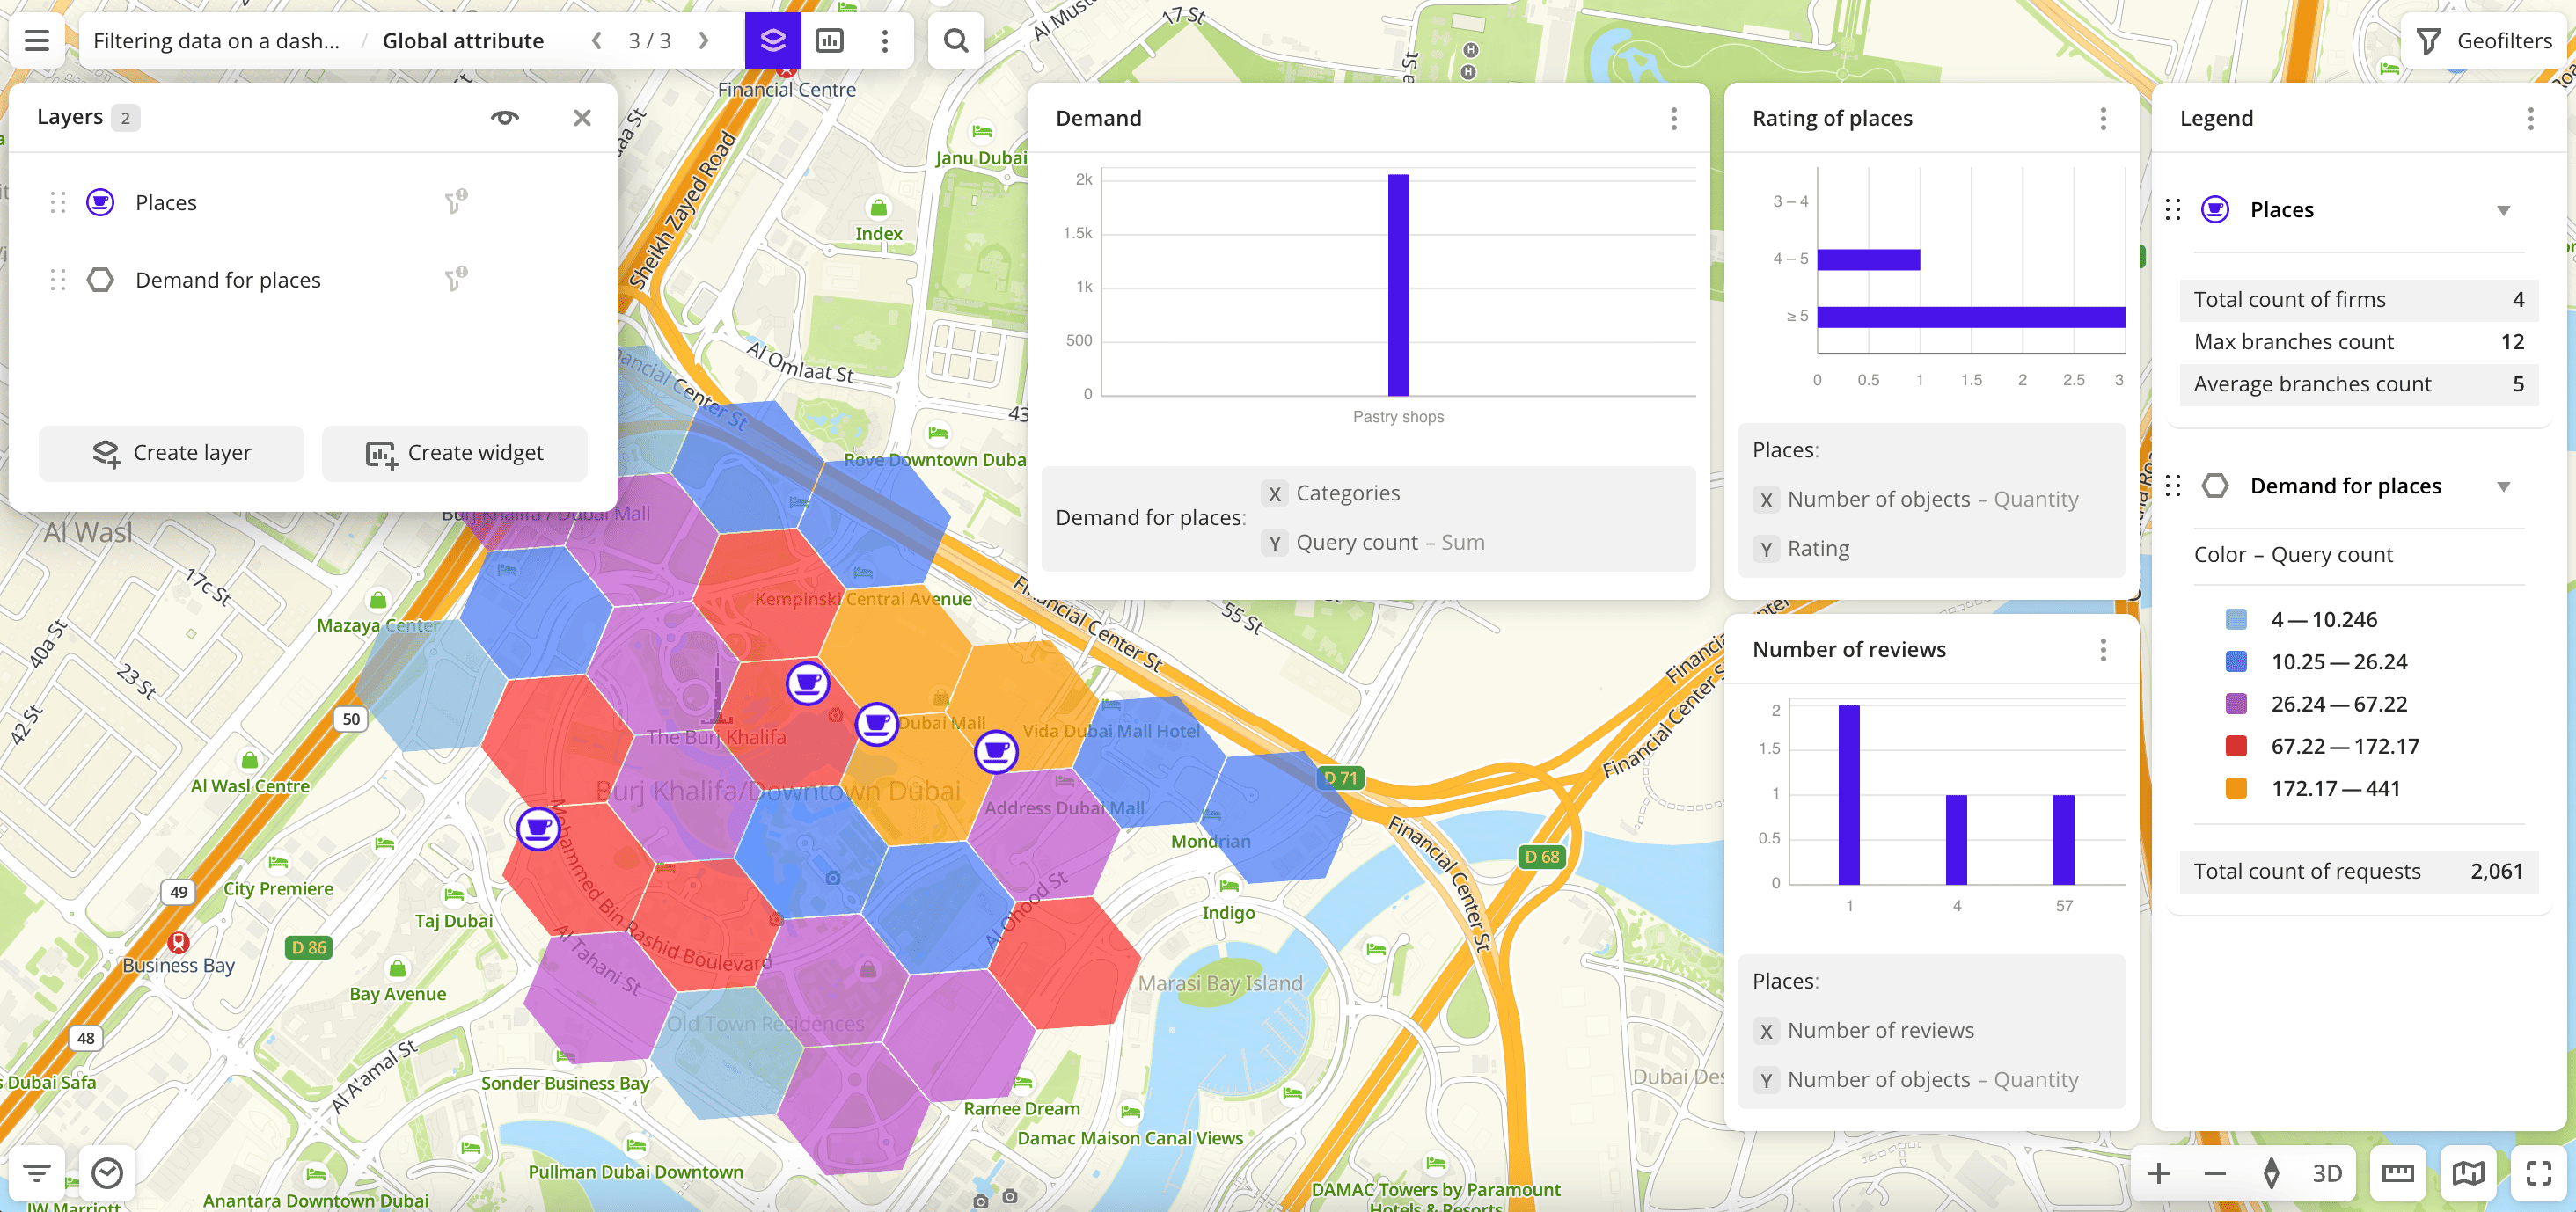
Filtering example
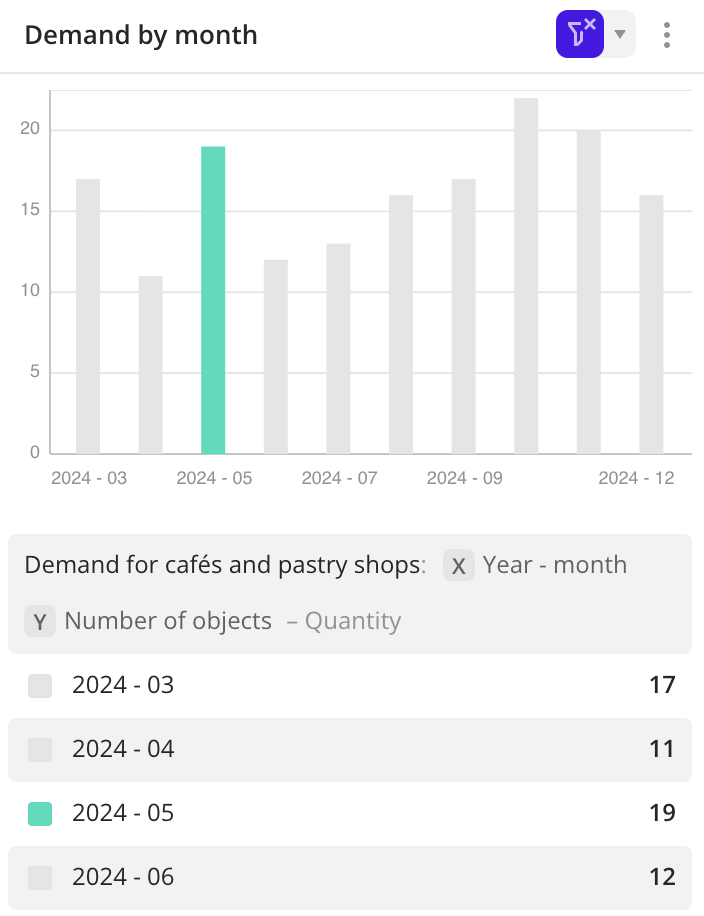
The scene shows all data of the Demand for places layer from the Demand dataset and the Places layer from the Firms dataset. These datasets contain the global attribute Categories:
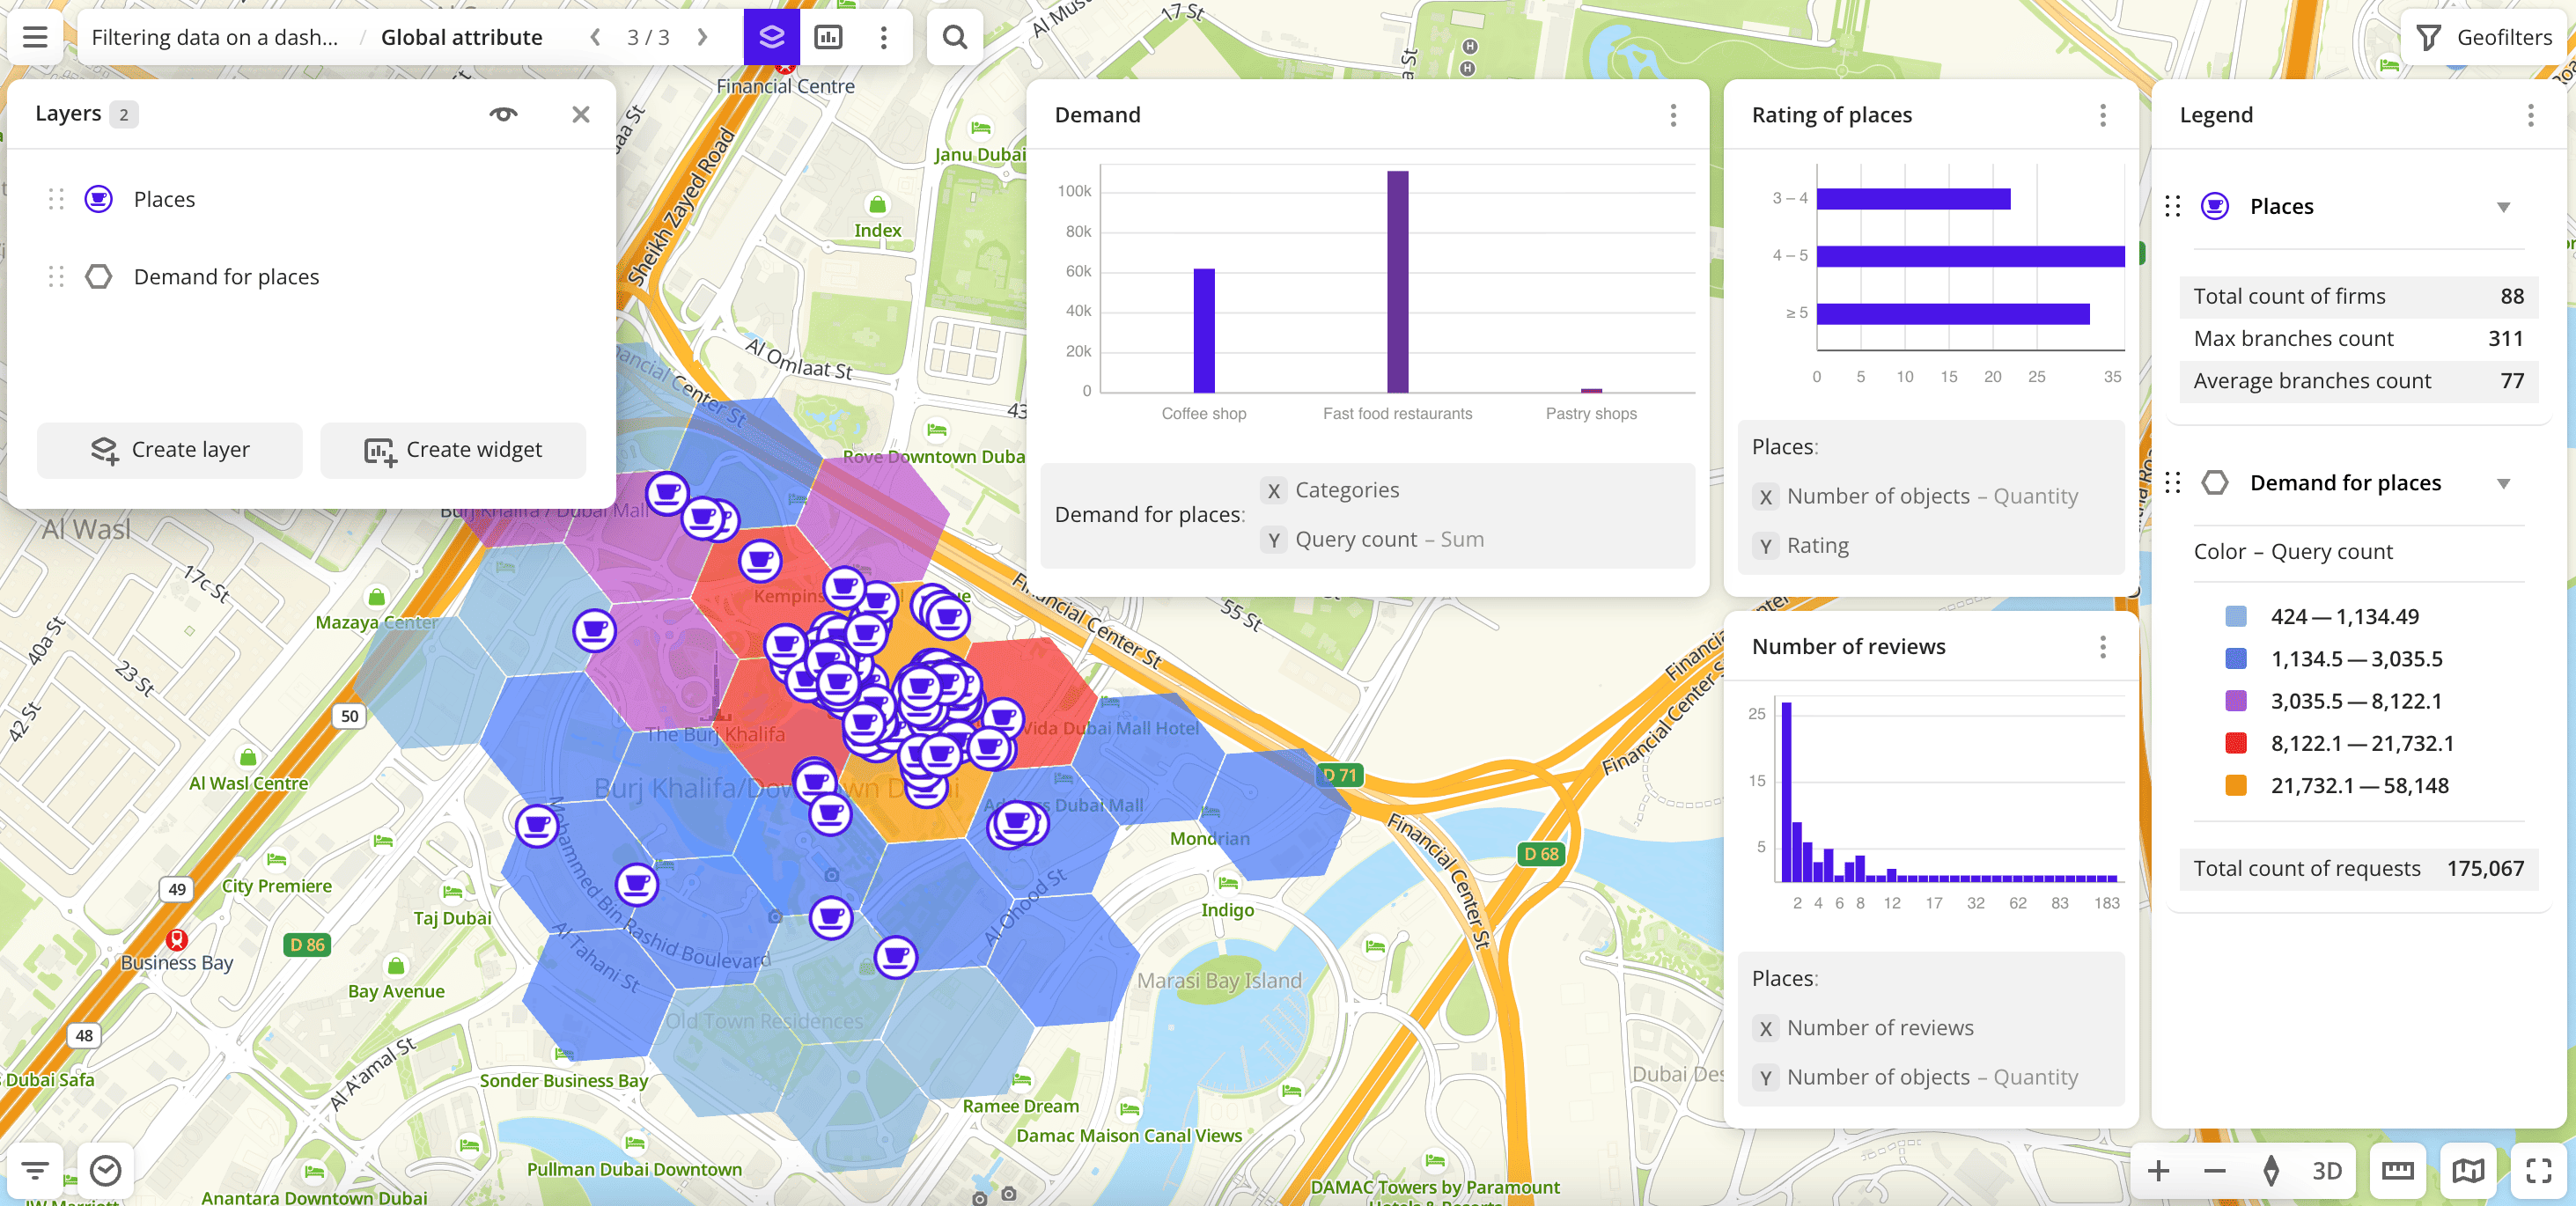
To remain only pastry shops in both layers:
-
In the
Demandwidget created from theDemand for placeslayer, click thePastry shopsvalue (bar on the chart). By default, the filter applies only to this layer: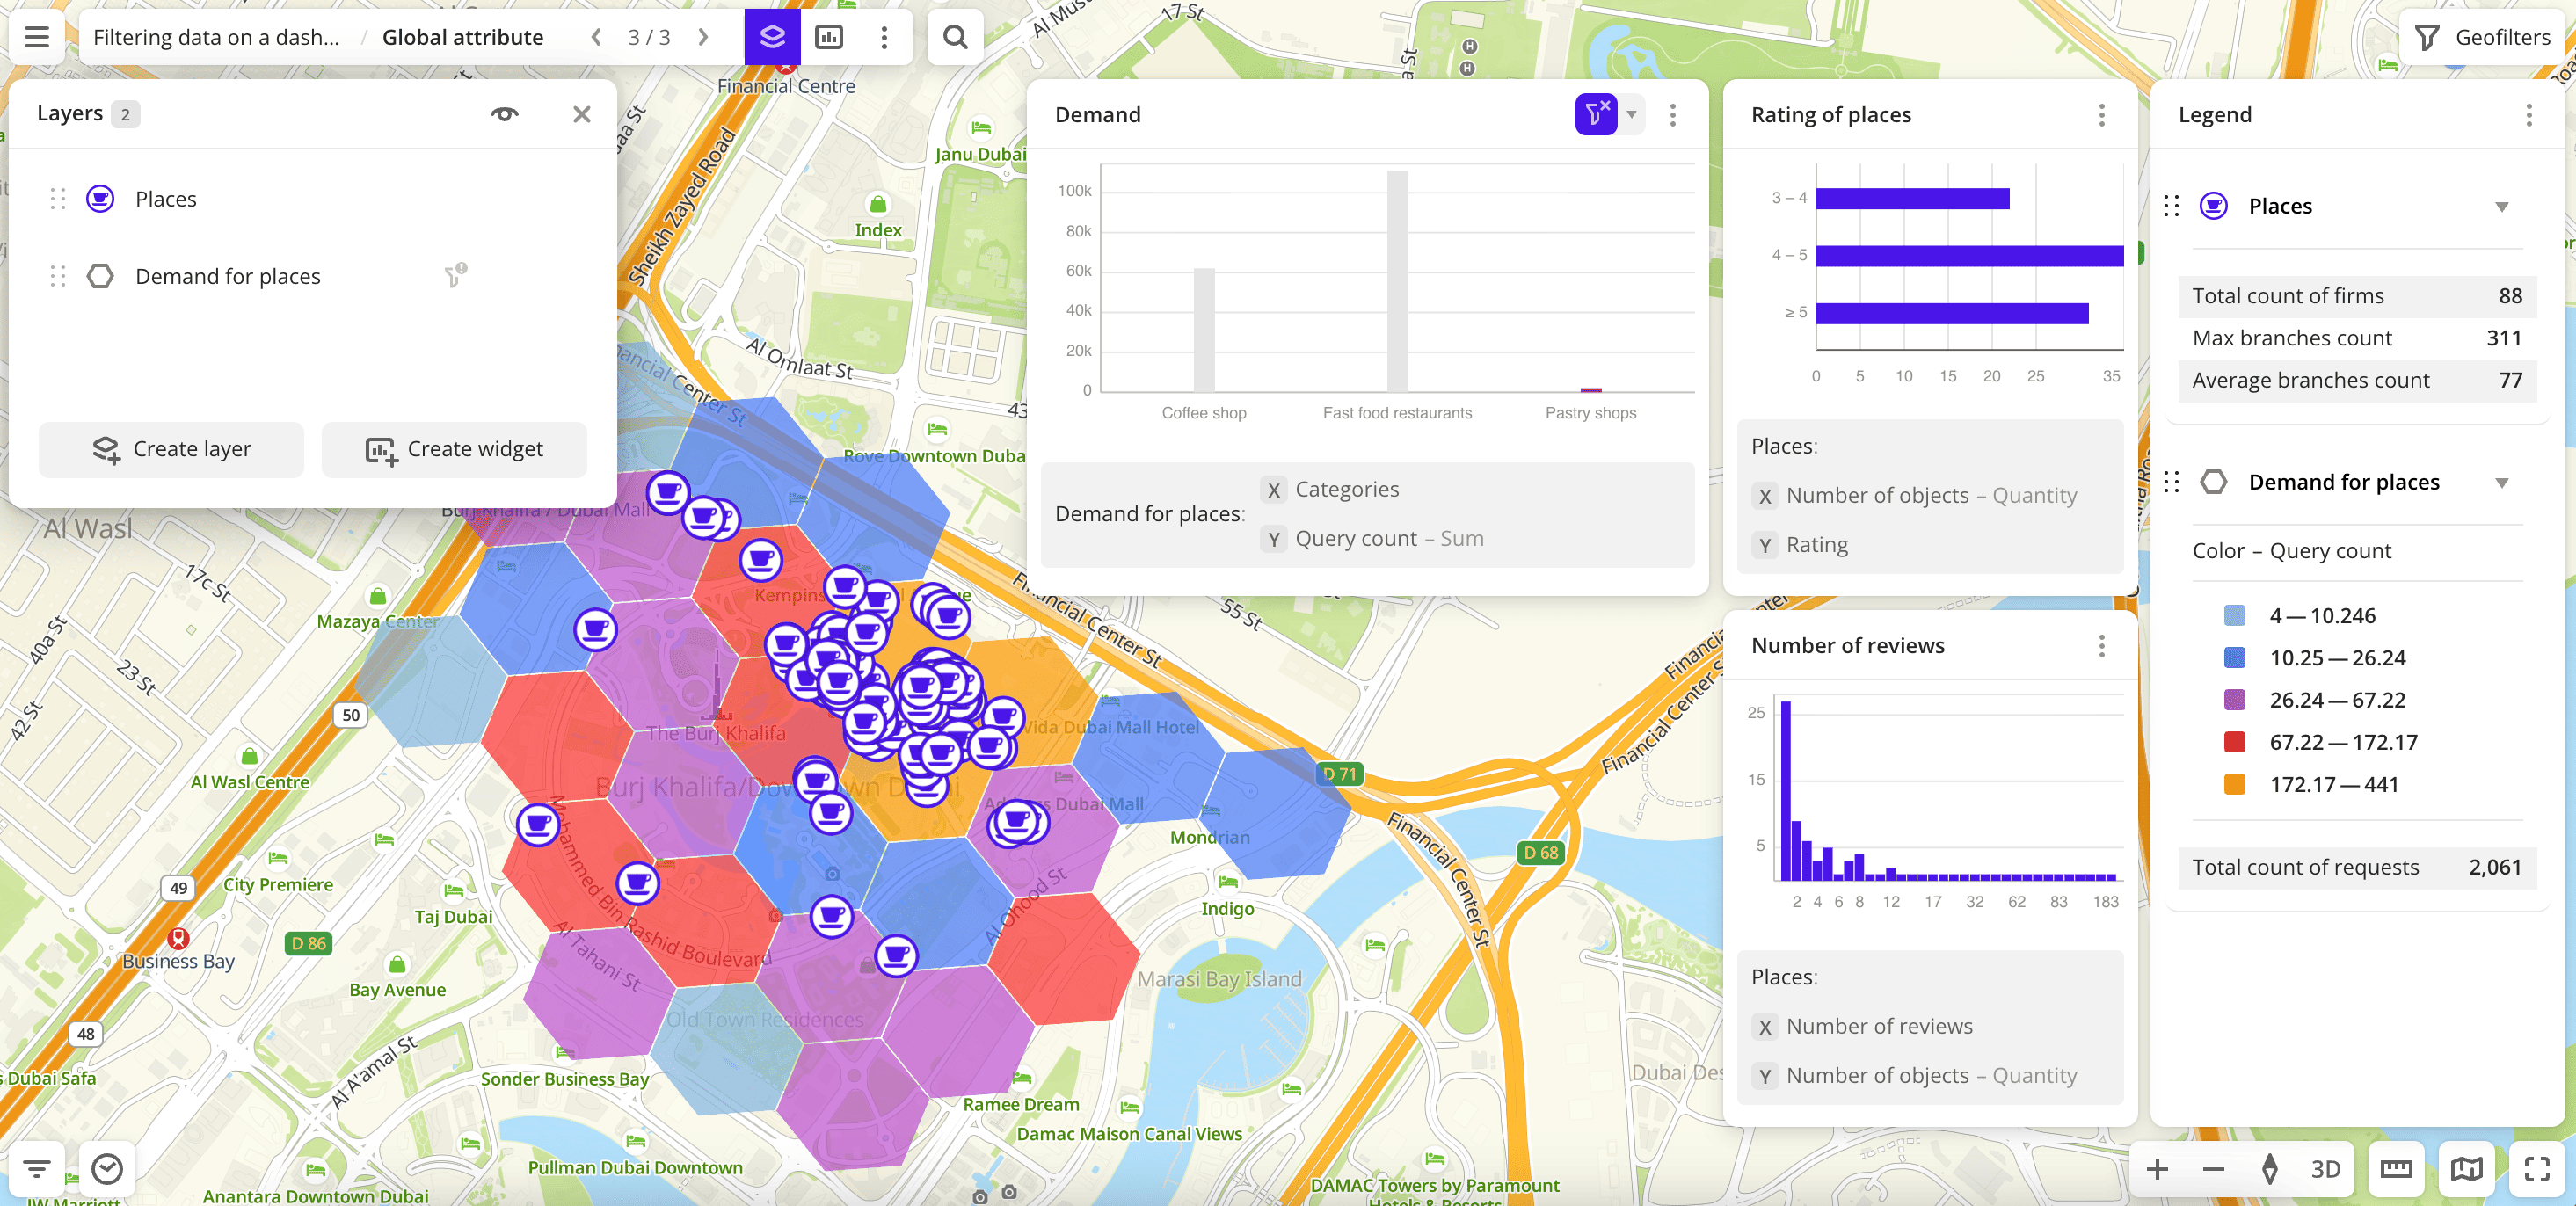
-
In the
Demandwidget, open the drop-down list next to icon and select Apply to all layers. The list will show all layers to which the filter will be applied: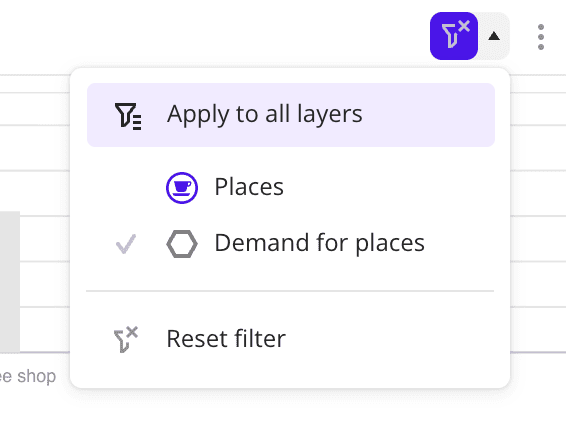
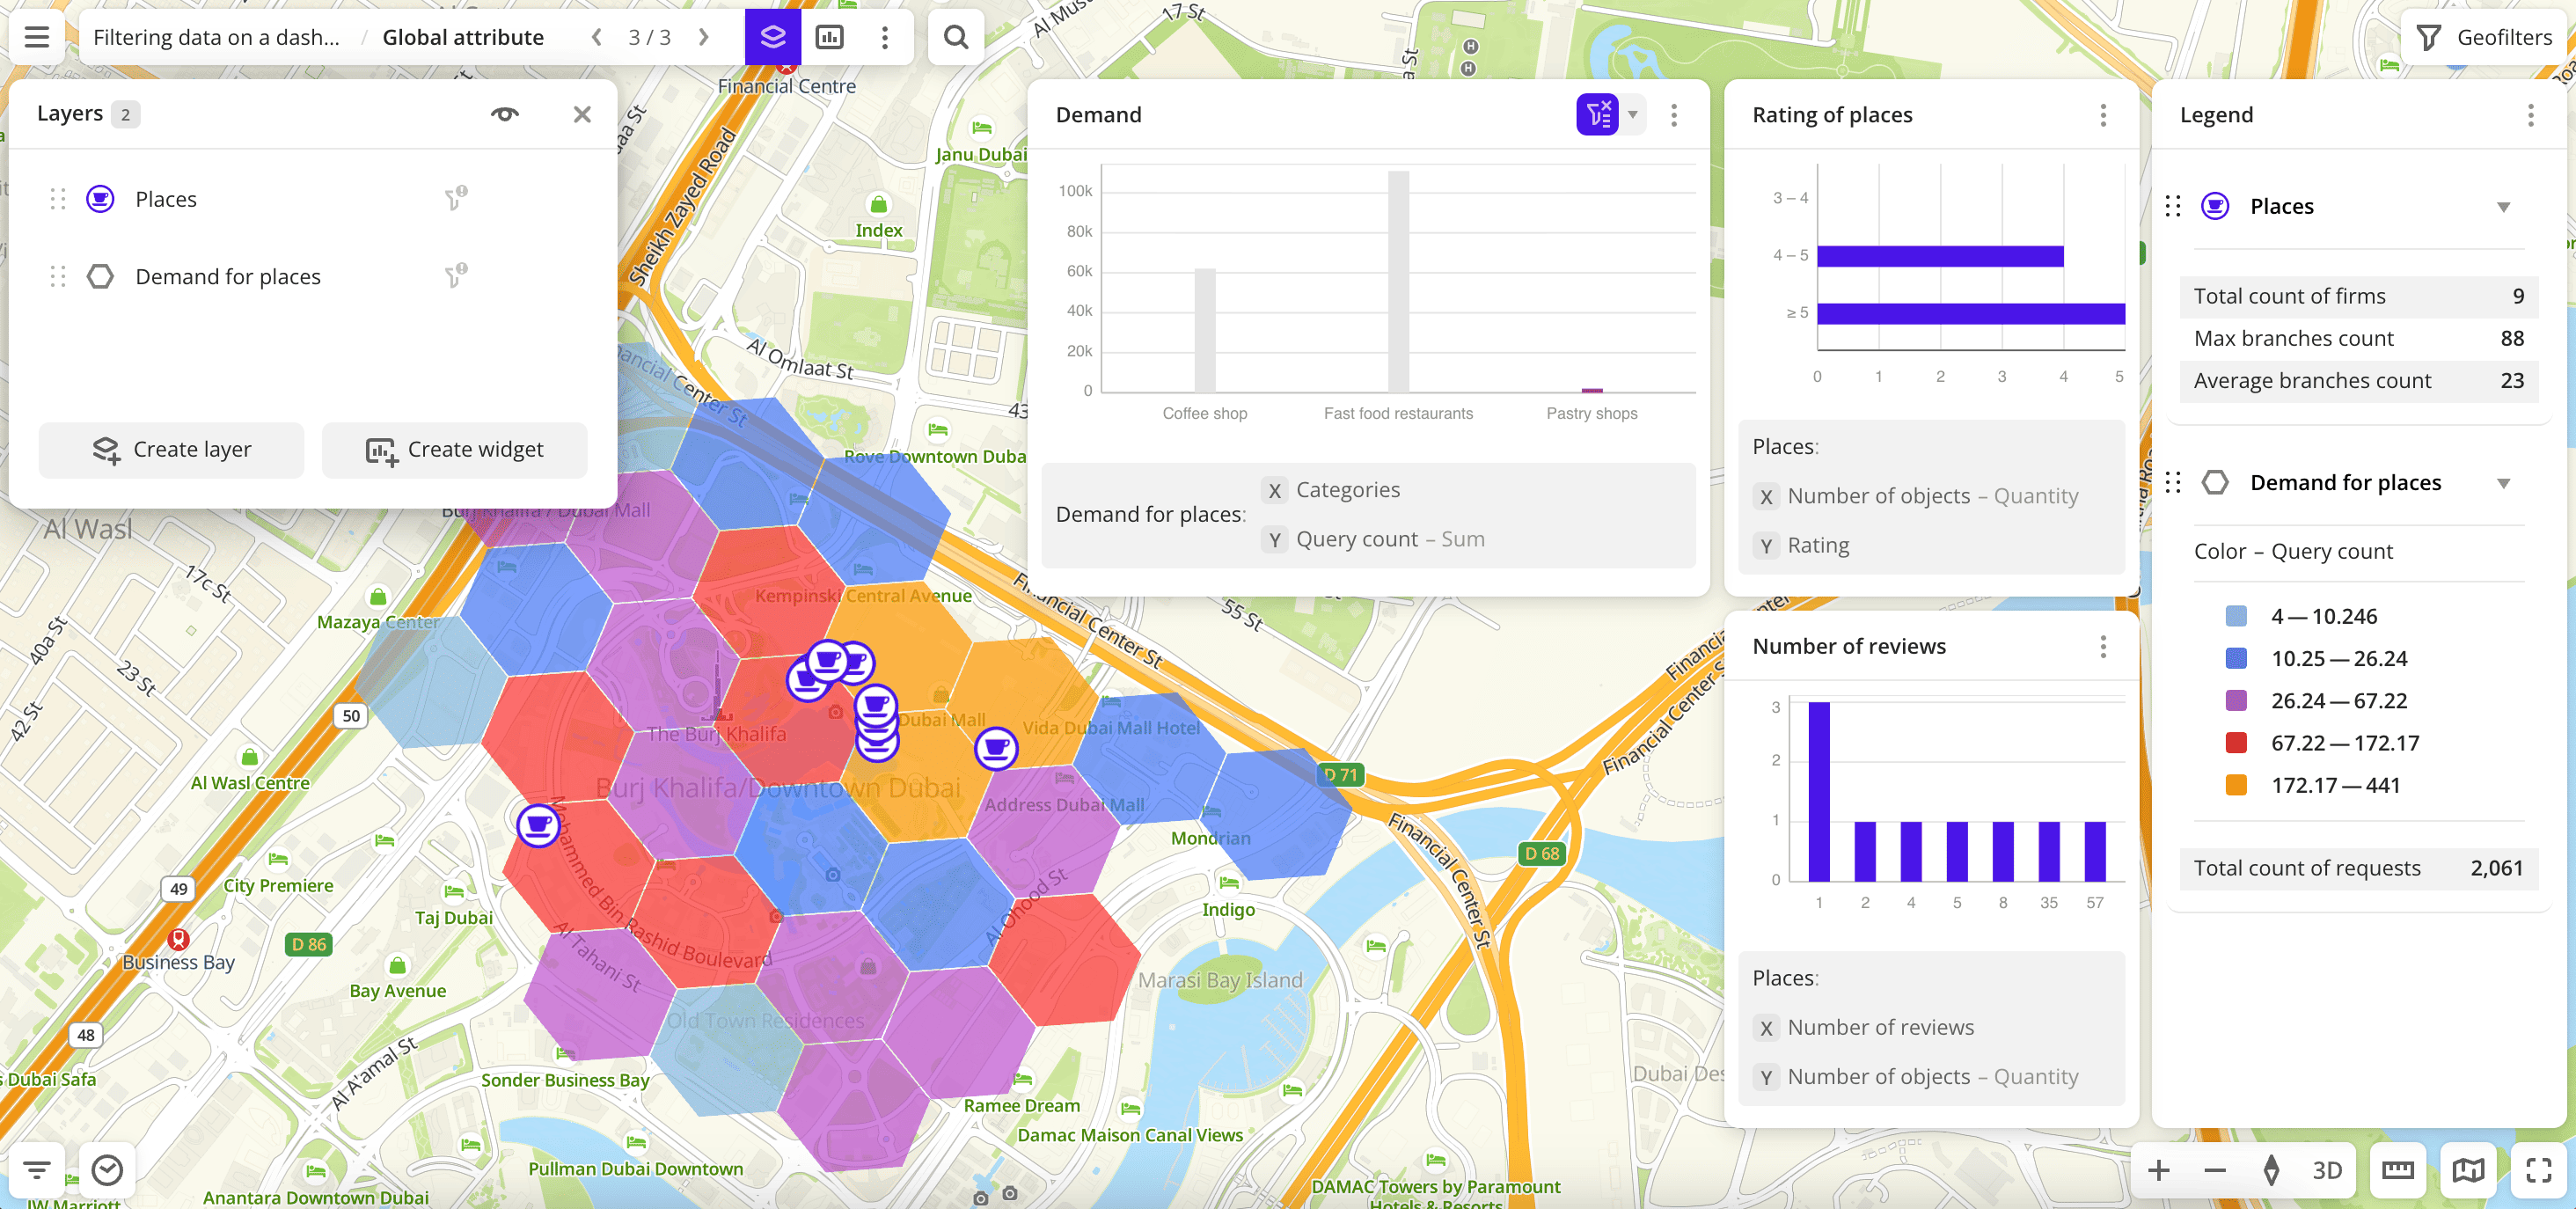
As a result, the filter Categories with the Pastry shops value is applied to both layers, because it is their common global attribute. Only pastry shops remain:
- on the map
- in the
Rating of placesandNumber of reviewswidgets created from thePlaceslayer - in the
Demandwidget created from theDemand for placeslayer - in the
Legendwidget
To apply a filter only to the source layer, open the drop-down list next to ![]() icon in the widget and select Source layer only. To delete the filter, select Reset filter or click the selected chart component.
icon in the widget and select Source layer only. To delete the filter, select Reset filter or click the selected chart component.
Combining filtering conditions
-
You can select more than one chart component. In this case, filtering conditions are combined by the logical
ORoperator. For example, if you select two ranges of number of reviews (4 and 5) in the Number of reviews widget, only the pastry shops that meet any of these conditions (with 4 or 5 reviews) will remain on the map in other widgets.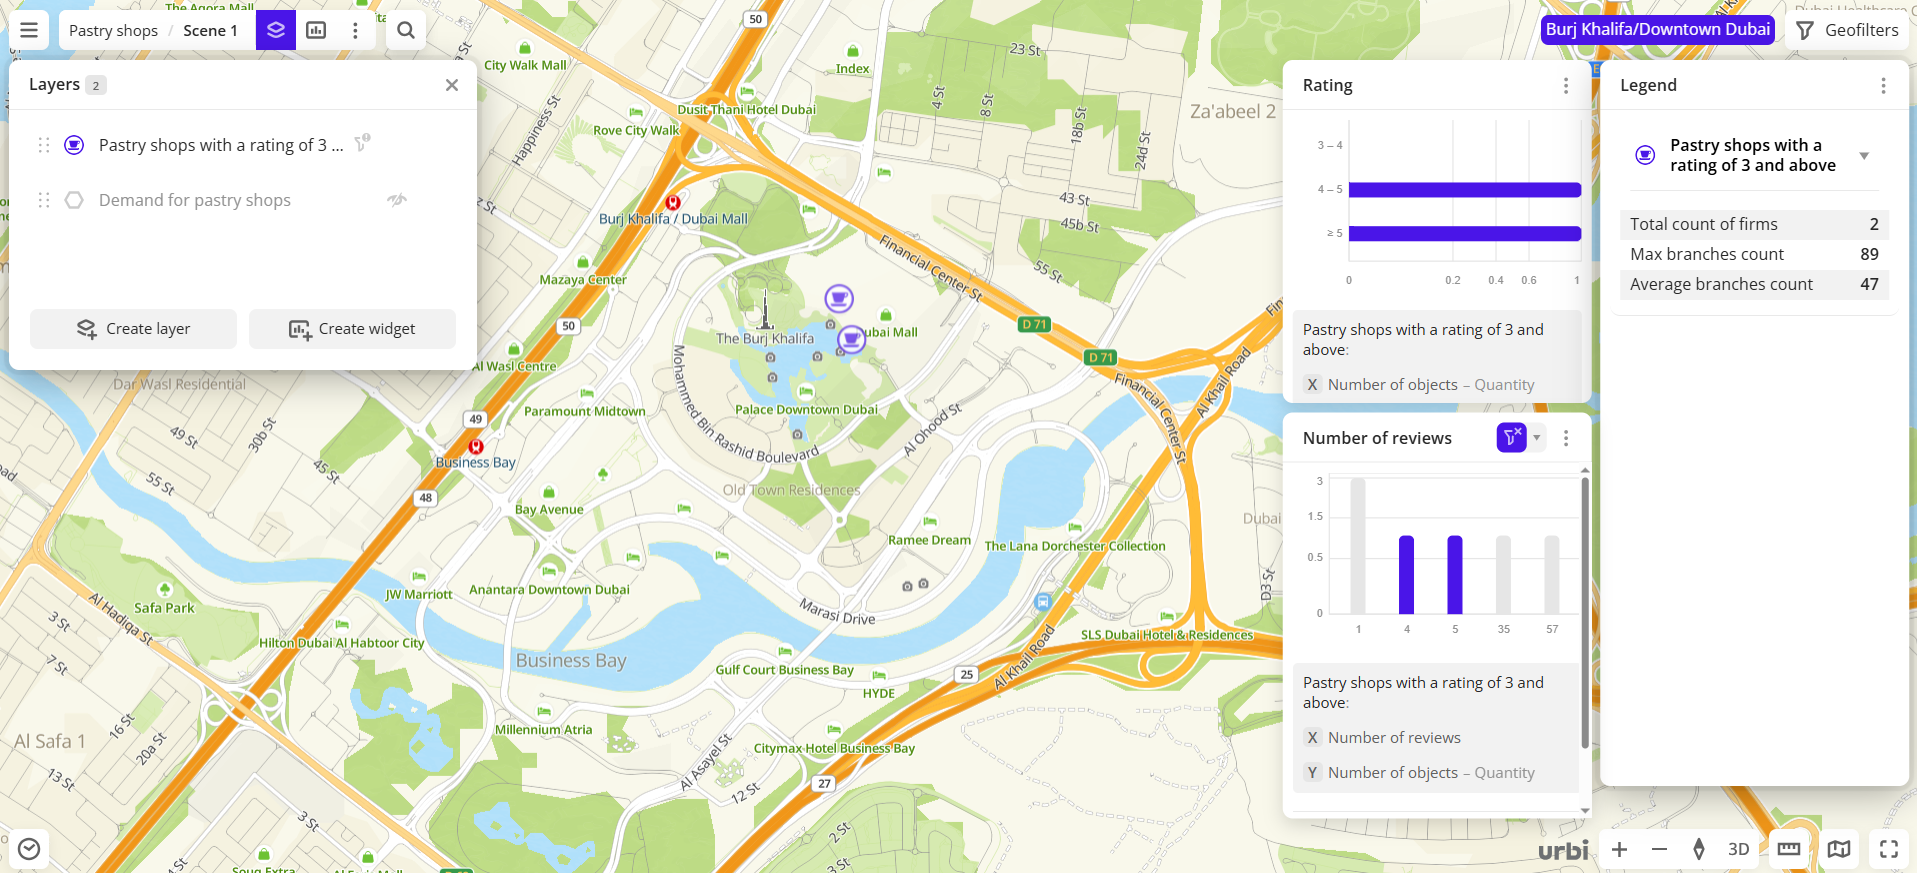
-
You can filter data through multiple widgets at the same time. In this case, filtering conditions are combined by the logical
ANDoperator. For example, if you select 4 reviews in the Number of reviews widget and the ≥5 rating range in the Rating widget, only the pastry shops that meet both of these conditions (with 4 reviews and ≥5 rating) will remain on the map and in other widgets.If the widgets belong to different layers, see details in the Filtering in multiple layers section.
Filtering via slices
To filter data by attribute values, use the Slice Filter widget.
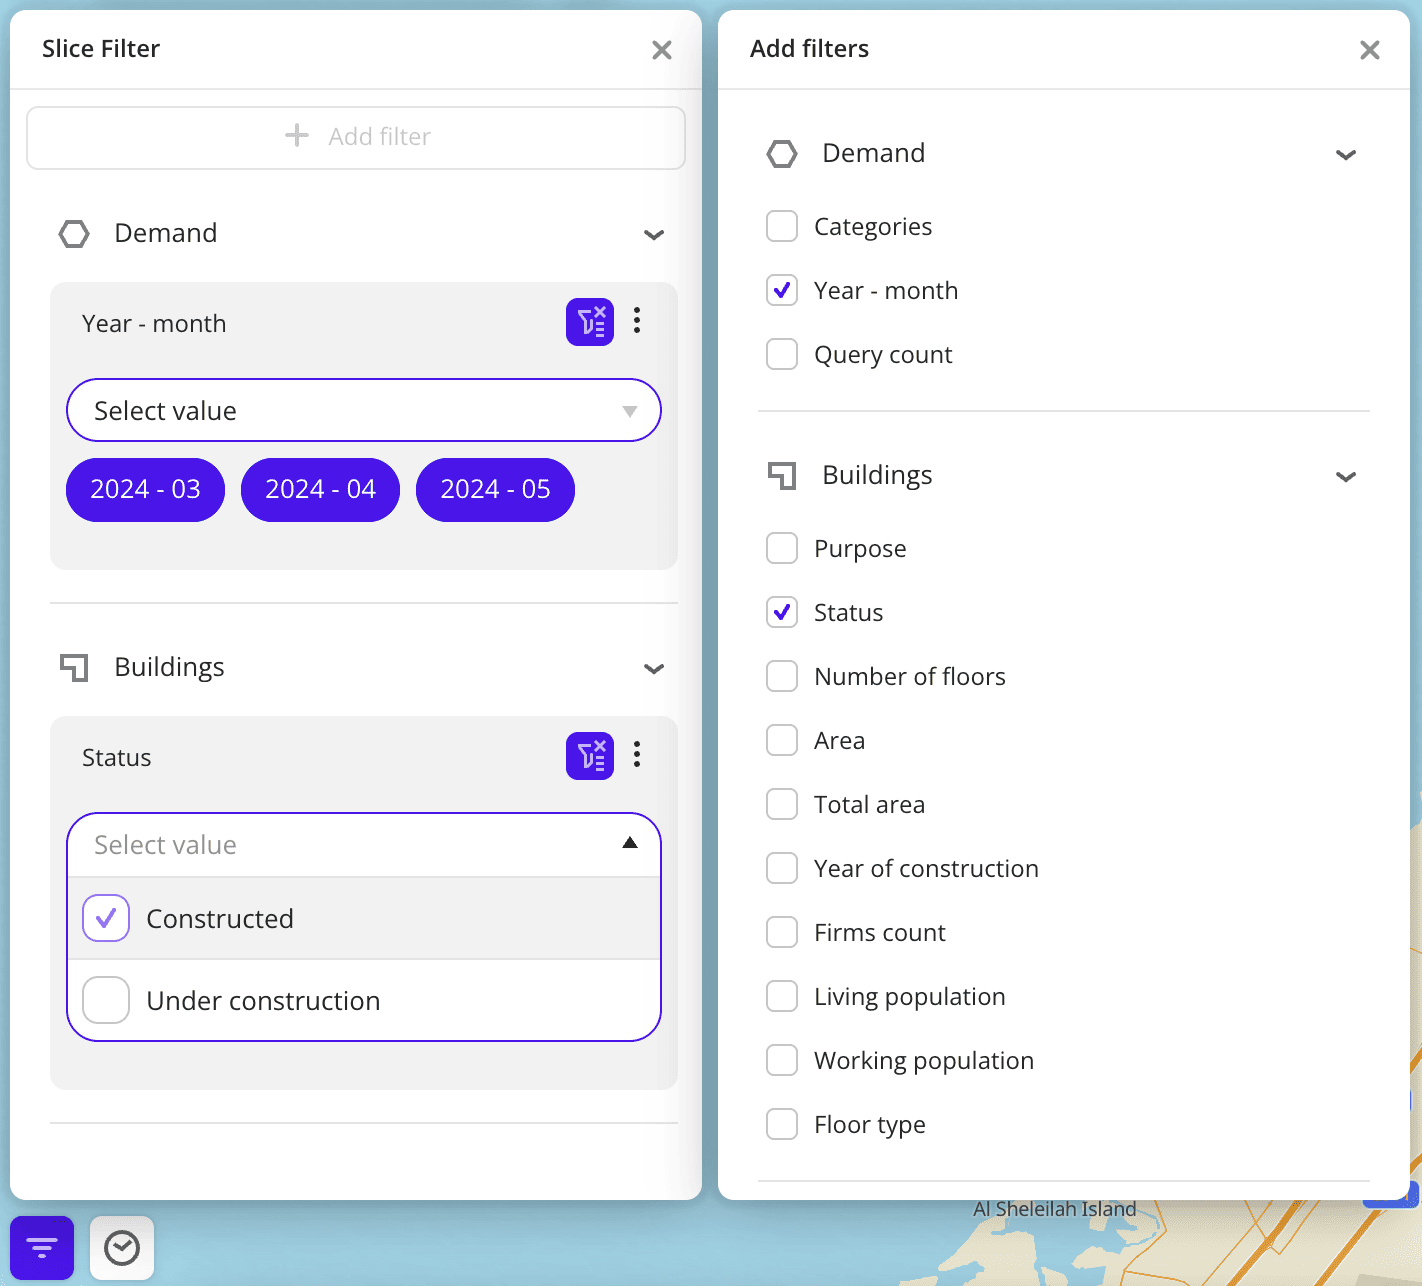
Main features
-
You can apply additional filters in one layer or in multiple layers at once using global attributes. For example, the built-in datasets Dynamics of organizations, Demand, and Firms contain the global attribute
Category. -
In the slice filter, only attribute values from the original sample are available. For example, the Status filter has values
Constructed,Under construction, andUnder repairing. When creating or modifying the data sample, you applied a filter and selected theConstructedandUnder constructionvalues. Using the widget, you can filter buildings only by these two values. For example, apply theConstructedslice to keep only constructed buildings. -
Slices may contain filter values that were not specified when you created the layer or edited the sample. For example, you selected only one value
Card paymentfor thePayment methodsfilter in the original sample of the layer. If one organization supports multiple payment methods, the Slice Filter widget may showCash payment,Online payment, and other values for this filter. -
In the slice filter, you can search by layer and attribute names.
-
If a filter applies to one layer, when filtering via slices:
- Data is filtered only in that layer: on the map, in the
Legend, and in other widgets from that layer. - Other layers and widgets from other layers do not change.
- Data is filtered only in that layer: on the map, in the
-
If a global filter is selected (common to multiple layers):
- Data is filtered only in layers from datasets that contain the global attribute: on the map, in the
Legend, and in other widgets from those layers. - Layers created from datasets without the global attribute and widgets from these layers do not change.
- Data is filtered only in layers from datasets that contain the global attribute: on the map, in the
-
In the layer list, layers with an applied filter show
icon.
If you change filter values in the original sample of a layer to which slices are applied, the filter on the scene will be reset. If you apply filtering via slices to a layer, filtering via widgets in that layer will be reset.
Filtering example
The scene shows all data of the Demand for places layer from the Demand dataset and the Places layer from the Firms dataset. These datasets contain the global attribute Categories:
To remain only pastry shops in both layers:
-
Click
 in the bottom-left corner of the scene.
 -
Click Add filter.
-
Select filters:
-
Categories: set the valuePastry shops. -
Number of employees: set the valueup to 15.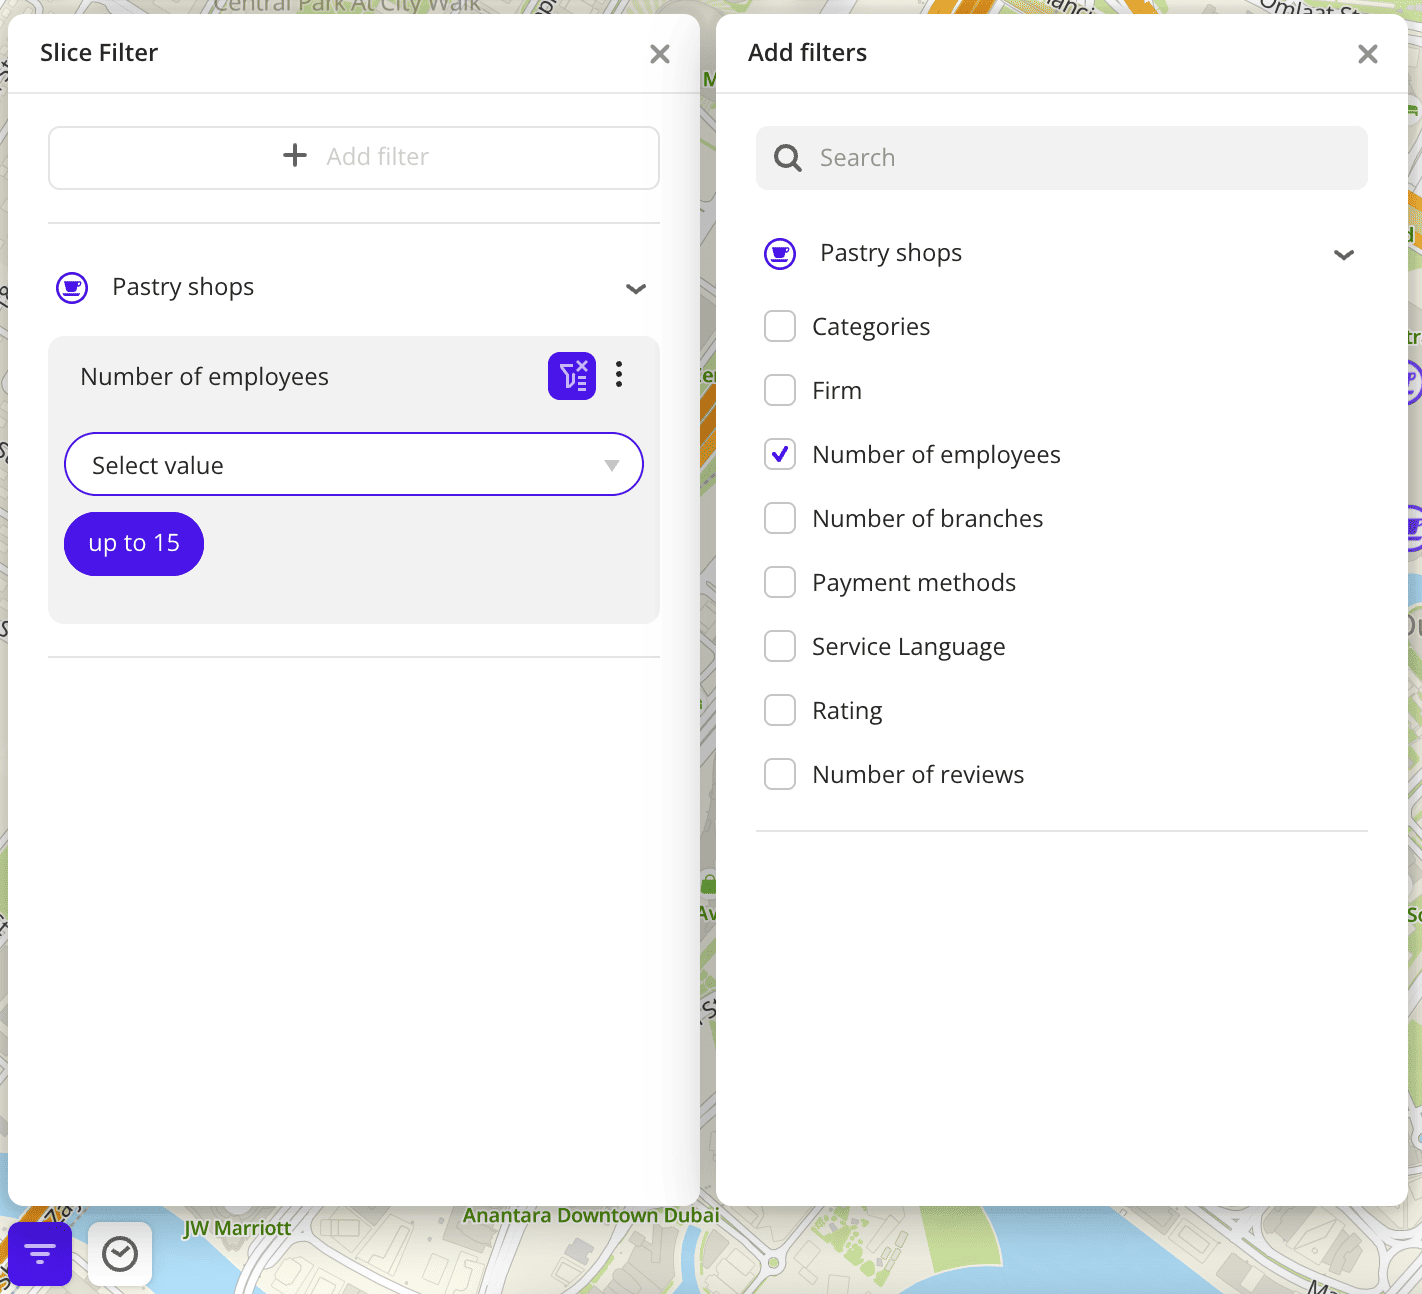
-
As a result:
-
Filter
Categorieswith thePastry shopsvalue is applied to both layers, because it is their common global attribute. Only pastry shops remain:- on the map
- in the
Rating of placesandNumber of reviewswidgets created from thePlaceslayer - in the
Demandwidget created from theDemand for placeslayer - in the
Legendwidget
-
Filter
Number of employeesis applied only to thePlaceslayer and does not affect theDemand for placeslayer, because it is not the global attribute. Only pastry shops with up to 15 employees remain:- on the map
- in the
Rating of placesandNumber of reviewswidgets created from thePlaceslayer - in the
Legendwidget
To reset a filter, open the Slice Filter widget and click ![]() icon next to the filter name. To delete the filter, click
icon next to the filter name. To delete the filter, click  icon next to its name and select Delete or clear the checkbox for the filter in the list.
Filtering via the timeline
If you uploaded a data file that contains an attribute of the Date type, you can filter sample data by this attribute using the Timeline widget. The dashboard scene will display data for the selected period. For more details, see the Timeline instruction.
What's next?
- Getting started.
- Get to know how to work with Data visualization.
- Learn more about Layers, Dashboards, Scenes, and Widgets.
- Learn about ready-made Analytics scenarios.