Cluster
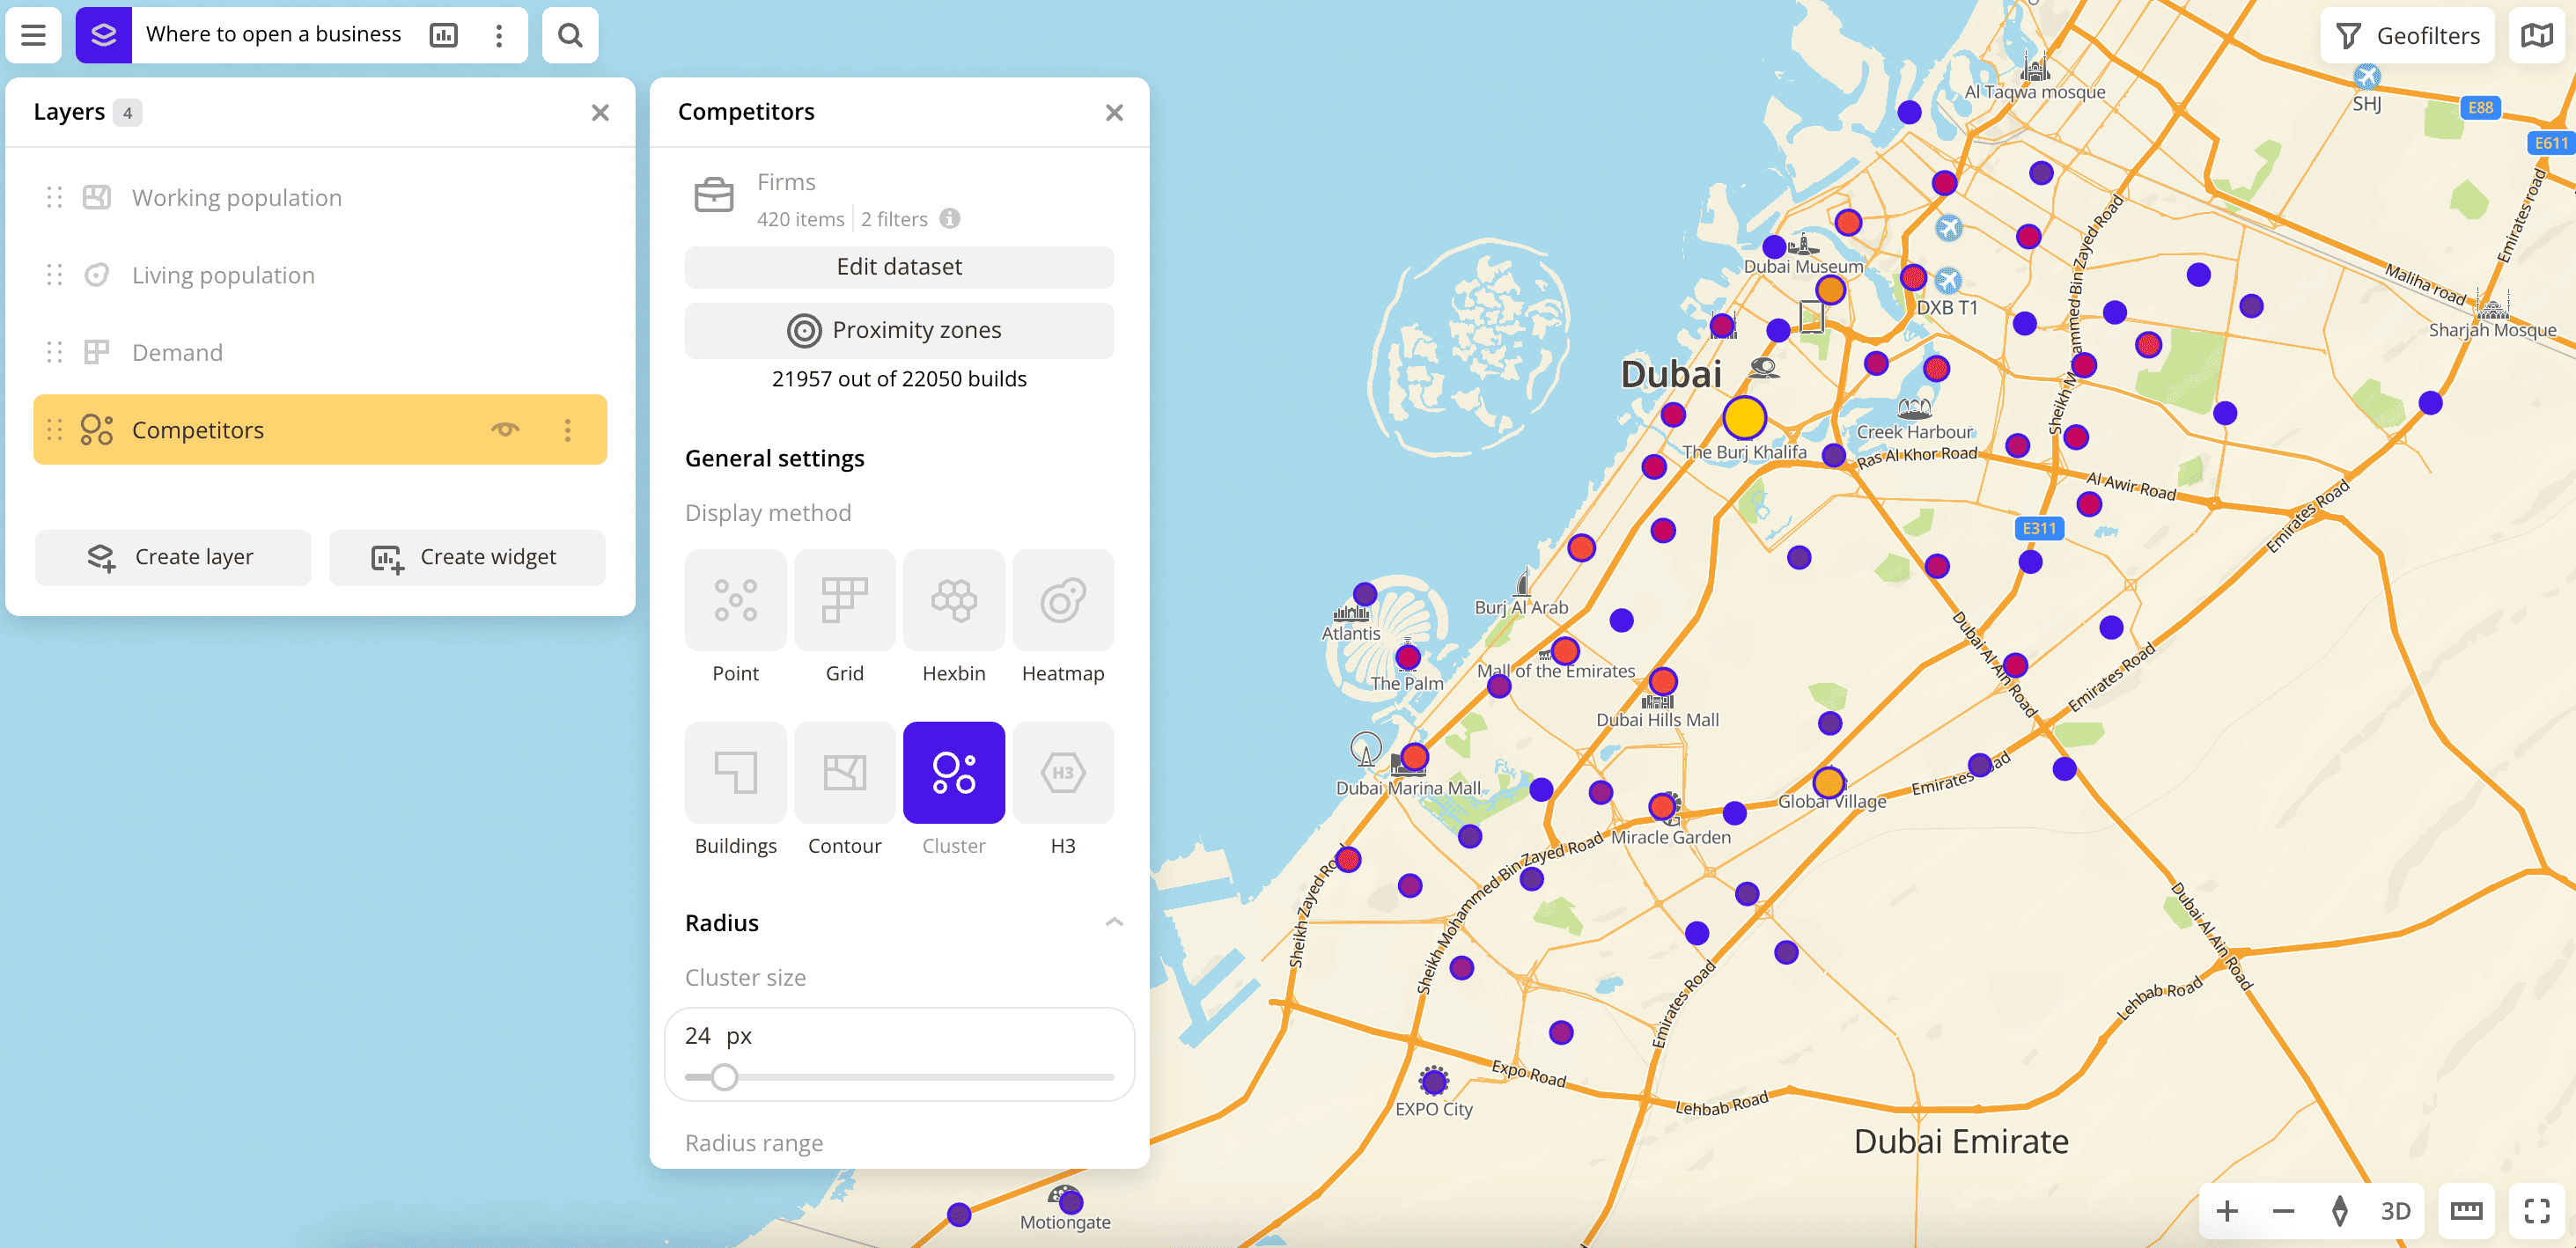
The Cluster visualization method is useful when there are too many points on the map. In this case, it is more convenient to work with their groups — clusters. The size and color of the cluster depend on the points counts covered by it.
When you zoom in on the map, large clusters first break up into smaller ones, and then into separate points. When you zoom out on the map, small clusters are grouped into larger ones.
Overview
To choose a visualization method:
- Go to the Dashboards tab.
- Open the required dashboard.
- To open the scene, use the arrows
 and
and  . If there is only one scene in a dashboard, it opens automatically when you open the dashboard.
 - To open the layer, click
 icon and select the required layer.
 - In General settings, select the Cluster visualization method.
- Set the remaining visualization parameters if necessary.
The data is visualized on the map.
Parameters
For the Cluster visualization method, the following parameters are available:
-
Radius:
- Cluster size: value in pixels from
1to250, based on which a point is included in the cluster. If there is a point at the specified distance from the cluster center, it is included in the cluster. - Radius range: radius of the element in pixels from
1to100.
- Cluster size: value in pixels from
-
Color: selecting the color of the data display.
- Color basis: parameter based on which the elements on the map are colored according to the Color scale (a set of prepared color samples). The available values depend on the data in the sample. You can select only numeric attributes.
- Invert: select to invert the selected color scale.
- Steps: gradation of the color scale from
1to10. - Legend: symbols for color and data.
- Color aggregation type: color aggregation method (
SumorMean). - Type of scale:
Linear— displays values of the same order;Logarithmic— displays a wide range of values, when the values may differ by several orders of magnitude. - Opacity: setting an opacity of the elements on the map.
-
Outline: enable to display an outline around the elements.
- Outline color: selecting an outline color on the color palette or in HEX format.
- Stroke width: stroke width in pixels from
1to25.
What's next?
- Quick start.
- Get to know how to work with Data.
- Get to know more about Layers, Dashboards, Scenes, and Widgets.
- Get to know more about other Data visualization methods.
- Get to know prepared Analytics presets.