Car traffic (aggregated)
The Car traffic (aggregated) data category provides information on average hourly car traffic. Traffic is grouped by days of the week and months. The data is updated every month.
The information on traffic is based on Urbi navigator data.
Overview
To get started:
-
Go to the Main or Data tab.
-
Select the Car traffic data category.
-
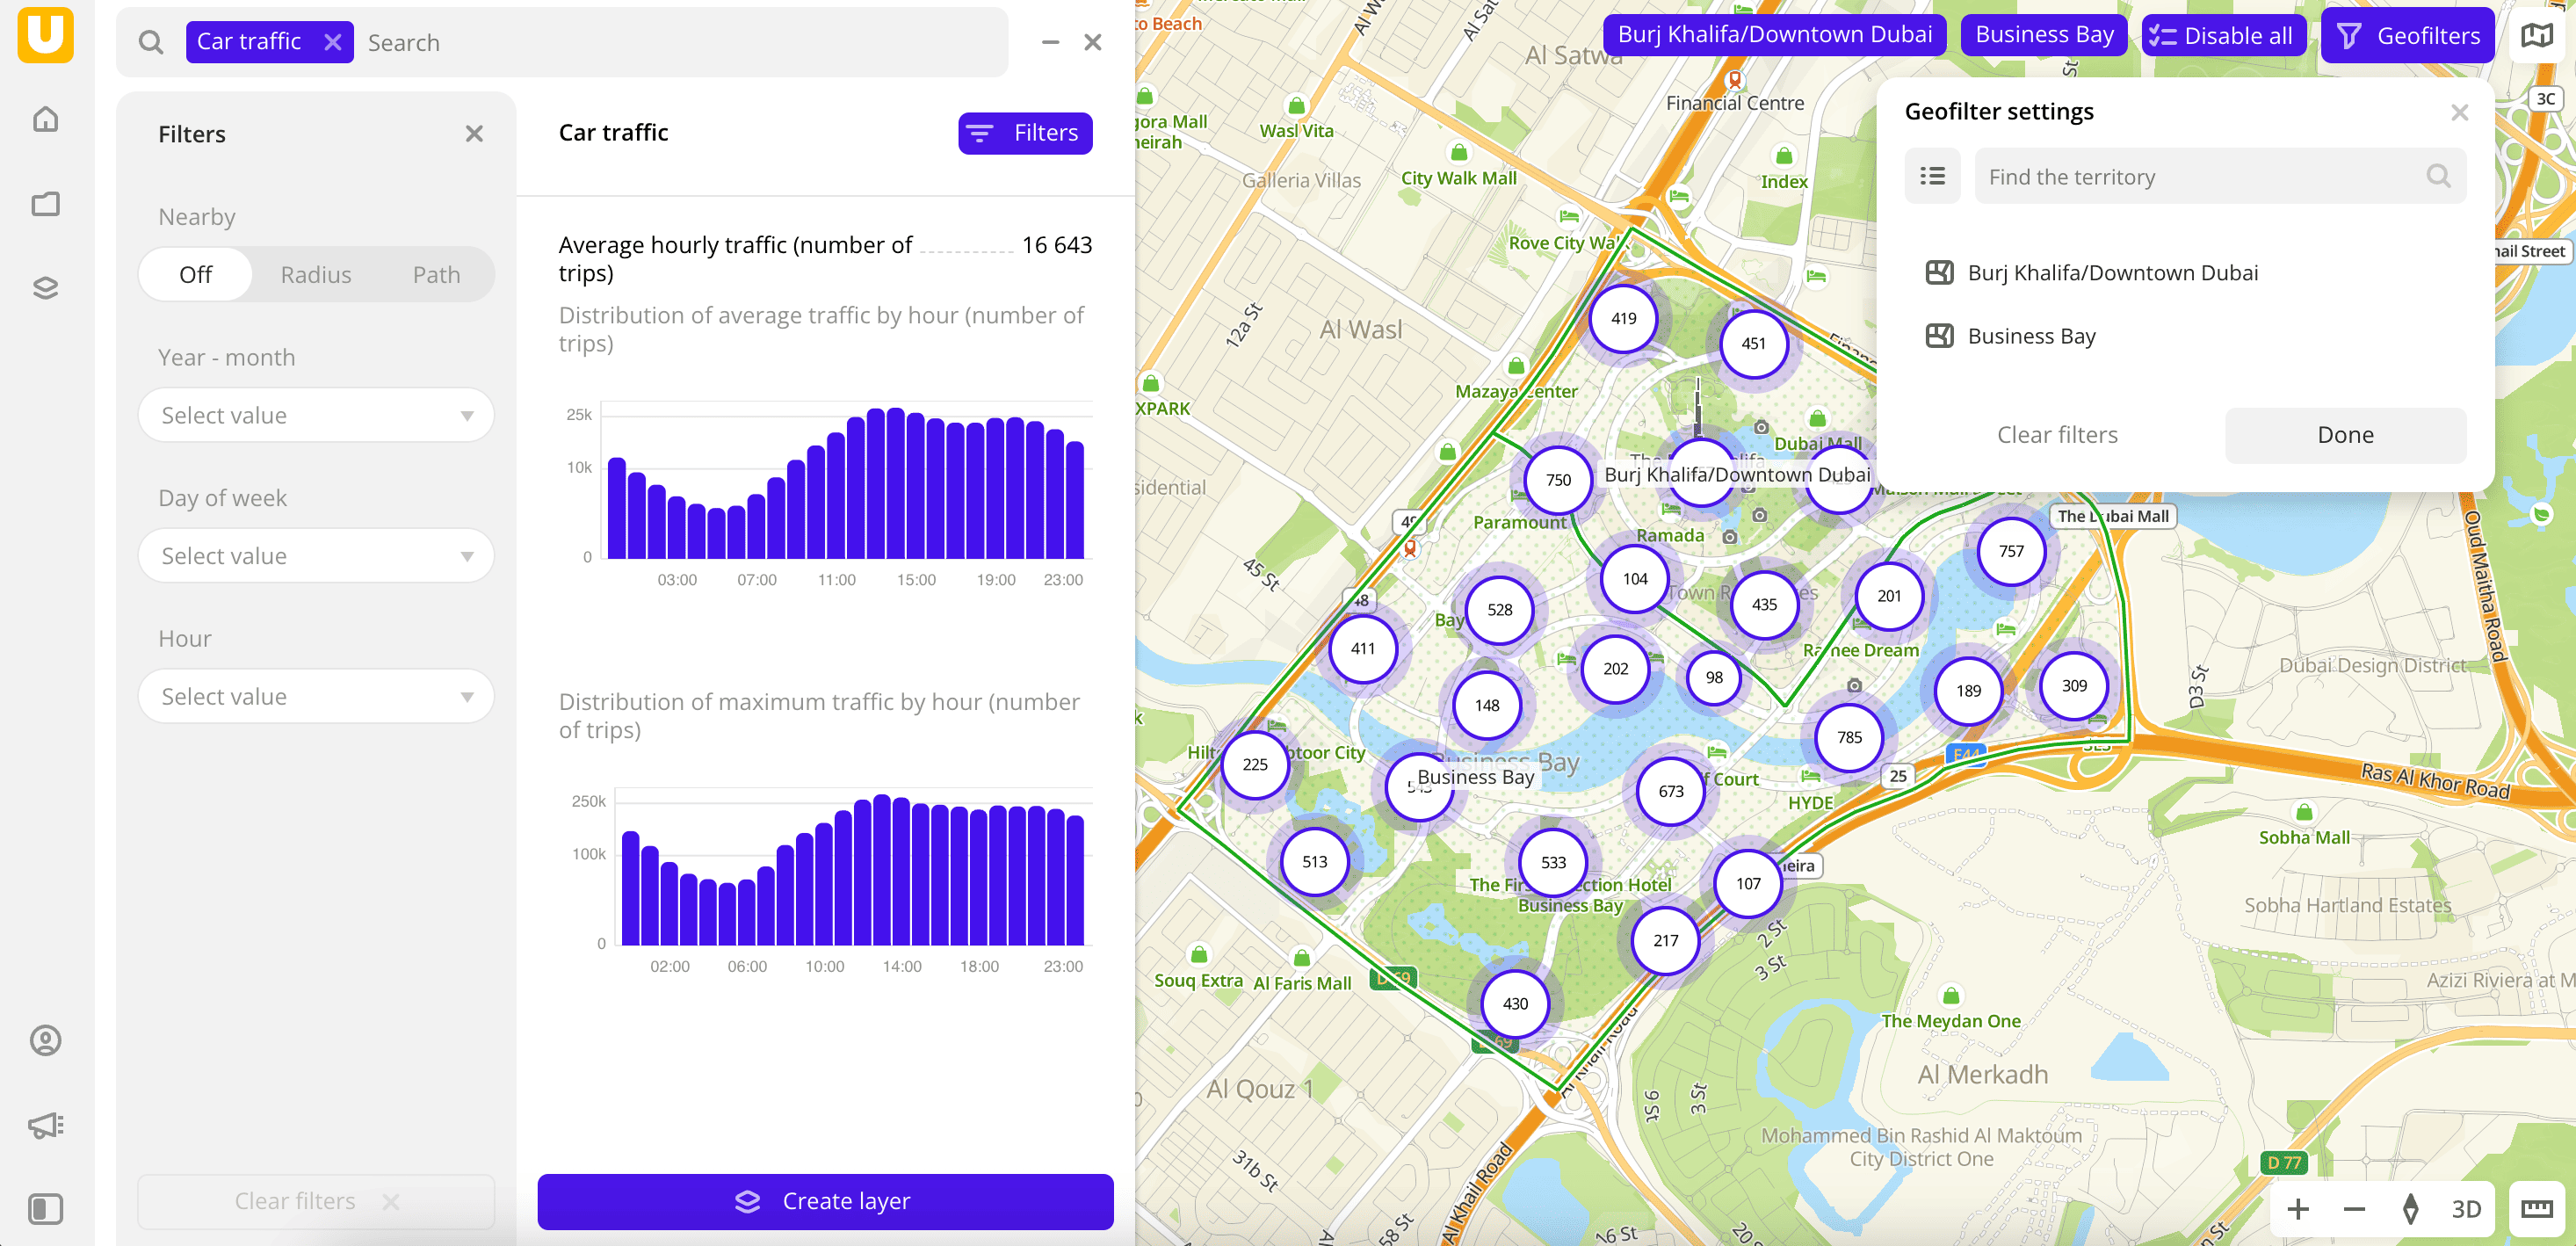
In the Geofilter settings box, select the territories for which the data sample is created (up to 50 territories). You can use:
- Suggested standard territories: regions, districts, settlements, and others. Depending on the tariff, some territories may not be available.
- Your own territorial division. To do this, first upload a dataset with polygons and create a territory filter.
Click Done.
-
Set the remaining filters if necessary.
The data is visualized on the map as centroid points: the centers of the object geometries. The following filtering results are available:
- Total count of registered trips.
- Distribution of average and maximum traffic by hour.
To save this data sample and customize its visualization (e.g., as a heatmap), click Create layer.
Filters
For the Car traffic (aggregated) category, the following filters are available:
-
Nearby: limiting the data sample by territorial availability. Possible options:
- Off: default value.
- Radius: circle with a radius from
10to100000m is drawn around a point in the center of the map. The default value is10000m. - Path: area that is accessible by car or on foot within
5to30min is drawn around a point in the center of the map. The default value is15min.
To change the area, drag the center point to the necessary area of the map.
-
Year-month: year and month to display traffic. You can select multiple options.
-
Day of week: day of the week to display traffic. You can select multiple options.
-
Hour: hour to display traffic. You can select multiple options.
To reset the parameter filter, click ![]() icon next to the filter name. To reset all parameter filters, click Reset filters at the bottom of the tab.
icon next to the filter name. To reset all parameter filters, click Reset filters at the bottom of the tab.
To reset the geofilter, in the Geofilter settings box, click ![]() icon next to the territory name. To reset all geofilters, click Reset filters.
icon next to the territory name. To reset all geofilters, click Reset filters.
Visualization
Important
For the H3 visualization method, you must set the Resolution parameter to
10so that data is displayed correctly.
What's next?
- Quick start.
- Get to know more about other Data categories.
- Get to know how to work with Data visualization.
- Get to know more about Layers, Dashboards, and Widgets.
- Get to know prepared Analytics presets.